Available online at http://Journals.ums.ac.id/index.php/fg/article/view/1667 Detection of Ground...(Tamod et al.)
Detection of Ground Water Availability at Buhias Island, Sitaro
Regency
Zetly E. Tamod1*, Bobby Polii1, Ruth Maria Sikome2
1Lecturer at Study Program of Agronomy on Specialization of Environment Science, Sam Ratulangi University,
Manado
2Teacher at Buhias Vocation School, Sitaro Regency *Corresponding author (email: [email protected])
Abstract
The study aims to detect ground water availability at Buhias Island, Siau Timur Selatan District, Sitaro Regency. The research method used the survey method by geoelectrical instrument based on subsurface rock resistivity as a geophysical exploration results with geoelectrical method of Wenner-Schlumberger
configuration. Resistivity geoelectrical method is done by injecting a flow into the earth surface, then it is measured the potential difference. This study consists of 4 tracks in which each track is made the stretch model of soil layer on subsurface of ground. Then, the exploration results were processed using software RES2DINV to look at the data of soil layer based on the value of resistivity (2D). Interpretation result of the track 1 to 4 concluded that there is a layer of ground water. State of dominant ground water contains the saline (brackish). Location of trajectory in the basin to the lowland areas is mostly mangrove swamp vegetation. That location is the junction between the results of the runoff of rainfall water that falls down from the hills with sea water. Bedrock as a constituent of rock layer formed from marine sediments that carry minerals salts.
Keywords: Resistivity, Wenner-Schlumberger, RES2DINV
Abstrak
Penelitian ini bertujuan mendeteksi keberadaan air tanah di Pulau Buhias Kecamatan Siau Timur Selatan Kabupaten Sitaro. Metode penelitian menggunakan metode survey dengan alat geolistrik berdasarkan
resistivitas batuan bawah permukaan hasil eksplorasi geofisika dengan metode geolistrik konfigurasi
Wenner-Schlumberger. Metode Geolistrik Resistivitas dilakukan dengan cara menginjeksikan arus ke permukaan bumi kemudian diukur beda potensialnya. Penelitian ini terdiri atas 4 lintasan dimana setiap lintasan dibuat model bentangan lapisan tanah di bawah permukaan tanah. Hasil eksplorasi kemudian diolah dengan menggunakan software RES2DINV untuk melihat data lapisan tanah berdasarkan nilai resistivitas (2D). Hasil interpretasi dari lintasan 1 sampai 4 menyimpulkan bahwa terdapat lapisan air tanah. Keadaan air tanah dominan mengandung garam (payau). Lokasi lintasan dicekungan sampai ke wilayah dataran rendah yang sebagian besar merupakan rawa dengan vegetasi mangrove. Lokasi tersebut merupakan daerah pertemuan antara hasil limpasan air hujan yang jatuh dari perbukitan dengan air laut. Batuan dasar sebagai penyusun lapisan-lapisan batuan terbentuk dari endapan sedimen laut yang membawa mineral-mineral garam.
Kata Kunci: Resistivitas, Wenner-Schlumberger, Res2Dinv
Introduction
Water is as an essential natural resource and it is needed by human beings and other living creature. The function of water for life is not replaceable by other objects, because all living organisms are composed of cells that contain at least 60% water and metabolic activity taking place in a solution of water (Kodoatie and Sjarief, 2010). Water supply in the settlements is a facility to support the development of its inhabitants. The water in the settlements
should be available with the standard quality,
sufficient quantity, continually available and
Ground water availability is crucial studied. Water is a basic need that is important and urgently needed on the Buhias Island. Therefore, it is deemed necessary to do research to detect the availability of
groundwater in order to fulfill the needs of
people on the Buhias Island, Sitaro Regency using geophysical methods based on the value of resistivity of material below the earth’s surface.
This research was conducted using geoelectrical method of Wenner-Schlumberger
configuration to see the value of the
subsurface resistivity layer horizontally and vertically, in which the measurement using four electrodes, each 2 electrode of current and 2 potential electrode. On the geoelectrical method, an electric current is injected into the earth through the two electrodes. Then, the different potential that occurs is measured via two electrodes potential (Asmaranto, 2012). Illustration of potential differences caused
by flow injection is indicated at two points
opposing in the Earth’s surface between MN
caused by flow injection at AB (Bahri, 2005 in
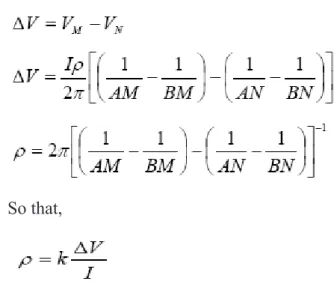
Priambodo, et al, 2011) as shown in Figure 1. The potential difference that occurs between
the MN caused by current injection at AB is:
So that,
With the I currents within amperes, ΔV with
different potential in volts, ρ resistivity in Ohm meter (Ωm) and electrode geometry factor k in
meters, then:
k is a factor of the geometry of the electrode
configuration of potential electrode and
current.
Figure 1.The current pattern and equipotential field between two electrodes with opposite polarity
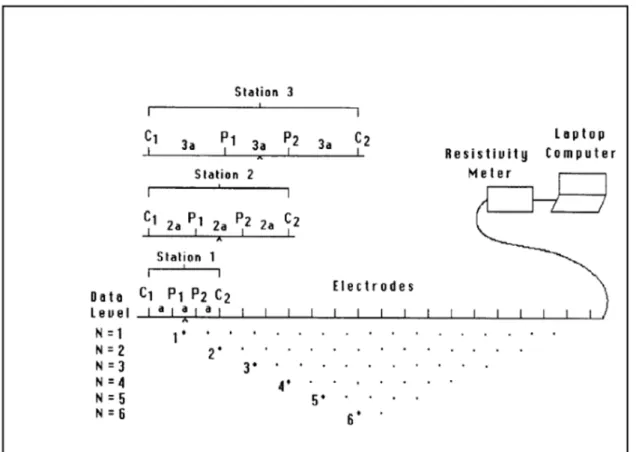
Wenner-Schlumberger configuration is a configuration with a constant spacing system with a record factor “n” for this configuration is
the ratio of the distance between the electrodes C1-P1 (or C2-P2) with a space between the
P1-P2 (Figure 2). If the distance between the electrode potential (P1 and P2) is a distance between the current electrode C1 and C2) is 2 na + a. (Sakka, 2001 in Priambodo, 2011).
Figure 2. Electrode settings of Wenner-Schlumberger Configuration
The results of apparent resistivity
measurements obtained in the field, converted
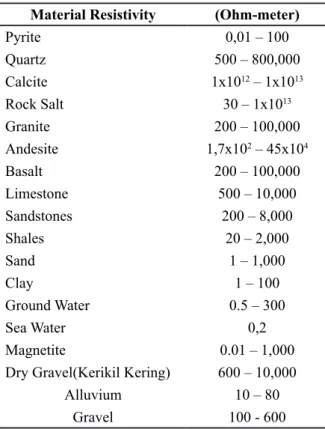
using RES2DINV program which then provides an overview of the distribution of subsurface soil resistivity. Furthermore, it is correlated with the value of earth resistivity material according to Telford and Sheriff (1982) those are shown in Table 1.
Table 1. Resistivity value of the materials of the earth
Material Resistivity (Ohm-meter)
Pyrite 0,01 – 100
Quartz 500 – 800,000
Calcite 1x10¹² – 1x10¹³
Ground Water 0.5 – 300
Sea Water 0,2
Magnetite 0.01 – 1,000
Dry Gravel(Kerikil Kering) 600 – 10,000
Alluvium 10 – 80
Gravel 100 - 600
The purpose of this study is to detect the
availability of ground water in order to fulfill
the needs of people in Buhias Island, Siau Timur Selatan District, Sitaro Regency by using geoelectrical of Wenner-Sclumberger
configuration.
Research Method
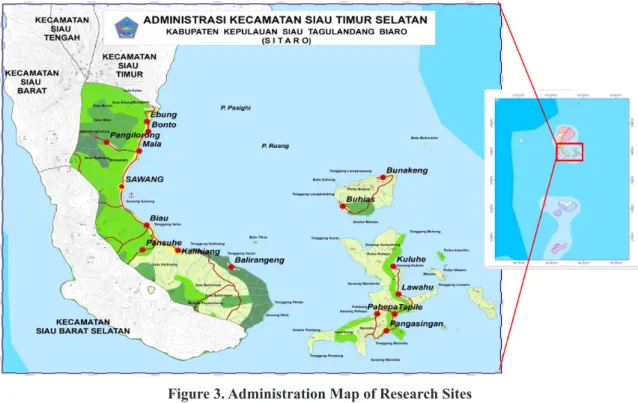
The research was conducted at the Buhias Island, Siau Timur Selatan District, Sitaro Regency (Figure 3). The research was conducted from August to October 2015.
The research method used survey method by geoelectrical instrument based on subsurface rock resistivity as a geophysical exploration results with geoelectric method of
Wenner-Schlumberger configuration. Geoeletrical resistivity method is done by injecting current into the earth surface and then measured the potential difference (Telford et al, 1990). The working of geoelectrical is shown in Figure 4.
In the geoelectrical resistivity method, electric current is injected into the earth through two current electrodes C1 and C2 is inserted into the ground at a certain distance. The longer the
distance C1C2 electrode will cause an electric
current can penetrate the deeper layers of rock.
With the flow of electric current will cause
occurs at soil surface was measured with the use of a multimeter connected via two voltage
electrodes P1 and P2 with shorter distance than the distance of the electrodes C1 and C2.
Figure 3. Administration Map of Research Sites
Figure 4. Geoeletrical Working
When the position of the electrode distance of
C1C2 is changed into larger, then the voltage
that occurs at the electrodes of P
1P2 also
Measurements in this study consists of 4 tracks, each track with a stretch of 480 meters or consist of 48 points with a spacing of 10 meters using Multichannel and multi-electrode resistivity and IP meters MAE X612 EM.
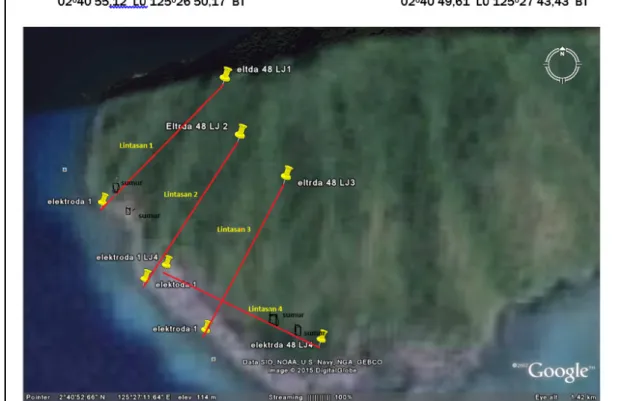
Map of study sites and initial design of survey stretch of geoelectrical map based terrain mapping using Google Earth, it can be seen in Figure 5, where the stretch on the design for the four trajectories of measurement.
Figure 5. Survey Design of Research Site
Taking of geoelectrical data is conducted by using a combination of techniques resistivity soundings and resistivity mapping to get a
2D profile. Sounding techniques aimed to
estimate the distribution of resistivity as a function of depth in a measurement point,
mapping technique aims to determine the resistivity variations laterally on a particular
area. Illustration of electrode configuration
Figure 6. Measurement technique of 2D profile
Data processing of 2D resistivity geoelectrical begins with calculating the geometry factor
(K) based on the configuration and the distance
between the electrodes used. Furthermore, it is conducted the calculation to obtain the value
of apparent resistivity (ρa) of strong current
data (I) and the potential difference (V). For
getting the 2D resistivity distribution profile, it
can be done by using the 2D inversion process with using RES2DINV software (Loke and Barker, 1996). The data used as input in the
process of this inversion is the distribution ρa
value, the distance between the electrodes, the amount of data, as well as the location of data points.
Results of Discusion
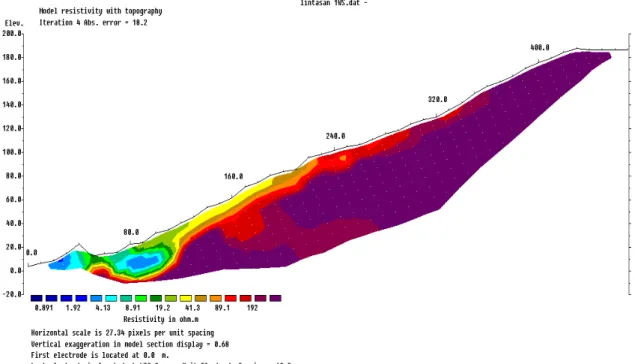
The measurement results of track geoelectrical 1 (Figure 7) showed the amount of resistivity
values as 0.891 to 192 Ωm with a layer thickness
of up to 210 meters. Resistivity value is as
0.891 to 4.13 Ωm is at depths of 0-10 m along
70 m, this layer is interpreted as the aquifer is indicated by a blue color image. Resistivity
values as 8,91-19,2,3 Ωm of elevation of 40
meters to a depth of 10 meters along 170 meters, this layer is interpreted as alluvium. Based on the geological map that area of this research is comes from tufa. Alluvium aquifer layer is a layer of the image indicated by the color green. Resistivity values is from
41.3 to 192 Ωm of elevation of 190 meters
Figure 7. 2D Image of resistivity trajectories 1
The results of the study on trajectory 1 (Figure 7) describes the groundwater which is indicated by a blue color image with a resistivity value
of 0.891 to 4.13 Ωm at depths of 0-10 m, but
the brackish water conditions, because this
resistivity value is close to the beach, then it
is supposed as junction between the flow of
runoff or percolation of rain water with sea water. In addition, the rocks arranged inside are a marine sedimentary that contain salt.
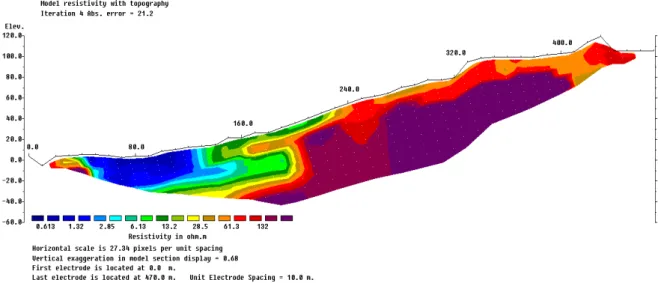
The measurement results of geoeletrical trajectory 2 (Figure 8) shows the magnitude
of the resistivity value as 1,33-287Ωm with a
depth of up to 160 meters. Resistivity values is
as 1.33 to 6.17 Ωm of elevation at a depth of 40
meters to 20 meters, 130 meters along this layer is interpreted as an aquifer which is indicated by a blue color image. Resistivity values is as
13.3 to 28.7 Ωm of elevation of 70 meters to
a depth of 20 m along 200 meters, this layer of alluvium interpreted as an association with sedimentary rock layers of marine indicated by the green color image. Resistivity values is
as 61,7-287Ωm of elevation of 130 meters to a
depth of 20 meters along 480 m, interpreted as marine sedimentary indicated by the yellow, red, brown image.
Results of research on the trajectory 2 illustrates the groundwater which is indicated by a blue
color image with 1,33-6,17Ωm resistivity
value of elevation at a depth of 40 meters to 20 meters, 130 meters long. It is suspected that the aquifer is saline due to the intrusion of sea water entering into and constituent rocks are rocks that come from marine sediments.
Figure 9. 2D Image of resistivity trajectories 3
The measurement results of trajectory geolelectrical 3 (Figure 9) shows the magnitude of resistivity values as 0.613 to 132
Ωm with a layer thickness of up to 140 meters. Resistivity values is as 0.613 to 2.85 Ωm of
elevation of 10 meters to 30 meters at a depth of 110 meters long, this layer is interpreted as ground water showed by the blue color image.
Resistivity values is as 6.13 to 13.2 Ωm of
elevation of 40 meters to a depth of 30 meters, 200 meters long, this layer is interpreted as alluvium, which is indicated by the green color
image. Resistivity values is as 28.5 to 132 Ωm
of elevation of 100 meters at a depth of 40
meters to 480 meters long, it is interpretated as rock of sea sediments with the yellow, red, brown image.
The results of the study on trajectory 3 illustrated the layers of ground water that is indicated by a blue color image with a
resistivity value of 0.613 to 2.85 Ωm of
elevation of 10 meters to a depth of 30 meters along 110 meters. It is suspected this aquifer contains the saline because this area is a
swamp which as a meeting between the flow
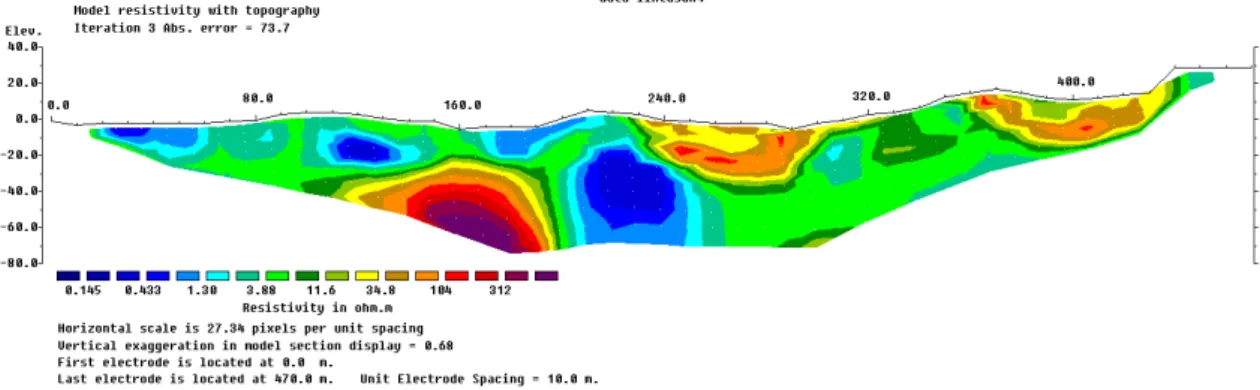
The measurement results of geoelectrical on trajectory 4 (Figure 10) shows the magnitude
of resistivity values as 0.145 to 1.30 Ωm with
a depth of up to 70 m. Resistivity values is as
0.145 to 1.30 Ωm at a depth of 0-70 meters
along 310 m, this layer is interpreted as saltwater mixes with groundwater showed by the blue image. Resistivity values is as 3.88 to
11.6 Ωm at a depth of 0-70 meters, along 480
m, this layer is interpreted as parent material layers and alluvium as indicated by the green color image. Resistivity value is as 34.8 to
312 Ωm at a depth of 0-70 m along 280 meters
is interpretated as marine rock sediment as shown with the yellow, red, brown images.
Figure 10. 2D Image of resistivity trajectories 4
The study results on trajectory 4 illustrated the presence of salt water mixed with ground water as a result of storm water runoff from the mountain down to the lower area, i.e. a swamp with the mangrove vegetation.
Description quantitative interpretation of the condition or aquifer layers and rock layers below ground level on four trajectories indicates that soil water availability analysis procedures for cases of ground water in the islands immediately adjacent to the shoreline can be approximated by measuring the apparent custody. Apparent resistivity data after inverted with mathematical equations is obtained the real resistivity value and obtained in the form of a cross-resistivity that illustrates the distribution value of subsurface soil at each sounding and is expressed in the form of a color image of 2 (two) dimensions that vary
with the depth or thickness of specific layers
in accordance with the resistivity value.
Study of Bighash and Murgulet (2015) showed that application of electrical resistivity to understand groundwater contributions to coastal can be done. Both analysis of geochemical data and subsurface imaging
techniques identified two commonalities
for the investigated system: 1) hyper-saline water occurs near the groundwater/surface water interface during wet conditions creating reverse hydraulic gradients due to density effects. The development and downward
movement of these fluids as continuous plumes deflect fresher groundwater discharge
downward and laterally away from the surface; and 2) more pronounced upwelling of fresher groundwater occurs during drought periods
when density inversions are more defined
and are expected to overcome dispersion and
diffusion processes and create sufficiently
large-enough unstable gradients that induce density-difference convection.
The facts showed that at the time of the study on the trajectory of the dry season, the state of groundwater is really containing saline (brackish), it is in accordance with the wells water conditions around the track 1 (the
9th point electrode). This resistivity value
position in the coastal area with a distance of 1 to 70 meters from the shoreline, this area may
be the meeting of run off flow or percolation
the coastal plain is generally obtained from charging (recharge) the loose material such as sand and gravel from the percolation of rainwater or river.
Research by Purnama and Sulaswono (2006), showed that the use of geoelectrical technique for detecting distribution of salty ground water in the aquifer freely in the city of Surabaya shows the interaction between fresh water with water that has a high salinity, is characterized by a resistivity value (0.5-3, 1
Ωm) with a range of 0-40 meters depth. The
ground water system in this region is called
the free ground water system (unconfined aquifer). At the resistivity of (8.91 to 19.2 Ωm) in the first trajectory can be interpreted that
this rock layers is an alluvium which showed with the image of a green color. Alluvium is young soils derived from volcanic sediment deposited from the air as a solid material, in
the form of fine sand until soft send and also
contained the clay. Based on geological data of research area is formed from tuff rocks from the volcano. Alluvial soils derived from volcanic is generally fertile because contains many minerals. The spreading is in river valleys and coastal plains. Based on the nature and characteristics of alluvium, then this layer can catch and pass the water called as aquifers. So it can be seen between these layers there is groundwater represented by the image of a blue color. However, this water conditions that salt-containing was seen
in all 12th electrodes are exist the wells that
the water situation to be saline (brackish).
At the resistivity (41.3 to 192 Ωm) is shown
with the image of yellow, red, brown. This can be interpreted as a sedimentary rock shale sea (limestone), rock salt and gravel. With the high resistivity value of this layer of rock is homogeneous with ground cover tufa so that they are hard, dense and compact rock
but has many cracks and fissures make rain
water that falls on the surface ground, beside runoff but also partly go into in the rock layers through fractures so in this layer there are low resistivity values as groundwater and can’t
be expected as a layer aquifer. The flow of
surface water is likely to enter into the green alluvium layers and becomes the groundwater.
But when the rainy season as the surface flow water or through the cracks will fulfill the
basin may have formed due to weathering and tectonic would disappear or dry out when the dry season. Water conditions on the track 1 is said to contain salt because of its proximity to the beach but also the rock layers essentially as a constituent of rocks derived from the rock which is the result of marine sediments which
allows the entry of sea water fills the aquifer.
In track two, the results of data inversion, can be interpreted in an aquifer. In this area is a
valley that allows the results of the flow of infiltration and runoff collected in the valley
and into ground water sources. In track two can also be interpreted in an alluvium association with marine sedimentary rocks: shale (limestone). Alluvial as a result of weathering of the rock layers of volcanic rock while shale are the main source of sediments derived from marine organisms are transported to the surface by natural forces. Based on the properties of both these rocks, alluvial texture is sandy clay that is able to withstand and pass water and limestone as a carbonate rock that is easily fragile which tend to break easily and allows the movement of water in through faults or fractures, but more importantly, once the water enters the fracture the water will dissolve the carbonate rocks, causing the opening of the stones become larger and allow more water movement. It can be said association rocks of alluvium and sediments are aquifer layer, so that it was seen in the layer below the aquifer. The study results of
Sultan et al. (2014) was identified aquifer on the Satando Island as -21.7 13.5 Ωm resistivity values are the alluvial layer with fine until
coarse sand-sized material in the form of sand silica and broken fragments of andesite and basalt which is a layer containing fresh water.
At the resistivity as many as (61,7 – 287Ωm)
from the freezing of the liquid magma and heat. The magma cools and hardens inside or on the surface of the earth. Deposition of marine sedimentary rocks: shale (limestone), rock salt, gravel, and sandstones. Deposition of sedimentary rocks is the result of an overhaul of igneous, metamorphic and other sedimentary rocks that brought by the river
flow, then deposited in other places, on land
and at sea. The deposition is collected in a place anywhere and experience the process of compaction, consolidation and cementation, which will eventually harden to form new sedimentary rocks. Most sedimentary rocks are formed from fragments of rock that arranged into layers and then harden and form a new rock. Some sediment have been formed from organic material or mineral that soluble in water as a result of the activities of living organisms, for example limestone which is the result of coral reef activities in the sea. With high resistivity values can be a homogenous rock layers with a layer of hard and compact but it contains a lot of cracks or fractures. Volcanic rock is a rock with high pore openings as a result of the development of gas bubbles that led to the entry of water solution into the rock layers through the cracks between the gas bubbles. The presence of considerable heat magma intrusion from volcanic rock can dissolve most of the grains of sand so the water can continue to enter through the pores of sedimentary rocks. On this rock layers are invisible any aquifer. However Kodoatie (2012) considers that in certain cases allow water to move entering through the cracks space. Water will move more quickly through the greater cracks coating, so it doesn’t look their ground water but with the fractures allows the seepage of seawater or up through the movement of the capillaries so that it could be assumed that the possibility of groundwater contained in track 2 will contain salt.
The results of the data inversion on the third track can be interpreted in an aquifer which is an association of alluvium sedimentary. Alluvium deposition is derived from volcanic ash. Corresponding to geological maps that
research area has been formed of tuff rocks from the volcano. Based on the nature or characteristics of sandy clay soil texture, this layer is called an aquifer layer that can catch and pass water. Some points of the interpretation of marine sediments consist of: shale (limestone), rock salt and gravel. Sedimentary deposition rocks are sedimentary rocks that occur due to the deposition of erosion material, which consists of various types of particles that exist smooth, rough, heavy and some are light. Based on the value of resistivity, then a layer of rock is the hard rock due to precipitation and
cementation, but has many cracks and fissures
due to weathering so that rain water entering
on this rock will mostly flow as surface runoff
and most probably enter through fracture rock and escapes into layers below the surface or in the base layer of rock, the ground water will not be found at this layer. Possibility of water contained in the track 3 contains mineral salts as rocks constituent derived from marine sediments that contain mineral salts.
In track four, can be interpreted in a salt water mixed with groundwater is the result of storm water runoff as surface runoff (run off) from the hill down to the lower area is the mangrove swamp. This can be seen on the electrode contained 31 on the wells where the water tasted salty. At some point the observation results can be interpreted inversion as a layer of wet sand clay association with alluvium because this area is a swamp area that when the time tide, the land will be inundated and otherwise low tide or the dry season the soil will dry hard and dense. While the resistivity
as (34.8 to 312 Ωm) interpreted as a layer
and sedimentary rocks others were eroded, then deposited and experience the process of compaction, consolidation and cementation. The position of these sediments is in the bottom layer. So it can be said that in the fourth trajectory contained a layer of salt water because the area is mostly swamp. In the area is in line with the research of Galazoulas et al (2015) that uses a resistivity zone showed the phenomenon of groundwater from coastal aquifers successfully illustrated by groundwater aquifer that is four major resistivity zones ranging in values between 0.1
and 150 Ωm at various depths and locations. A very low resistivity zone (0.1–5 Ωm)
correlated with saline water saturated layers, a
medium resistivity zone (5–15 Ωm) attributed
to clays and silts, and two high resistivity zones generally representing freshwater saturated
sediments of coarse grain size (15–40 Ωm) or
alterations of thin marl and fine sand layers (40–150 Ωm).
Conclusion
Based on the research that has been done on the trajectory 1 to 4 is the aquifer. Dominant groundwater in the study area contains salt or brackish water, so the ground water needs for the community are limited to bathing, washing and toilet facilities.
Based on these results, it can be recommended that to Local Government and supported by the community namely: It is important to make a pool to accommodate the storm water runoff disposed or made a place in large-scale for harvesting the rainwater for the people can be
fulfilled until the dry season and it is important
also to plant trees in the basin.
References
Asmaranto, R. 2012. Identifikasi Air Tanah (Groundwater) Menggunakan Metode Resistivity
(Geolistrik with IP2WIN Software). E-book learning, Hidrologi. Jurusan Teknik Pengairan FT-Universitas Brawijaya.
Bighash P and Murgulet D. 2015. Aplication of Factor Analysis and Electrical Resistivity to Understand Groundwater Contributions to Coastal Embayments in Semi-Arid and Hypersaline Coastal Settings. Science of The Total Environment Vol 532 Nov 2015 Page 688-701. http://www.sciencedirect.com/science/article/pii/S0048969715302734
Galazoulas E.C., Mertzanides Y.C., Petalas C.P., and Kargiotis E.K. 2015. Large Scale Electrical Resistivity Tomography Survey Correlated to Hydrogeological Data For Mapping Groundwater Salinization: a Case Study From a Multilayered Coastal Aquifer in Rhodope, Northeastern Greece. Environtmental Processes. Vol 2. Issue 1 PP 19-35. http://link.springer.com/article/10.1007/s40710-015-0061-y
Hakim L. D. 2010. Aksesbilitas Air Bersih Bagi Masyarakat Di Permukiman Linduk Kecamatan Pontang Kabupaten Serang. Tesis S2. Program Pascasarjana Magister Teknik Pembangunan wilayah dan Kota Universitas Diponegoro Semarang. Hal 1 – 15
Kodoatie R. J. 2012. Tata Ruang Air Tanah. Penerbit ANDI. Yogyakarta
Kodoatie R. J dan Sjarief . R. 2010. Tata Ruang Air. Penerbit ANDI Yogyakarta 2005. Pengelolaan Sumber Daya Air Terpadu. Penerbit ANDI Yogyakarta.
Loke, M.H., Barker, R.D. 1996. Rapid leastsquares inversion of apparent resistivity pseudosections using a quasi-Newton method. Geophysical Prospecting 44, 131-152.
Priambodo.I.C.,Purnomo.H., Rukmana.N., Juanda. 2011. Aplikasi Metoda Geolistrik
Konfigurasi Wenner-Schlumberger Pada Survey Gerakan Tanah Di Bajawwa, NTT.
Bulletin Vulkanologi dan Bencana Geologi, Volume 6 Nomor 2, Agustus 2011 : 1 -10
Sedana. D., As’ari., Tanauma. A., 2015. Pemetaan Akuifer Tanah Di Jalan Ringroad Kelurahan Malendeng Dengan Menggunakan Metode Geolistrik Tahanan Jenis. Laporan Penelitian FMIPA Unsrat, Manado
Sulu. S. S., As’ari., Tongkutu. S. H., 2015. Pemetaan Akuifer Air Tanah Di Wilayah Kampus Unsrat Manado Dengan Menggunakan Metode Geolistrik Tahanan Jenis. Jurnal Ilmiah sains Vol. 15 No.1. April 2015
Sultan., Imran. A.M., Thaha. A., Ramli M. 2013. Identifikasi Potensi Air Tanah Berdasarkan
Geolistrik Resistivity Di Pulau Satando Kabupaten Pangkep Provinsi Sulawesi Selatan. Jurusan Teknik Geologi Fakultas Teknik Universitas Hasanudin. Hasil Penelitian Fakultas Teknik PROSIDING 2013:1-8.