ORIGINAL ARTICLE
Application of Differential Scanning
Calorimetry-Chemometric Coupled Procedure
to the Evaluation of Thermo-Oxidation on Extra
Virgin Olive Oil
Rubén M. Maggio&Lorenzo Cerretani& Carlo Barnaba&Emma Chiavaro
Received: 5 August 2011 / Accepted: 1 January 2012 / Published online: 26 January 2012 #Springer Science+Business Media, LLC 2012
Abstract In this work, the opportunity of adopting a
differ-ential scanning calorimetry (DSC)-principal component analysis (PCA) coupled procedure to measure the degree of thermal stress for extra virgin olive oil (EVOO) was pre-sented. Oil was subjected to thermal stress under convec-tional or microwave heating treatments at different heating times up to 1,440 and 15 min, respectively, andp-anisidine
values (PAV) were obtained on all samples to measure their oxidative degradation. The entire DSC profiles obtained on the oil upon cooling in the range from 30 °C to–80 °C and
subsequent re-heating to 30 °C at different times and under cooking procedures have been subjected to PCA data anal-ysis. PCA discriminated samples by means of profile changes in DSC transition both upon cooling and heating not only according to treatment times (which accounted for the degree of thermo-oxidation) but also considering
different heating process. The proposed procedure may be useful to measure oil thermal stress and to select appropriate heating condition to be applied for EVOO both in industrial and/or in food-catering sectors.
Keywords Differential scanning calorimetry . Extra virgin olive oil . Thermo-oxidation . Chemometric procedure
Introduction
Extra virgin olive oil (EVOO) is a well known vegetable oil, which takes a consistent part of the Mediterranean diet for its health promoting effects related to the prevention of oxidative damage, as it was recently stated by the European Food Safety Authority (EFSA) panel on Dietetic Products, Nutrition and Allergies in relation to its polyphenol content.1Its balanced chemical composition characterized
by high content of monounsaturated (oleic acid in particular) fatty acids, a proportioned presence of polyunsaturated ones and such minor components as phenolic compounds, toco-pherols, and carotenoids, known to act as antioxidants against reactive species, can explain its relatively high stability against oxidative sequence involving lipid molecules due to storage and/or thermal treatments.2–4
Differential scanning calorimetry (DSC) is a thermoana-lytical technique widely employed for the evaluation of quality parameters of vegetable oil as thermal properties obtained by cooling and heating transitions were related to chemical composition.5Recently, correlations among ther-mal properties and both major and minor chemical compo-nents were also established for EVOO.6 Its use presents
several advantages as it does not require time-consuming
R. M. Maggio
Área Ánalisis de Medicamentos, Facultad de Ciencias Bioquímicas y Farmacéuticas, Universidad Nacional de Rosario and Instituto de Química Rosario (IQUIR, CONICET-UNR), Suipacha 531,
Rosario S2002LRK, Argentina
L. Cerretani (*)
Dipartimento di Economia e Ingegneria Agrarie, Università di Bologna,
p.zza Goidanich 60, 47521 Cesena, FC, Italy e-mail: [email protected]
C. Barnaba
:
E. Chiavaro (*)Dipartimento di Ingegneria Industriale, Università degli Studi di Parma, Parco Area delle Scienze 181/A, 43124 Parma, Italy
manipulation practices and chemical treatment of the sam-ple, avoiding the use of toxic chemicals that could be hazardous for the analyst and the environment, with well-automated analysis protocol that papers recently published have estimated to be very helpful also for the evaluation of EVOO adulteration.7,8
Among DSC applications in the field, its use for assess-ing oxidative deterioration of vegetable oils is well known and reviewed.9,10Several aspects were taken into
consider-ation: the evaluation of oil stability by extrapolating induc-tion time from isothermal curve, which were found to be related to those measured by common tests as OSI11 or
Rancimat,12 the monitoring of the immediate quality and the expected oxidation stage after such thermal treatments as deep-frying13,14 or microwave heating15,16, as changes in
DSC thermal properties were found to be strictly correlated to those of standard oxidative stability indices (peroxide and anisidine values, free fatty acids, etc.).
Changes in DSC curves and related thermal properties were also discussed for olive oils after conventional17and
microwave18,19thermal oxidation carried out under different
conditions (i.e. temperature, time, microwave power). In all these previous works, DSC thermograms obtained as a result of oil composition and their pro-cessing were treated by evaluating cooling and heating transition profiles and by extracting such thermal prop-erties as enthalpy, onset, offset and peak temperatures of transitions from the curves. The chemometric processing of digitized calorimetric curves is also possible, being an alternative and attractive approach to such treatment of DSC data. Nevertheless, few examples are reported in literature, especially in the area of food research.20–22
In a previous work, a novel strategy based on coupling DSC to partial least square (PLS) chemometric method-ology for the determination of fatty acid composition of olive oil was developed, presenting a suitable model for the determination of oleic acid content overall, which is related to oil health benefits.23
Multivariate methods such as principal component anal-ysis (PCA) is useful to visualize representative features in multidimensional data, by reducing noise and data di-mension. Given data matrix X(p×t), the PCA algorithm
performs a linear transformation of the set of random vectors xi (i01…p) into a new set of vectors (wi, where i01…p), the principal components (PC’s). These PC’s
are uncorrelated and are ordered according to their ability to explain variation of the data, so that the first few retain most of the variation present in the original variables. The first PC is oriented in the direction on which the variance of the projection of the original vector is maximized, while each of the subsequent PC’s is defined in the same way, being orthogonal to
all the previous PC’s. The loadings matrix contains a
column-wise arrangement of the weights (contribution) of the original variables on PCs. The score matrix is the product which contains information regarding data variation.24
In this work, the entire DSC profile obtained upon cool-ing in the range from 30 °C to −80 °C and subsequent
re-heating up to 30 °C on an EVOO sample has been subjected to multivariate data analysis with the aim to analyse the main calorimetric changes that occur during different ther-mal treatments (convection oven, OV, and microwave, MW) and to explore the opportunity of adopting a DSC-PCA coupled procedure as an accurate measurement of thermal stress degree. Compositional data on raw sample and p -anisidine values (PAV) values of heated oils were also provided.
Material and Methods
Samples
EVOO sample was supplied by Coppini Arte Olearia (Parma, Italy). The olives used for oil production were hand-picked in 2009 and belonged to two cultivars (Nocellara del Beliceand Ogliarola Messinese) from Trapani (Sicily, Italy); olives were
processed by a continuous industrial plant with a working capacity of 1 ton h−1 equipped with a hammer crusher, a
horizontal malaxator (at a temperature of 27 °C), and a three-phase decanter. The sample was stored in a dark bottle without headspace at room temperature (23±1 °C) before analysis.
Thermal Treatment
Thermo-oxidation conditions were chosen on the basis of earlier works taking into account related changes in DSC profiles previously observed.17–19For conventional heating,
an electric oven (OV) with air convection was used (FVQ105XE, Electrolux Rex, Pordenone, Italy). Three ali-quots (90 ml) of oil were placed in opened 150 ml flasks (7.3 cm i.d.) and exposed at a temperature of 180 °C for 0, 30, 90, 120, 180, 360, 900 and 1,440 min.
For microwave heating (MW), a domestic oven was used (Perfect Combo MW 651, DeLonghi, Treviso, Italy). Three aliquots of oil were prepared as in conventional heating, placed on the rotatory turntable plate of the oven at equal distance and exposed at a frequency of 2,450 Hz at medium power (720 W). The oil samples were heated for 0, 3, 4.5, 6, 9, 12 and 15 min.
Chemical Analysis
Triacylglycerols (TAG) were analysed by HPLC coupled to both diode-array (DAD) and mass spectrometer (MSD) detec-tors, as previously described.18TAG were tentatively
identi-fied based on their UV–vis and mass spectra obtained by
HPLC-DAD/MSD and literature data.25 The results were
expressed as normalized area in percentage (%). TAG are grouped according to the type of FA bonded to the glycerol structure as monosaturated triacylglycerols (MSTAG), disatu-rated triacylglycerols (DSTAG) and triunsatudisatu-rated triacylgly-cerols (TUTAG). The following TAG were identified: trilinolein (LLL), dilinoleoyl-palmitoleoyl-glycerol (LLPo), oleoyl-linoleoyl-linolenoyl-glycerol (OLLn), dilinoleoyl-oleoyl-glycerol (OLL), palmitoleoyl-oleoyl-linoleoyl-glycer-ol (OLPo), dilinpalmitoleoyl-oleoyl-linoleoyl-glycer-oleoyl-palmitoyl-glycerpalmitoleoyl-oleoyl-linoleoyl-glycer-ol (LLP), dipalmitoleoyl-oleoyl-linoleoyl-glycer-oleoyl- dioleoyl-linolenoyl-glycerol (OLnO), dioleoyl-linoleoyl-glycerol (OLO), palmitoyl-oleoyl-linoleoyl-glycerol (OLP), dioleoyl-palmitoleoyl-glycerol (OOPo), palmitoyl-palmitoleoyl-oleoyl-glycerol (POPo), triolein (OOO), stearoyl-oleoyl-linoleoyl-glycerol (SLO), dipalmitoyl-oleoyl-glycerol (POP), dioleoyl-stearoyl-glycerol (SOO) and palmitoyl-stearoyl-oleoyl-glycerol (SOP).
Fatty acid (FA) composition was determined according to Bendini et al.26, as methyl esters by capillary gas chroma-tography (GC), equipped with a flame ionization detector (FID), after alkaline treatment. The results were expressed as normalized area in percentage (%). Fatty acids were also reported according to their unsaturation degree, as saturated (SFA), monounsaturated (MUFA) and polyunsaturated (PUFA) fatty acids.
Evaluation of free acidity (expressed as% oleic acid) and primary oxidation products (POV, expressed as meq O2/kg
lipids) were performed according to the official methods described in annex III of EEC Regulation 2568/91.27PAV
determination was performed according to the IUPAC stan-dard method 2.504, by measuring absorbance at 350 nm, on fresh and thermo-oxidized samples.28 Three replicates for
each determination were analyzed per sample.
DSC Analysis
Samples of oil (8–10 mg) were weighed in aluminium pans,
covers were sealed into place. Then, they were analyzed using DSC Q100 (TA Instruments, New Castle, DE, USA). Indium (melting temperature 156.6 °C, ΔHf028.45 Jg−1)
and n-dodecane (melting temperature −9.65 °C, ΔHf0
216.73 Jg−1) were used to calibrate the instrument and an
empty pan was used as reference. Oil samples were equili-brated at 30 °C for 3 min and then cooled at−80 °C at the
were analyzed with Universal Analysis Software (Version 3.9A, TA Instruments) in order to be exported in an ASCII compatible format. Three replicates were analysed per sample.
Data Processing and PCA Models
Thermograms, in ASCII compatible format, were imported to Matlab (Mathworks Inc., Natick, MA, USA.) using rou-tines writtenad hoc. PCA was carried out employing
Tom-cat Toobox29 routine written for Matlab. PCA model was
computed on overall data. The data were pre-treated in order to be transformed into a suitable form for PCA. First, the signal correction was done considering the whole unfolded thermogram. Then, the data were mean-centred (MC) (Figure3a), providing that all the samples appear to have the same mean signal level as the ideal. The replicates were averaged and the mean was taken as individual sample. All programs were run on an ACER-Aspire 5050 computer with an AMD Turion™ 64 Mobile, 2.20 GHz microprocessor
and 2.00 Gb of RAM.
Results and Discussion
Chemical and DSC Analysis
Chemical composition and quality parameters of EVOO are reported in Table 1. Eight TAG were separately quantified while the others were quantified as pairs (LLL + LLPo, OLL + OLPo, LLP + OLnO and OLP + OOPo). TUTAG were higher than the other groups of TAG as OOO represents the main TAG in EVOO. FA percentages fell within the range recently indicated by the Commission Regulation (EC, 2011) with an oleic/linoleic acid (O/L) ratio higher than 7 (~10.7), which is considered as the limit value to be overcame for oil oxidative stability. Free acidity of the oil was 0.4%, being below the limit (≤0.8%) set for this commercial
category by the EC Regulation.30
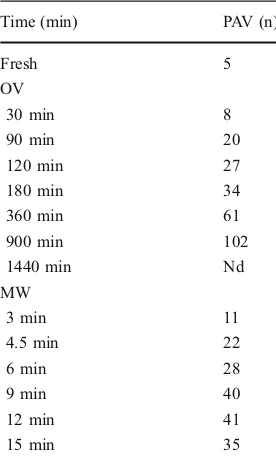
Initial oxidative status of unheated oil was measured both by POV and PAV with the former value lower than that (≤20) indicated by the European Commission Regulation30
for this high quality oil, which is consumed crude, and the latter similar to that generally found in fresh oil.3
MW samples exhibited a trend of values comparable to those previously reported for EVOO samples heated under similar conditions19,31, with a slight decrease after 15 min
of microwave heating, but this trend was quite different from that of OV heated oil. Previous experiments, carried out under similar conditions, have shown that EVOO tem-perature reached 120 °C after 90 min of OV heating with a further increase to 140 °C for longer time of treatment (by unpublished data of the authors). On the other hand, temper-atures of EVOO were markedly higher at the end of MW heating; from about 180 °C (at 3 min) to reach 313 °C at the longest time of heating (15 min).31 Thus, it could be
hy-pothesized that OV and MW samples probably underwent quite different kinetics of thermo-oxidation, leading to a higher lipid degradation degree for the latter heated oils in comparison with the former samples. TAG products from higher stages of lipid oxidation (e.g. polymers) were previ-ously found in olive oil subjected to comparable times of MW heating.32
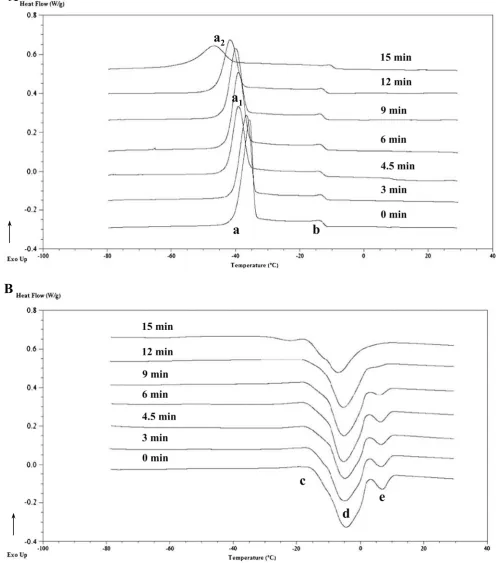
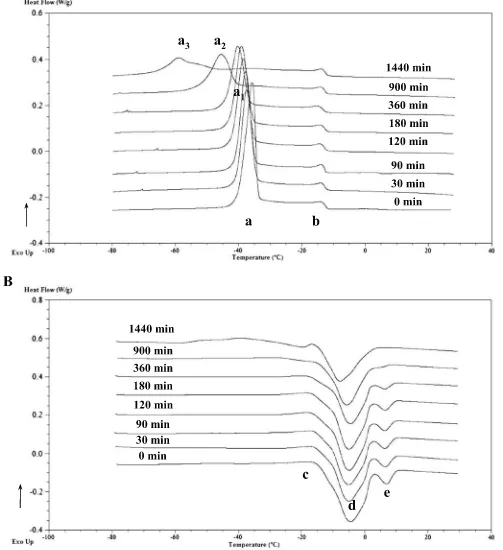
DSC thermograms, obtained for untreated and thermally stressed EVOO sample, are reported in Figure 1 for MW samples (inserts a and b, for cooling and heating, respectively) and in Figure2for OV oils (inset A and B, for cooling and heating, respectively).
Generally, cooling curves are more interpretable than those obtained upon heating, as crystallization of oils is well known to be influenced by chemical composition, whereas the well-known melting-re-crystallisation phenomenon, named poly-morphism, could easily occur during the melting of the orig-inal oil crystals.5EVOO showed the classical cooling profile
with two exothermic events, the major (peak a of Figures1a
and 2a) peaking at lower temperature (Tp~−38 °C), which
accounted for the crystallization of the majority of the most unsaturated lipid fractions and the minor (peak b of Figures1a
and2a, Tp~−16 °C) at higher temperature, previously related
to more saturated TAG, whose profile was also found to be influenced by minor components (diacylglycerols in particular).6
DSC profile of EVOO upon heating was more complex than upon cooling as this oil exhibited multiple transitions; a minor exothermic peak (peak c of Figures1band2b, Tpat
~−15 °C) and, successively, two endothermic events (peaks
d and e of Figures1band2b, at ~−5 and 5 °C, respectively),
whose profiles appeared to show some differences in rela-tion to fatty acid composirela-tion, especially for the peak at the highest temperature (e).23 The first event (c) at the lowest
temperature regions of the thermogram may be attributed to an exothermic molecular rearrangement of crystals into more stable polymorphic forms, already observed in other vegetable oils,5 whereas the two endothermic peaks at higher temperature (d and e), characterized by multiple overlapping contributions, could be ascribed to the melting of crystallized lipids.33
Thermal treatment induced changes in DSC profiles both upon cooling and heating. Upon cooling, the most evident change was a shift towards lower temperature and a
decrease of height of the major exothermic peak (a) both for OV and MW samples up to 360 and 12 min of treatment
(peak a1of Figures1aand2a), respectively, and in relation
to PAV increase (Table 2). The profile of this peak was
Fig. 1 Evolution of DSC cooling (a) and heating (b) thermograms for EVOO at different MW heating times. Main transitions are indicated with lowercase letters. Cooling thermograms: (a) major exothermic peak at time 0; (a1) shifted peak a from 4.5 to 12 min of MW treatment;
dramatically altered by both heating treatments, as this peak broadened with a consistent height decrease and a further
shift towards lower temperatures up to−60 and−50 °C for
OV (peak a3of Figure2a) and MW (peak a2of Figure1a),
Fig. 2 Evolution of DSC cooling (a) and heating (b) thermograms for EVOO at different OV heating times. Main transitions are indicated with lowercase letters. Cooling thermograms: (a) major exothermic peak at time 0; (a1) shifted peak a from 30 to 360 min of OV treatment; (a2)
respectively, significantly enlarging the range of transition. All these changes were previously observed upon DSC cooling for thermally-oxidized EVOO samples.17–19 They
could be attributable to the formation of lipid polar com-pounds, which were found not to crystallize in the DSC cooling range of analysis.14These molecules were reported to induce a shift of crystallization transition towards lower temperatures as well as to hinder the alignment of TAG molecules and to weaken their ability to come in contact by means of intermolecular bonding, causing a depletion of crystallizing lipid.17–19,34
The minor peak (b) was less altered by thermo-oxidation. Its profile remained unchanged for OV heated samples where-as it became less evident after 15 min of MW treatment, with the maximum skewed towards higher temperatures and a shift of onset temperature of crystallization from−11 to−8 °C in
microwaved sample, at least. This shift may be attributable to other thermal degradation phenomena rather than oxidation, as the formation of hydrolysis molecules from TAG (e.g. diacylglycerols), which were previously found to influence onset temperature of crystallization35were reported for MW
heated EVOO.36
Heating profiles were also altered and became more com-plex than the originals, as a consequence of thermo-oxidation (Figures1band2b). To the authors’best knowledge, heating
thermograms of conventionally thermo-oxidized EVOO were not reported in literature, yet.
Both thermal treatments caused a shift in the major endothermic peak (d) towards lower temperature after 90 min for OV and 4.5 min for MW, respectively, when PAV became about 4 times higher than the initial value (Table 2). In addition, peak height (d) decreased and dramatically changed its profiles after 900 and 15 min of treatment, respectively, with the appearance of shoul-der peaks embedded. The minor endothermic peak (e) became less evident after 360 (OV) and 9 (MW) min of heating and disappeared at 900 (OV) and 15 (MW) min. Other endothermic/exothermic transitions appeared at the lowest temperature region of thermograms (from −60 °C
to −20 °C), at the longest times of both treatments and
apart from the original transition one (c).
The changes in heating profiles could be attributable to the formation of different and less stable polymorphic crystals than pure oil, probably related to the formation of mixed crystals with lipid oxidation products during crystallization.37
These crystals became to melt at lower temperature being more easily disrupted by heat.37 Lipid oxidation molecules may have also made the transition/rearrangement of TAG polymorphic crystals more difficult, dramatically changing phase transition profile (peak c) at the lowest temperature region of the thermogram for samples at the longest time of treatments, as previously observed for EVOO samples heated under MW.18,19
Application of PCA Models
PCA is one of the most used tools for data compression38 and in this study, it was used in order to find the main DSC regions affected by thermo-oxidation that could be useful to tentatively discriminate samples according to different treat-ments and/or heating times. The analysis was performed on the whole digitised calorimetric curves avoiding complex procedure of extrapolation of thermal properties by thermograms.
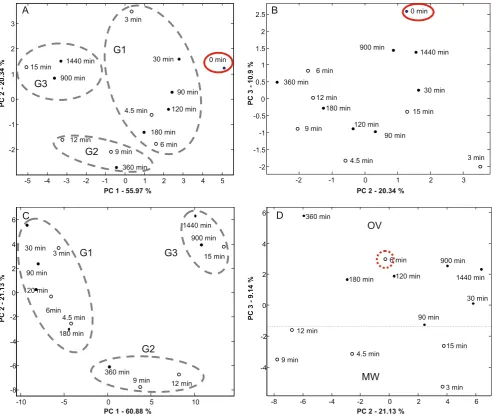
In the first step, PCA was performed using the entire set of samples obtained in the experiment (0 min, OV samples and MW samples). PCA revealed that three principal com-ponents (PC1 to PC3) explained almost 87.21% of the total variance between the data. The scatter plots defined by the PC1 vs. PC2 and PC2 vs. PC3 components were reported in Figures3a and b, respectively. It was observed that PC1 and PC2 were correlated to time exposure to heat (Figure 3a) discriminating among three groups of samples (named G1, G2 and G3), which were distinguished in relation to differ-ent times of treatmdiffer-ent. G1 approximately accounted for short (from 30 to 180 min for OV and from 3 to 6 min for MW), G2 for medium (360 min for OV and from 9 to 12 min for MW) and G3 for long (G3, from 900 to 1440 for OV and 15 min for MW) heating times. These groups were also in relation to different thermo-oxidation degree, G1 exhibited PAV values lower than 35, G2 in the range 40–
60, whereas G3 contained OV samples with PAV values higher than 100 and the MW heated oils that may have reached higher lipid oxidation stages than second group, but not measured by this oxidative stability index. In addi-tion, control sample (0 min) appeared to be well resolved from the three groups above mentioned. On the other hand, OV and MW samples appeared to be not well separated by means of this PCA analysis, as shown in Figure3b.
In order to be able to differentiate between these two heating treatments, the raw sample (0 min) was eliminated from the model, therefore reducing the variables involved and proceeding with a new PCA where only OV and MW oils were considered. In this case, the first three PC func-tions accumulated 91.15% of the variance explained, show-ing a better fittshow-ing of DSC data than the previous model. The scatter plots obtained with this PCA were reported in Figure 3c (PC1 vs. PC2) and 3D (PC2 vs. PC3). Figure3c, showed that the 1st and 2nd PC scores were able to distinguish among the different heating time, too, pre-serving the separation into three groups according to heating time and oxidation stage. In addition, Figure3dshowed that the 3rd PC was able to separate among the different heating source. All OV samples presented score values higher than
−1.5, whereas almost all MW samples had score values
suggests that the 3rd component models could be strictly related to the type of heating process.
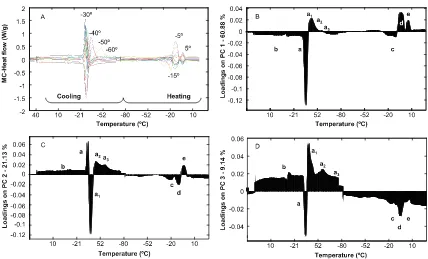
The loadings of these PC1, PC2 and PC3 were analysed in order to find the main regions of DSC thermograms involved in the group and/or treatment separations. A plot showing unfolded mean centred (MC) DSC signals of EVOO was shown in Figure 4a while the corresponding loading plots for PC1, PC2 and PC3 were shown in Figure4b, c and d, respectively. The influence of the orig-inal variables (DSC heat flow) on PC score values could be better understood by means of these PC loadings plots. Positive loading values found in a defined DSC regions implied that a rise in this region has positive influence on score values. In the same way, a negative high loading value in a DSC region implied that a more positive value than the
mean in this region have a negative impact on score values for this PC.
Figure 4b shows the loading of PC1. First loading appeared to be influenced by the signal diminution (negative loading values) of the major peak of lipid crystallization (transition a of Figures 1a and 2a, peaking at about
−30 °C) and the increase in the signal at about −40 °C
(transition a1of Figures1aand2a, positive values), which
led to positive scores on PC1. This was related with the decrease of height and the shift towards lower temperature of the major exothermic peak (peak a1of Figures1aand2a),
which accounted for the crystallization of the more unsatu-rated lipid fractions in the classical DSC cooling profile for EVOO.6Thus, G2 and G3 groups presented positive scores
on PC1. On the other hand, 1st loading showed positive
Fig. 3 First PCA plot showing MW(○) and OV (•) samples and heating
time separation (grey dashed lines), control sample (0 min) is underlined with asolid line red circle;a1st and 2nd scores;b2nd and 3rd scores.
Second PCA plot showing MW(○) and OV (•) samples and heating time
values for peaks located at−5 and 5 °C, the two
endother-mic events (transitions d and e of Figures1band2b) related to the melting of crystallized lipids33 for the heating
ther-mogram, which accounted for a decrease of signals of these two peaks also leading to positive scores on PC1 (Figure4b), as a consequence.
Discrimination according to PC2 appeared to be more com-plex as samples belonging to G1 presented both positive (OV oils at 30 and 90 min of heating and MW sample at 3 min) and negative (OVat 180 min and MWat 4.5 and 6 min) scores, thus making a further separation within this group possible. Other-wise, among more thermo-oxidized samples, G2 presented high negative and G3 high positive scores, respectively. The shift in transition a (Figures1aand2a) to a1(Figures1aand2a)
accounted for a high negative loading on PC2 (Figure4c) leading to negative scores on this component not only for G2 samples but also for those oils of G1 that exhibited PAV values higher than 20 (Table 2). Positive loadings were found for peaks a2and a3(Figures1aand2a). These peaks were
associ-ated with a more marked shift in the major lipid crystallization transition (peak a of Figures1aand2a) and related to an higher level of lipid oxidation as for samples of G3 group, which presented high positive scores on PC2 (Figure4c). Positive loading for peak a (Figures1aand2a) and negative loading for peak d (Figures1band2b) led to positive scores on PC2 for samples from G1 group (oils with the lowest PAV values). Meanwhile, this component exhibited correlations with an increase in the intensity of the exothermic peak c (Figures1b
and 2b) at −15 °C of the heating thermograms (negative
loading and positive scores on PC2) that were exhibited by samples of G3 groups, and a decrease in the intensity of peak at
−5 °C (transition e of Figures1band2b) for the heating curve
(positive loading on PC2 and positive scores).
On the 3rd PC component (PC3), which is correlated with the discrimination according to the heating treatments (Figure3d), there was a great contribution of baseline curve both for heating and cooling profiles. The highest discrim-ination between the two heating treatments was placed in the overall enhancement of the DCS baseline signal for OV samples that also presented the highest score values on this PC (Figure 3d). This enhancement was related to the changes in whole cooling and heating transition profiles (Figures 2a and 2b) that were markedly altered especially at the highest treatment times. Likewise, high positive load-ing values for peaks a1, a2 and a3 (shift in peak a of
Figures 1a and 2a) were also evident, being this loading contributions more evident for OV heating where the shift in the peak a was more pronounced.
Conclusions
In conclusion, these preliminary findings give rise to the adoption of a novel strategy for the treatment of DSC data as digitised calorimetric curves could be chemometrically ana-lysed and explored for the evaluation of thermal stress on EVOO.
Thermo-oxidized oil samples were differentiated by PCA according to changes in main DSC signals both by cooling and heating profiles. In particular, the shift in the major exothermic transition in cooling thermograms towards lower temperature and the decrease of height of the major endo-thermic transition of heating thermograms appeared to be most helpful to discriminate samples according to three different groups of treatment time (short, medium and long) by means of PC1 and PC2. These three groups also accounted for a different degree of thermo-oxidation in relation to PAV values. A discrimination was also possible taking into account different heating processes by means of PC2 and PC3.
In conclusion, the adopted procedure may be usefully employed to select appropriate heating conditions to be applied in relation to both the degree of thermo-oxidation and the EVOO composition. Further studies will be carried out in order to evaluate discriminant capability of the pro-posed strategy not only on EVOO but also on other vegeta-ble oils with different chemical composition on the basis of the oxidative status reached by oils under the common thermal conditions used in industrial processing and food catering sectors considering several chemical stability indices.
References
1. European Food Safety Authority, EFSA (2011),http://www.efsa. europa.eu/cs/Satellite. Accessed 29th December 2011
2. M.T. Bilancia, F. Caponio, E. Sikorska, A. Pasqualone, C. Summo, Food Res. Int.40, 855–886 (2007)
3. A. Carrasco-Pancorbo, L. Cerretani, A. Bendini, A. Segura-Carretero, G. Lercker, A. Fernández-Gutiérrez, J. Agric. Food Chem.55, 4771–4780 (2007)
4. E. Bĕster, B. Butinar, M. Bŭcar-Miklavčič, T. Golob, Food Chem. 108, 446–454 (2008)
5. C.P. Tan, Y.B. Che Man, J. Am. Oil Chem. Soc. 77, 142–155 (2000)
6. E. Chiavaro, M.T. Rodriguez-Estrada, A. Bendini, L. Cerretani, Eur. J. Lipid Sci. Tech.112, 580–592 (2010)
7. E. Chiavaro, E. Vittadini, M.T. Rodriguez-Estrada, L. Cerretani, A. Bendini, Food Chem.110, 248–256 (2008)
8. J.S. Torrecilla, J. García, S. García, F. Rodríguez, J. Food Eng. 103, 211–218 (2011)
9. B. Kowalski, Thermochim. Acta184, 49–57 (1991)
10. C.P. Tan, Y.B. Che Man, Trends Food Sci. Tech. 13, 312–318 (2002)
11. C.P. Tan, Y.B. Che Man, J. Selamat, M.S.A. Yusoff, Food Chem. 76, 385–389 (2002)
12. B. Kowalski, K. Ratusz, D. Kowalska, W. Bekas, Eur. J. Lipid Sci. Tech.106, 165–169 (2004)
13. H. Gloria, J.M. Aguilera, J. Agric. Food Chem.46, 1363–1368 (1998)
14. C.P. Tan, Y.B. Che Man, J. Am. Oil Chem. Soc.76, 1047–1057 (1999)
15. C.P. Tan, Y.B. Che Man, S. Jinap, M.S.A. Yusoff, J. Am. Oil Chem. Soc.78, 1227–1232 (2001)
16. E. Chiavaro, M.T. Rodriguez-Estrada, E. Vittadini, N. Pellegrini, LWT-Food Sci. Technol.43, 1104–1112 (2010)
17. E. Vittadini, J.H. Lee, N.G. Frega, D.B. Min, Y. Vodovotz, J. Am. Oil Chem. Soc.80, 533–537 (2003)
18. E. Chiavaro, C. Barnaba, E. Vittadini, M.T. Rodriguez-Estrada, L. Cerretani, A. Bendini, Food Chem.115, 1393–1400 (2009) 19. E. Chiavaro, M.T. Rodriguez-Estrada, A. Bendini, M. Rinaldi, L.
Cerretani, J. Sci. Food Agric.91, 198–206 (2011)
20. J.N. Jensen, B.M. Jørgensen, LWT-Food Sci. Technol.36, 807– 812 (2003)
21. A.L. Pomerantsev, O.Y. Rodionova, Chemometr. Intell. Lab.79, 73–83 (2005)
22. H.C. Bertram, Z. Wu, F. van den Berg, H.J. Andersen, Meat Sci. 74, 684–689 (2006)
23. L. Cerretani, R.M. Maggio, C. Barnaba, T. Gallina Toschi, E. Chiavaro, Food Chem.127, 1899–1904 (2011)
24. R.M. Maggio, P.M. Castellano, T.S. Kaufman, Int. J. Pharm.378, 187–193 (2009)
25. K. Nagy, D. Bongiorno, G. Avellone, P. Agozzino, L. Ceraulo, K. Vékey, J. Chromatogr. A1078, 90–97 (2005)
26. A. Bendini, L. Cerretani, S. Vecchi, A. Carrasco-Pancorbo, G. Lercker, J. Agric. Food Chem.54, 4880–4887 (2006)
27. European Community, Commission regulation No. 2568/91. Off. J. Eur. CommunitiesL248, 1–83 (1991)
28. International Union of Pure and Applied Chemistry (IUPAC), Standard methods for the analysis of oils and fats and derivatives, 7th edn. (Blackwell Scientific, Oxford, 1987), p. 210
29. M. Daszykowski, S. Semeels, K. Kaczmarck, P. Van Espen, C. Croux, B. Walczak, Chemometr. Intell. Lab. 85, 269–277 (2007)
30. European Community, Commission regulation No. 61/2001. Off. J. Eur. CommunitiesL23, 1–14 (2011)
31. L. Cerretani, A. Bendini, M.T. Rodriguez-Estrada, E. Vittadini, E. Chiavaro, Food Chem.115, 1381–1388 (2009)
32. F. Caponio, A. Pasqualone, T. Gomes, Eur. Food Res. Technol. 215, 114–117 (2002)
33. E. Chiavaro, E. Vittadini, M.T. Rodriguez-Estrada, L. Cerretani, A. Bendini, J. Agric. Food Chem.56, 496–501 (2008)
34. S. Calligaris, G. Arrighetti, L. Barba, M.C. Nicoli, J. Am. Oil Chem. Soc.85, 591–598 (2008)
35. E. Chiavaro, E. Vittadini, M.T. Rodriguez-Estrada, L. Cerretani, M. Bonoli, A. Bendini, G. Lercker, J. Agric. Food Chem. 55, 10779–10786 (2007)
36. L. Cossignani, M.S. Simonetti, A. Neri, P. Damiani, J. Am. Oil Chem. Soc.75, 931–937 (1998)
37. Y.B. Che Man, P.Z. Swe, J. Am. Oil Chem. Soc.72, 1529–1532 (1995)