i ADAMA BAH, FRANSISKA E. MARDIANANINGSIH AND LAURA WIJAYA
TNP2K WORKING PAPER 06 – 2014
iii The TNP2K Working Paper Series disseminates the findings of work in progress to encourage discussion and exchange of ideas on poverty, social protection and development issues.
Support for this publication has been provided by the Australian Government through the Poverty Reduction Support Facility (PRSF).
The findings, interpretations and conclusions herein are those of the author(s) and do not necessarily reflect the views of the Government of Indonesia or the Government of Australia.
You are free to copy, distribute and transmit this work, for non-commercial purposes.
Attribution: Bah, Adama, Fransiska E. Mardiananingsih, and Laura Wijaya (2014). "An Evaluation of the Use of the Unified Database for Social Protection Programmes by Local Governments in Indonesia", TNP2K Working Paper 6-2014. Tim Nasional Percepatan Penanggulangan Kemiskinan (TNP2K), Jakarta, Indonesia.
To request copies of the paper or for more information on the series; please contact the TNP2K - Knowledge Management Unit ([email protected]). Papers are also available on TNP2K’s website.
TNP2K
Grand Kebon Sirih Lt.4, Jl.Kebon Sirih Raya No.35, Jakarta Pusat, 10110 Tel: +62 (0) 21 3912812 Fax: +62 (0) 21 3912513 www.tnp2k.go.id
Layout and typesetting: Purwa Rahmanto
ADAMA BAH, FRANSISKA E. MARDIANANINGSIH AND LAURA WIJAYA
TNP2K WORKING PAPER 06 – 2014
iv
An Evaluation of the Use of the Unified Database for Social
Protection Programmes by Local Governments in Indonesia
Adama Bah, Fransiska E. Mardiananingsih and Laura Wijaya
1March 2014
ABSTRACT
The Unified Database for Social Protection Programmes (UDB) contains detailed
socio-economic and demographic information, as well as the names and addresses of the poorest 40
percent of the Indonesian population. Since 2012, the National Team for the Acceleration of
Poverty Reduction (TNP2K), which manages the UDB, has provided this data to over 500 local
government institutions to facilitate the implementation of local poverty reduction
programmes. This paper evaluates the use of the UDB data based on the results of a qualitative
assessment of data utilisation at the local level and a self-administered user feedback survey.
To improve the cooperation with local governments for increased effectiveness of poverty
reduction programmes, our main recommendations are for TNP2K to engage more proactively
with the institutions that request data, through (i) regular follow-ups with these institutions, (ii)
a broad dissemination of socialisation material explaining the UDB, and (iii) the provision of
specialised training on the use of UDB data for the planning and implementation of local
programmes.
1Adama Bah, National Targeting Unit (UPSPK), the National Team for the Acceleration of Poverty Reduction (TNP2K),
v
Table of Contents
Acknowledgements ... vii
Abbreviations, Acronyms and Indonesian Terms ... viii
1. Introduction ... 10
2. Methodology and Study Implementation ... 12
2.1. Requests for UDB Data by Local Government Institutions ... 12
2.2. A qualitative assessment of the UDB data use ... 13
2.3. The user feedback survey (UFS)... 14
3. Local Users of the UDB ... 15
3.1. UFS Questionnaires Returned ... 15
3.2. User Types ... 15
3.3. User satisfaction with the UDB data and the service provided by TNP2K ... 15
3.4. Recommendations for future evaluations of the use of the UDB ... 16
4. Socialisations of the UDB ... 17
4.1. Sources of Information on the UDB ... 17
4.2. Other data sources used for local programmes ... 17
4.3. Recommendations on the socialisation of the UDB... 19
5. The Data Request Procedure ... 20
5.1. Procedures to access the UDB data... 20
5.2. Consultation at the time of the data request ... 20
5.3. Reception of the data ... 21
5.4. Recommendations regarding data access procedures ... 22
6. Uses of the data for local programmes ... 24
6.1. Institutions that did not use the data ... 24
6.2. Reported uses of the UDB data ... 26
6.3. Additional needs for support in using the UDB ... 27
vi
7. Data Verification and Validation ... 30
7.1 Objectives of Verification / Validation ... 30
7.2. The incidence of validation/verification among local users of the UDB ... 30
7.3. Data validation and perception of data quality ... 32
7.4. Recommendations ... 33
8. Summary of Recommendations and Concluding Remarks... 34
Annexes ... 36
Annex 1: Selection of areas for the qualitative assessment ... 36
Annex 2: User feedback questionnaire ... 37
Annex 3: Official letter accompanying the user feedback survey ... 42
Table of Figures
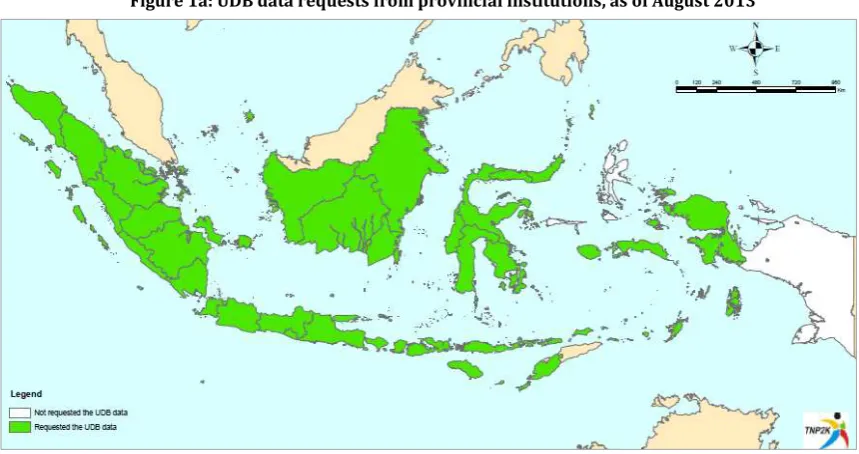
Figure 1a: UDB data requests from provincial institutions, as of August 2013 ... 12Figure 1b: UDB data requests from district institutions, as of August 2013 ... 13
Figure 2. User satisfaction rating ... 16
Figure 3: Users’ sources of information on the UDB ... 17
Figure 4: Other data sources used for local programme planning and implementation ... 18
Figure 5: Information received during the data request consultation ... 21
Figure 6: Information provided during the consultation after the data was received ... 22
Figure 7: Reported reasons for not using the UDB data ... 25
Figure 8: Reported uses of the UDB data ... 26
Figure 9: Difficulties encountered with the UDB data by user type ... 27
Figure 10: Intended future uses of the UDB data ... 28
Figure 11: Current and planned validation/verification, by region ... 31
vii
Acknowledgements
The authors would like to thank colleagues at the National Team for the Acceleration of Poverty Reduction (TNP2K) who contributed to the implementation of the qualitative study and the user feedback survey: Octavius Tjiantoro, Arezka Hantyanto, Astya S. Pradipta, Bambang Darsono, Julia Tobias, Heksaputra, Lucky Koryanto, Lusiana Rumintang, Maya Augustin, Nelty Rosanna, Nidah Saidah, Rachma Safitri, Siti Nurfitriah F. D. and Yudho S. Wirawan.
We also thank Suahasil Nazara (Policy Working Group Coordinator, TNP2K) and Sudarno Sumarto (Policy Advisor, TNP2K) for insightful comments and suggestions on the implementation of the study and on the paper. Editorial support was provided by Maciej Czos, Maya Thatcher and Megha Kapoor. Any remaining errors are our sole responsibility.
viii
Abbreviations, Acronyms and Indonesian Terms
APBD Local Government Budget (Anggaran Pendapatan dan Belanja Daerah)
BAPPEDA Agency for Planning and Regional Development (Badan Perencanaan dan Pembangunan Daerah)
BKKBN National Family Planning Coordinating Board (Badan Kependudukan dan Keluarga Berencana Nasional)
BPS Statistics Indonesia (Badan Pusat Statistik)
BSM Cash Transfers for Poor Students (Bantuan Siswa Miskin) (Wakil) Bupati (Vice) District Regent
Dinas Kesehatan District Health Office Dinas Pendidikan District Education Office
FRP Substitution Summary Sheet (Formulir Rekapitulasi Pengganti)
Jamkesda Locally-funded health insurance programme (Jaminan Kesehatan Daerah) Jamkesmas Health Insurance for the Poor (Jaminan Kesehatan Masyarakat)
Kabupaten/Kota District/City Kartu Keluarga Family Card Kecamatan Sub-district
PKH Conditional Cash Transfer Programme (Program Keluarga Harapan)
PMT Proxy-Means Testing
PPLS Data Collection for Social Protection Programmes (Pendataan Program Perlindungan Sosial)
Rakor TKPK Coordinating Meeting for Local Poverty Reduction Coordination Teams (Rapat Koordinasi TKPK)
Raskin Rice Subsidy for the Poor (Subsidi Beras Bagi Masyarakat Berpenghasilan Rendah)
SETDA District Secretariat (Sekretariat Daerah)
SKPD District government technical offices (Satuan Kerja Perangkat Daerah) Surat Pernyataan Written Statement
Susenas National Socio-economic Survey (Survei Sosial Ekonomi Nasional)
TKPK (D) Local Poverty Reduction Coordination Team (Tim Koordinasi Penanggulangan Kemiskinan (Daerah))
ix UDB Unified Database for Social Protection Programmes (Basis Data Terpadu untuk
Program Perlindungan Sosial)
10
1. Introduction
The Unified Database for Social Protection Programmes (UDB) is a system identifying potential beneficiaries of social protection programmes in Indonesia. It contains detailed socio-economic and demographic information, as well as names and addresses, of the poorest 40 percent of the Indonesian population.2 The database, managed by the National Team for the Acceleration of Poverty Reduction
(Tim Nasional Percepatan Penanggulangan Kemiskinan – TNP2K) under the office of the Vice-President of Indonesia, was established in February 2012. With more than 25 million households (or 96 million individuals) living in over 77,000 villages nationwide, the UDB is the largest database of its kind in the world.
Drawing on Indonesia’s and other countries’ past experiences with targeting, the UDB utilises an improved technical methodology for identifying the poor and vulnerable. This methodology is based on (i) non-discretionary data to identify households to survey – as opposed to relying on suggestions from village leaders as was done in the past; and (ii) on proxy-means testing (PMT)3 to rank households
by their predicted welfare. The source data was collected in 2011 through the Data Collection for Social Protection Programmes (Pendataan Program Perlindungan Sosial - PPLS) survey carried out by Statistics Indonesia (Badan Pusat Statistik – BPS).
Initially, the UPSPK (Unit Penetapan Sasaran untuk Penanggulangan Kemiskinanan), TNP2K’s unit in charge of managing the UDB, expected to focus on supporting government agencies responsible for the implementation of national social protection programmes. The UDB data has indeed been used to select recipients of the largest national social protection programmes, including health insurance (Jaminan Kesehatan untuk Masyarakat – Jamkesmas), scholarships (Bantuan Siswa Miskin - BSM), conditional cash transfers (Program Keluarga Harapan – PKH), and subsidised rice (Beras untuk Rumah Tangga Miskin – Raskin). Yet, local governments have also shown a large interest in using the UDB data for the implementation of local poverty reduction programmes. As a result, UPSPK’s activities and resources have been largely allocated to serve over 500 local (district and province) government institutions.
It is not the first time that such a database, which was established with the objective of targeting national programmes, is also used for programmes funded by local government budget. The previous targeting databases, developed to support the implementation of Indonesia’s temporary unconditional cash transfer programmes in 2005 and in 2008,4 have also been used by local government institutions for
local programmes. With the establishment of the UDB, however, an innovation has been introduced in the form of service provided along with the data. UPSPK offers a consultation process to local government institutions in order to better match their actual needs and provide them with support on using the data. This consultation process represents the value added by TNP2K to the previous practices,
2 This group, classified as poor and vulnerable to falling into or remaining in poverty, is the target of most social protection programmes in Indonesia, although their coverage varies from programme to programme.
3Proxy-means testing involves predicting households’ welfare level using a set of socioeconomic indicators that are correlated with welfare and that are at the same time easy and less costly to collect than household consumption expenditures or income data.
11 which consisted simply of providing the data to the local government institutions.5 It is expected that
this service provided alongside the data will facilitate poverty reduction efforts at the local level. The UDB system is still at an early stage of development. The objective of this evaluation is therefore to analyse the experiences of different stakeholders in using the UDB and identify the changes required to make its use more efficient. More specifically, this paper aims to draw lessons on what worked, what did not and why in UPSPK’s cooperation with local governments. We analyse the experiences of local -level institutions that use the UDB data, focusing on those that have requested it for local poverty reduction programmes, and provide recommendations on how to improve the service provided to users. In order to identify the areas of improvement for TNP2K and UPSPK in promoting effective use of the UDB at the local level, it is necessary to provide a complete picture of the local users’ experience with the database. We therefore combine an in-depth assessment of the use of the UDB data, which has been conducted directly by the UPSPK team in four selected districts, with a self-administered user feedback survey, completed by institutions that requested the UDB data for the implementation of local programmes. The assessment is based on in-depth interviews with local government officers from the four selected districts; these interviews explore the users’ experiences with the UDB, including the data request process, its reconciliation with other beneficiary databases, the explanation of the targeting methodology to the communities and the handling of complaints from both beneficiaries and non-beneficiaries. The user feedback survey, on the other hand, targets all institutions that requested the UDB data for local poverty reduction programmes. It aims to collect larger-scale information on their experiences with UPSPK, their levels of satisfaction, the difficulties they encountered in using the data and their suggestions for improvement.
This paper finds that the UDB data is used for local programmes, although there are improvements to be made in the service provided by TNP2K which can increase this usage. It is recommended that UPSPK/TNP2K be more proactive in maintaining regular contact with local government institutions and support them in their use of UDB. More specifically, the use of the UDB data can be enhanced especially by providing training to local government officers as well as by developing more socialisation materials on the UDB and its use, which can then be widely distributed to all relevant stakeholders.
The remainder of the paper is organised as follows: the next section presents the methodology used for the qualitative assessment of the use of the data, Section 3 describes the characteristics of local users of the UDB data, Section 4 discusses the socialisation of the UDB, Section 5 presents the findings on access to data, Section 6 discusses the uses of the data for local poverty reduction programmes, while Section 7 focuses on the issues of data validation and verification and their relation with the perception of quality of the UDB data. Section 8 finally summarises the recommendations for improving the use of the UDB and increasing the effectiveness of social protection programmes at the local level.
12
2. Methodology and Study Implementation
2.1. Requests for UDB Data by Local Government Institutions
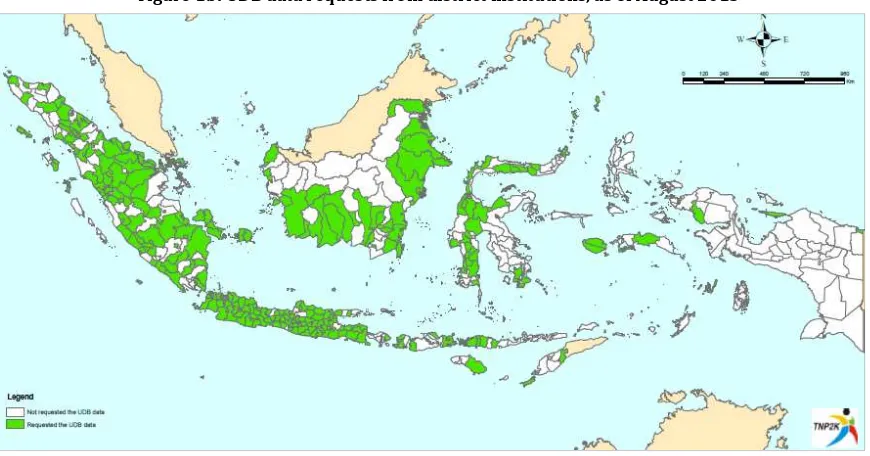
The focus of this paper is on local institutions that have requested the UDB data to support the planning and implementation of local poverty reduction programmes. At the provincial level, by August 2013, the UDB data had been requested by all but two provinces (North Maluku and Papua), as seen in Figure 1a. At the district level, there appears to be more heterogeneity. Figure 1b shows that while several districts in Java and Sumatra have requested the data for local poverty reduction programmes, in the eastern part of the country a relatively large number of districts have not requested the UDB data. This paper focuses on the 339 requests for the UDB data that occurred between February and December 2012. Among these requests, 39 originated from provincial institutions, 73 from urban district (kota) institutions and 227 from rural district (kabupaten) institutions. These can be otherwise disaggregated into 231 requests from provincial and district Agencies for Regional Development (Badan Pembangunan Daerah – BAPPEDA), and 108 from non-BAPPEDA. The non-BAPPEDA group of institutions comprises mostly district or provincial government technical offices (Satuan Kerja Perangkat Daerah – SKPD, also known as Dinas), such as education or health offices, as well as district secretariat (Sekretariat Daerah – SETDA), vice-bupati, bupati, or vice-governor offices. All these institutions are the units of analysis in this paper; their officers were interviewed by the UPSPK team and sent the user feedback survey. The in-depth interviews were conducted in November 2012, while the user feedback survey was carried out in February-March 2013. The implementation details of both methods are presented below.
13
Figure 1b: UDB data requests from district institutions, as of August 2013
Source: UPSPK administrative data on data requests.
2.2. A qualitative assessment of the UDB data use
The selection of districts for the qualitative assessment was based on several criteria. The main requirement was to have at least one data request originate from BAPPEDA, either to plan local poverty reduction programmes or to select their beneficiaries. BAPPEDAs’ experiences with the UDB and UPSPK are considered representative of the challenges faced by users in handling and using the data. BAPPEDAs act as secretariats of the Coordinating Teams for Poverty Reduction (Tim Koordinasi Penanggulangan Kemiskinan – TKPK) and are also in charge of planning district poverty reduction programmes, which are subsequently implemented by the relevant district government technical offices. Additional district selection criteria relate to (i) having validated or planning to validate the UDB data; (ii) having requested the data specifically for the locally-funded health insurance for the poor programme (Jamkesda – Jaminan Kesehatan Daerah), and (iii) having interacted extensively with UPSPK. The selected sample comprises four areas: Kota Pekalongan (Central Java), Cirebon district (West Java), Badung district (Bali) and Bintan district (Riau Islands Province). The rationale for selecting these areas is summarised in Annex 1.
To gauge the users’ satisfaction with the UDB and obtain suggestions on improving the database, we conducted semi-structured interviews designed to provide answers to the following questions:
What are the uses of the UDB by different stakeholders at the local level?
What are the benefits and challenges of using the UDB?
What, if any, are the mechanisms used to update the UDB data?
What are the experiences with access to data and the timeliness of data delivery by TNP2K?
What is the users’ satisfaction with the technical support provided by TNP2K/UPSPK?
14
2.3. The user feedback survey (UFS)
The user feedback survey (UFS) collects information on the users’ perception of the service provided by TNP2K to facilitate the use of the UDB data. It aims to get a broader insight into the expectations of local government institutions regarding the UDB as well as the services and procedures established by TNP2K in supporting access to it. The UFS questionnaire has been developed by the UPSPK team with inputs from other units within TNP2K. Given that the questionnaire is self-administered, careful attention was paid to the formulation of the survey questions, so that all the respondents would understand them uniformly and provide the exact information they were asked for. To further ensure the questionnaire’s reliability and validity, it was pre-tested on a sample of 20 local government officers and then revised based on their answers and comments before being sent to all users. The final questionnaire is available in Annex 2.
The context of the survey, as well as its intended use, were explained to users in an official letter accompanying the survey. This letter, signed by TNP2K’s Executive Secretary and addressed to the heads of the institutions that requested the data, stated the objectives of the survey, which were to collect feedback from the users on how to improve the cooperation with TNP2K, and, ultimately, to better support them in improving the effectiveness of social protection programmes. It also suggested that the questionnaire be filled by the officers who have been responsible for managing the UDB data. Finally, a deadline for returning the questionnaires was given to ensure that the results could be analysed in a relevant and applicable timeframe. Different letters were drafted for the different types of institutions; an example of the letter sent to BAPPEDA heads is provided in Annex 3.
15
3. Local Users of the UDB
3.1. UFS Questionnaires Returned
Out of the 161 UFS questionnaires that had been sent initially, 115 were returned. Different types of institutions that took part in the study had different return rates. Over 80 percent of BAPPEDAs returned their questionnaires, while only about 50 percent of Dinas and other non-BAPPEDA technical local government offices and 40 percent of the bupati, vice-bupati and vice-governor offices did so. The large majority of institutions that did not return their questionnaires were also unreachable during the follow-up due to the relatively high staff turnover within local government institutions, which makes the contact information registered at the time of the data request quickly outdated. Such turnover is likely to affect the use of the UDB data, especially in cases where the officer responsible for its management is replaced.
3.2. User Types
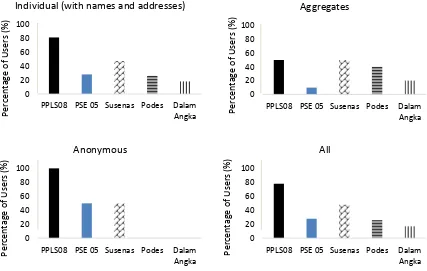
The UDB data available to users can be classified into three categories: (1) individual or household-level data including names and addresses, (2) individual or household-household-level data without names and addresses, and (3) data aggregated at the provincial, district, sub-district (kecamatan) and village levels. Based on the type of data received,6 respondents of the UFS can therefore be grouped into three
categories: (i) users that received individual data with names and addresses, (ii) users that received aggregate data, and (iii) users that received anonymous individual data and/or all three data types. Slightly more than 80 percent of responding institutions received individual data by names; among these, 50 percent also received aggregates. The four districts examined in the qualitative assessment belong to this category of users, having received individual data with names and addresses for the poorest 30 percent.7 Categories (ii) and (iii) account for nine percent of UFS respondents each.
3.3. User satisfaction with the UDB data and the service provided by TNP2K
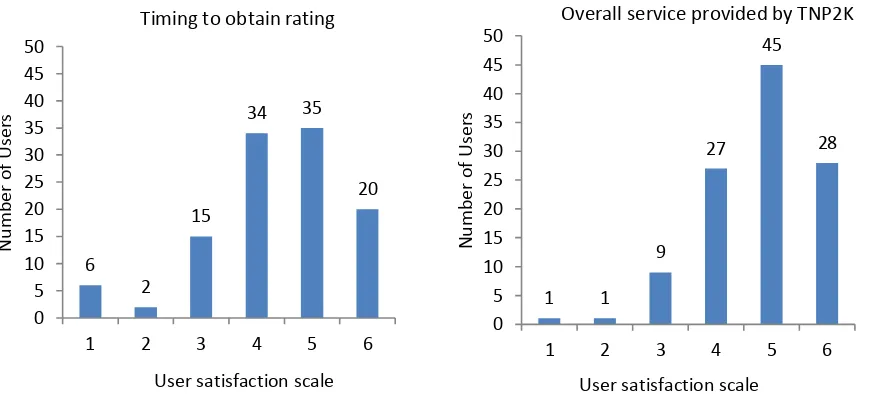
Overall, users appear to be generally satisfied both with the UDB data and with the service provided by TNP2K, as seen in Figure 2. More than 75 percent of users rated their satisfaction level between 4 and 6, six denoting “extremely satisfied”. The average satisfaction score is slightly higher for the overall service than for the timing to obtain the data (4.78 compared to 4.33). When disaggregating users by types, there are little differences in their satisfaction, except for the timing to obtain the data, rated on average at 4.4 among the users of individual data with names and at 3.5 among the users of aggregates. Institutions that have used the UDB data also report that they are generally satisfied with the variables provided to them. However, they cite literacy level, land ownership, school name and date of birth as
6 One institution that was sent the questionnaire reported having received no data, contrary to UPSPK records for this institution.
16
variables which are missing from the UDB, yet which they frequently use for programme planning, selection of beneficiaries and monitoring and evaluation.
Figure 2. User satisfaction rating
Note: The satisfaction scale goes from 1 (very unsatisfied) to 6 (extremely satisfied). Number of users above the bars. Among the institutions that received the data, three did not rate their satisfaction with the overall TNP2K’s service and two did not rate their satisfaction with the time it took to obtain the data.
3.4. Recommendations for future evaluations of the use of the UDB
It is recommended that as part of monitoring and evaluation activities, the user feedback survey (UFS) is regularly sent out to gain quick, large-scale information on users’ perception of the UDB data and UPSPK service and to identify possible areas of improvement in UPSPK’s service. However, a few changes to the questionnaire are required to ensure uniform understanding of the questions among users. For instance, the question on multiple requests should specify requests for the implementation of local programmes. Regarding communication methods, 40 percent of UFS questionnaires were returned by email, indicating that future questionnaires can be also distributed to users through this channel. It is advised that more investigation is conducted to better understand how the high staff turnover within local government institutions affects the extent to which the UDB data is used. To reduce reliance on a single contact person who may move to a different institution, it would be useful to develop a systematic and updated database of local government contacts. This would help strengthen relationships with local government institutions. It is also important for TNP2K/UPSPK to be proactive in maintaining contact with local governments, which would likely increase the return rate of future UFS questionnaires.
17
4. Socialisation of the UDB
4.1. Sources of Information on the UDB
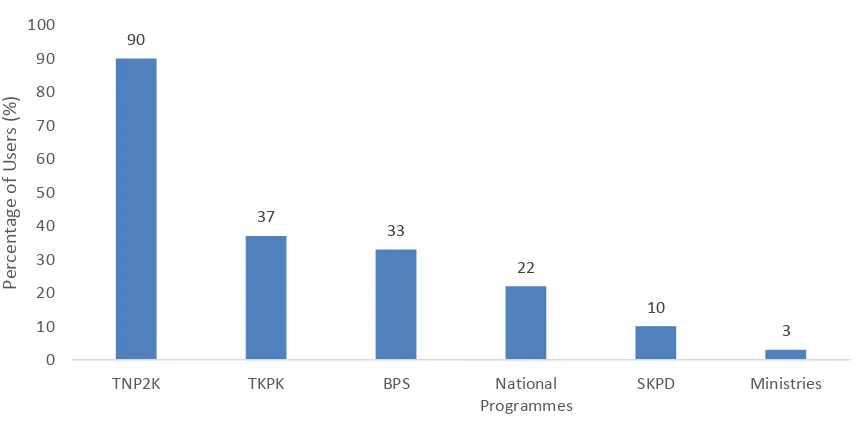
About 90 percent of respondents report having received information on the UDB from the TNP2K Secretariat. In addition, as shown in Figure 3 just below, about 35 to 40 percent of users received information on the UDB from TKPKs and BPS offices. Institutions that received information on the UDB from TNP2K mentioned the national capacity building event organised for TKPK (Rapat Koordinasi TKPK – Rakor TKPK) as the main source of information, followed by the direct socialisation, carried out primarily by the Advocacy and UPSPK teams.
Figure 3: Users’ sources of information on the UDB
Note: Most of the 115 UFS users obtained information on the UDB from more than one source. 103 reported having received information from TNP2K; 42 from TKPK; 11 from provincial or district SKPD; four from ministries; 25 from agencies responsible for national programmes (Jamkesmas, PKH, Raskin, BSM); 38 from provincial or district BPS offices.
4.2. Other data sources used for local programmes
As stated in the introduction, most local users of the UDB use data for the planning and implementation of local social protection programmes. Figure 4 shows that they also use other data sources for these purposes. The most common data source is the PPLS 2008, used extensively by all types of users. In total, about 80 percent of UFS respondents use PPLS 2008, while about 50 percent use the national socio-economic survey (Survei Sosial Ekonomi Nasional -Susenas). In light of this, the question of compatibility of the UDB with other data sources takes on great importance; large discrepancies between the UDB and PPLS 2008 or Susenas results can create confusion and compel local governments to allocate resources to data verification, rather than actual assistance to poor households.
18
It should also be noted that institutions which report that the variables in the UDB do not conform to their needs have one common grievance: the classification by deciles introduced by TNP2K is not comparable to the previous welfare classification of households used by BPS (very poor, poor and near-poor). They suggest therefore that TNP2K provide more socialisation on the decile categories and how these compare to the BPS categorisation.
Figure 4: Other data sources used for local programme planning and implementation
Note: All the 115 institutions use at least one of these data sources. Among them, one reported having received no data, 99 having received individual data by name and address, ten having received only aggregates, and five having received only anonymous individual data
.
The UFS and the qualitative assessment respondents mention the data collection process as the cause for the errors in the data. Accordingly, a number of UFS respondents suggest that more attention be paid to the selection of enumerators as well as to improving their training and supervision.
Moreover, officers from various Dinas in Kota Pekalongan report they were reluctant to use the UDB data because they do not know how it was established and how the decile categories were determined. They report having had difficulties in explaining, when asked by local communities, why some people are deemed eligible for national programmes that use the UDB while others are not. This is likely because the proxy-means testing (PMT) method used for ranking households in the UDB is not clearly understood or sufficiently socialised. They suggest that TNP2K provide a general explanation on how PMT formulas are derived or how the programme beneficiaries are selected. In addition, they suggest to use mass media, such as television, radio and newspapers, to socialise the UDB to the public.
19 Furthermore, the most prominent change brought about by the use of the UDB to identify beneficiaries of national programmes (in particular Raskin) was the change in beneficiary quotas at all levels (provincial, district and village). Due to insufficient socialisation, this change in quotas was perceived as a flaw of the UDB (in that the quotas varied from the previously set ones) and generated complaints from the general public as well as from village leaders and local governments. In Cirebon for instance, this phenomenon has led officers to believe that there are errors in the UDB.
4.3. Recommendations on the socialisation of the UDB
Overall, there is a need for more extensive socialisation on the UDB and the PMT method amongst local government officers and the general public. Such socialisation is required especially since one of the reasons for the perceived high level of error in the UDB data is the general public’s complaints about the implementation of national programmes, which use the UDB to determine beneficiaries. Furthermore, being familiar with the PPLS 2008 and Susenas, local government institutions tend to use these data sources as reference. Enhanced socialisation of the UDB and of its link with these databases is therefore all the more important in areas with large discrepancies between the UDB and these other data sources.
Socialising the UDB entails both in-person activities and the creation and distribution of relevant materials. In-person activities include existing TNP2K activities that target local government institutions, such as the Rakor TKPK, and direct socialisation. These should be continued and improved to provide the most useful information on the UDB to users. Furthermore, BAPPEDAs and local BPS offices, which are the second sources of information on the UDB for other institutions, should be targeted through in-depth, direct socialisation of the UDB. This would contribute to providing accurate information to other local institutions, such as the SKPDs. However, to avoid providing mismatched information, it is important to ensure that the discourse on the UDB is standardised within TNP2K’s different units involved in conducting socialisation.
20
5. The Data Request Procedure
5.1. Procedures to access the UDB data
There is a specific procedure to access data from each of the three categories described earlier. Data aggregated at the provincial, district and kecamatan levels are available on the TNP2K website. To access data aggregated at the village level, as well as individual- and household-level data, the requesting local institutions are required to send an official8 data request letter to the TNP2K Secretariat.
For individual and household data with names and addresses, the request letter has to be accompanied by two supporting documents: the list of programmes for which the data is being requested, and a written statement (surat pernyataan) asserting that the UDB data will be used only for social protection programmes. Such procedure is employed to prevent any attempt to misuse the data. The data request letter and supporting documents can be sent to TNP2K, either by post, fax or email.
5.2. Consultation at the time of the data request
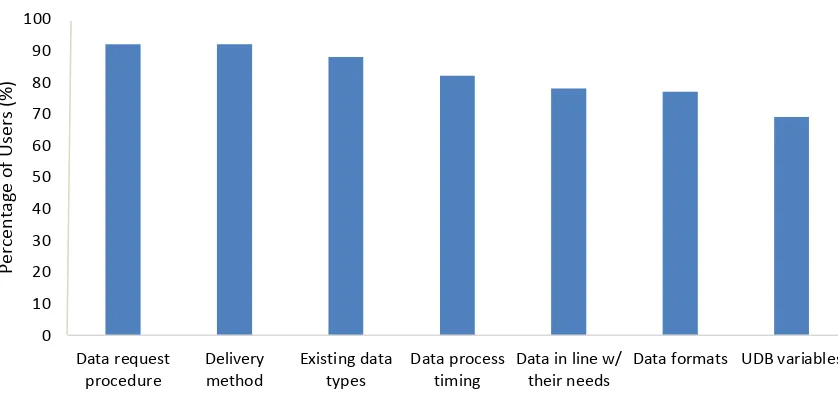
Upon receipt of the request for individual-, household- or village-level data, UPSPK contacts each applicant to gather more information on the institution’s needs and the types of programmes to be implemented using the UDB data. It allows UPSPK Operations staff to establish which variables from the UDB are relevant for the local institution, provide advice on their potential use, and help identify other resources and data sources beyond the UDB. At this point, UPSPK also clarifies the additional steps that the local government institution needs to fulfil in order to receive the data in a timely manner. Overall, 81 percent of UFS respondents report having had a consultation with UPSPK at the time of the data request. Figure 5 shows the type of information received during these consultations. These results indicate that users are not provided with the same types of information in the consultation;9 for all types
of information received during this consultation, users report an average satisfaction level of 5 out of 6.
8 A letter is considered official when it (1) contains the letterhead of the relevant agency or institution and (2) is signed by the head of the institution requesting the data (bupati/walikota, wakil bupati or BAPPEDA head).
21
Figure 5: Information received during the data request consultation
Note: 91 users reported having received a consultation. Among them, 76 received individual data with names and addresses, six received only aggregates and nine received all data types or anonymous individual data.
5.3. Reception of the data
Local government institutions receive the UDB data in two steps. Firstly, the data itself is sent to each user, accompanied by an official letter from the TNP2K Secretariat stating, among others, that TNP2K can be contacted should any additional information be required. A receipt form is sent along with the data, which users are requested to sign upon receiving the data and send back to TNP2K. After receiving the signed receipt form, UPSPK communicates the password required to open the CD containing the individual-, household-level and/or aggregated village level data, and provides further data-related information to the contact person at the local institution, encouraging them also to ask for more information and support if needed.
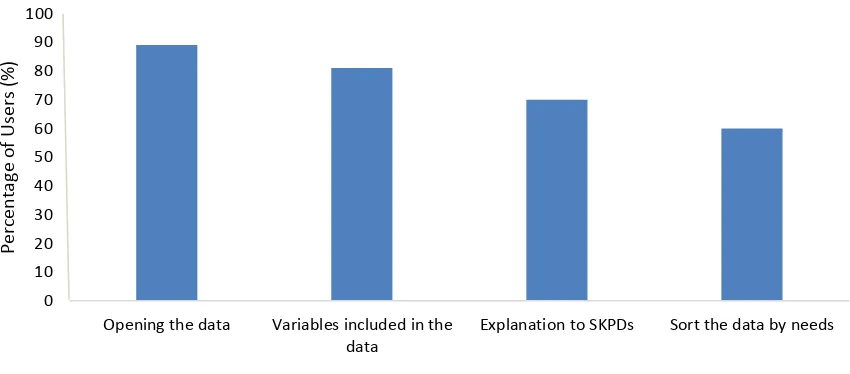
However, only about half of UFS respondents report having consulted with TNP2K after they received the data. Even more unexpectedly, this percentage is the lowest, about 30 percent, among users of individual data with names, which constitute the largest group of users. Figure 6 shows the type of information provided to users after reception of the data. Most users that report having had a consultation after receiving the data were provided with basic information on how to open the data and which variables are included. A lower share of users received information related to how to actually use the data. This reflects the fact that the consultation occurs right after the data is received, therefore users have not yet attempted to use it and are more in need of information on how to access it. Institutions that report having communicated with TNP2K after receiving the data, are highly satisfied with the information received.
The UDB data was received in a format that is easy to use according to 95 percent of UFS respondents. However, in three of the four districts that were part of the qualitative assessment, officers managing the data experienced problems with its format. In Bintan, for instance, BAPPEDA officers did not contact UPSPK, even though they required the data in a different format. Similarly, the BAPPEDA in
22
Kota Pekalongan, which received the full data for their district,10 experienced technical problems in
selecting subsets of beneficiaries but did not contact UPSPK to receive support. The reason behind this may be that officers who interact with UPSPK/TNP2K during the data request and consultation stages are not always the same as the ones who are subsequently responsible for managing the UDB data, and the information communicated by UPSPK/TNP2K does not always reach the latter. As a result, officers who manage the data may not be aware that they can consult TNP2K if needed.
Figure 6: Information provided during the consultation after the data was received
Note: 53 users reported having received a consultation from TNP2K after receiving data. Among them, 43 received individual data with names and addresses, four received only aggregates and six received all data types or anonymous individual data.
5.4. Recommendations regarding data access procedures
Overall, users appear to understand the procedure for obtaining data from the UDB and have no grievances related to the process itself, or to its timeliness. The first set of recommendations relates to the information that is provided to users during the consultations. It should be provided in written form, in addition to the oral consultation that currently occurs, so that it could be stored for future reference, as well as shared within institutions.
The low share of institutions that report having had a consultation after receiving the data points to the fact that communication after the data reception should be explicitly encouraged by TNP2K. First, it is recommended that relevant personnel at local institutions be systematically informed that after receiving the data, they are welcome to request additional information and support from UPSPK. Communication with users can be further triggered, for instance, by developing a “pop-up window” that would appear upon opening the CD containing the data, which would encourage users to contact UPSPK for further assistance. The CD data can also include a video that could describe how to access the data, for users that are not familiar with data, in addition to encouraging further interactions with UPSPK.
10 Note that since October 2012, UPSPK provides data tailored exactly to the programme list provided by the local institution. For instance, an institution requesting the UDB data for 3 programmes with different budgets and target population groups will receive 3 listings, corresponding to each programme’s exact requirements. Before that, institutions that requested the data for a certain number of programmes, like Kota Pekalongan and the other districts of the study, were given the full data for the poorest 30 percent.
Opening the data Variables included in the data
Explanation to SKPDs Sort the data by needs
23 It is also recommended that institutions which receive the UDB data be proactively contacted after regular intervals of time. Frequent interactions, through direct and regular follow-ups, will help ensure that the personnel actually dealing with the data are aware of the possibility of receiving additional support from UPSPK should they require it. Moreover, frequent interactions with local government institutions may increase the probability of receiving feedback on the use of the data, by strengthening the relationship between the users and UPSPK/TNP2K. Frequent interactions will also give users the opportunity to progressively get used to and learn how to work with the UDB data with continuous support.
24
6. Uses of the data for local programmes
The UDB is designed to serve multiple purposes: identifying beneficiaries of social protection programmes and designing, planning and budgeting better programmes and policies based on the socioeconomic profiles of different population groups and geographic areas. The individual- or household-level data with names and addresses are intended for the first use, whereas aggregate data are expected to serve the second purpose. The qualitative assessment of this study has revealed that the data with names and addresses is used for several additional purposes: to develop information systems on poverty, to match with existing programme beneficiary lists and to conduct validation. The last use is discussed in section 7, while in this section, we focus first on institutions that have not yet used the received UDB data, and subsequently, on the actual reported uses of the data.
6.1. Institutions that did not use the data
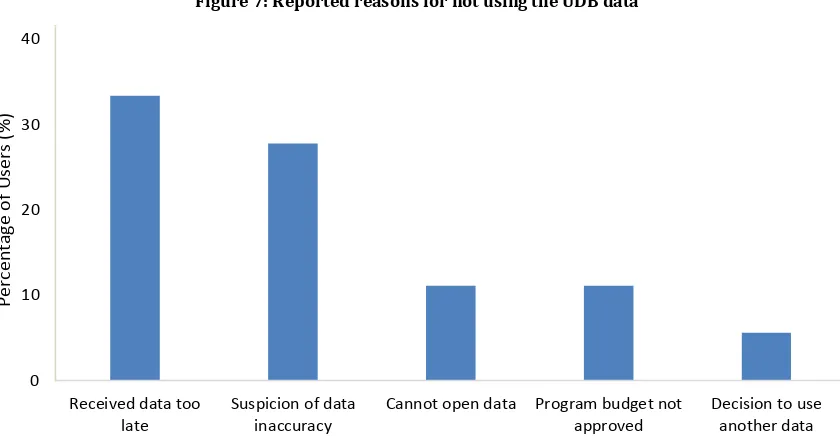
About 14 percent of UFS respondents did not use the data received from TNP2K. The main reason for this is having received it after their programme had already started, as seen in Figure 7. The qualitative assessment in Cirebon illustrates these findings; the UDB data has been requested based on a list of programmes that were already being implemented, which use data from the PPLS 2008 or other sources (e.g. the National Family Planning Coordinating Board, Badan Kependudukan dan Keluarga Berencana Nasional - BKKBN). According to Cirebon BAPPEDA officers, the use of the UDB data is planned for the next fiscal year.
25
Figure 7: Reported reasons for not using the UDB data
Note: 18 institutions reported not having used the UDB data received; one of them did not provide a reason.
The data format does not appear to be a major obstacle to using the data. Indeed, about 83 percent of these institutions consider that the format received is easy to use, and, as seen is Figure 7, only 10 percent state that they did not use the data because they could not open it. However, greater capacity at the local institution level would facilitate the use and management of the data. Managing a very large dataset, as the one received by Kota Pekalongan for instance (nearly 25,000 households and over 100,000 individuals), requires high levels of technical capacity and adequate IT equipment, which might not be readily available in some local government institutions. The BAPPEDA personnel in Kota Pekalongan experienced such difficulties, especially for the selection of a subset of households or individuals with given characteristics. As mentioned earlier, UPSPK now provides data on beneficiaries exactly in line with the coverage and eligibility criteria defined by the local institutions at the time of the data request in order to avoid such obstacles to using the data.
From the UFS, it appears that over 90 percent of institutions that did not use the UDB data also reported not having received any consultation from UPSPK after reception of the data. Since these institutions must have been in contact with UPSPK to receive the password to access the data,11 their perception of
not having received a consultation may imply they have not opened the data altogether. However, in some cases, like in Cirebon and Kota Pekalongan, there has been no contact with UPSPK after the data (and password) was received, although they have experienced problems with the data format or in selecting subsets of beneficiaries.
11This also suggests that the word “consultation” is not understood by all respondents in the same way. Some respondents
indeed might consider a consultation to be a physical meeting with the UPSPK team, and tend to reply ‘no’ if this consultation has been conducted over the phone. The next questionnaires should therefore address this issue, and clarify that a consultation is any interaction with the UPSPK team.
26
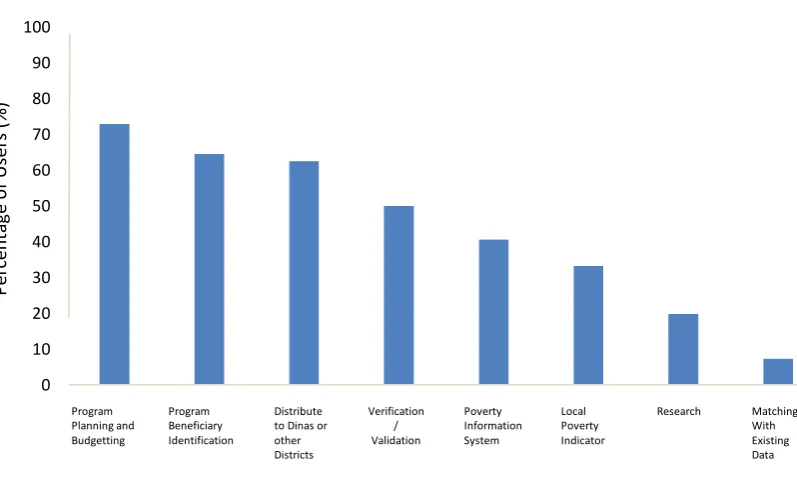
6.2. Reported uses of the UDB data
Figure 8 shows the uses of the UDB data for 85 percent of UFS institutions that have actually used it. About 60 percent of them have done so for programme planning and budgeting, and a little over 50 percent for identifying programme beneficiaries. Among the four districts selected for the qualitative assessment, in which all institutions have requested data by names and addresses to identify beneficiaries of local programmes, only Badung has been found to have used the UDB data for this purpose. It has been used to target beneficiaries of a district-funded scholarship programme, which covers all children from primary school to university. The data was verified in the field to ensure that children from households classified in the poorest 30 percent complied with another programme criterion of being enrolled in school. The Badung BAPPEDA personnel also reported having used the UDB data for planning and budgeting new programmes, with technical support on this from the local BPS office.
Figure 8: Reported uses of the UDB data
Note: 96 institutions reported having already used the UDB data at the time of the survey; 86 received individual data by name and address, six received aggregates and four received anonymous individual data.
Other uses of the UDB data, reported by about 50 percent of local institutions that used it, include its distribution to SKPDs.12 In Bintan, where there are at least 20 programmes funded through the district
budget, the BAPPEDA has socialised the UDB data to all SKPDs following an instruction from the Vice-Bupati to improve programme complementarity for poor households by using a single data source for identifying beneficiaries. A procedure has been established for the SKPDs to request the data from the BAPPEDA; it requires a formal request letter stating the purpose for which the data will be used and the list of required variables. The data is then printed and provided to the SKPD. No electronic version of the data is released.
12 The provincial BAPPEDA offices may distribute the data to district units, while district BAPPEDAs may distribute the data to various Dinas in the district.
27 Additional reported uses of the data include, as seen in Figure 8, the development of poverty information systems and the computation of local poverty indicators. The BAPPEDA in Cirebon has attempted to develop a poverty information system, as have 35 percent of UFS respondents. However, they have experienced challenges in doing so and have hired a consultant to overcome the limited technical capacity to manage and analyse the data.
6.3. Additional needs for support in using the UDB
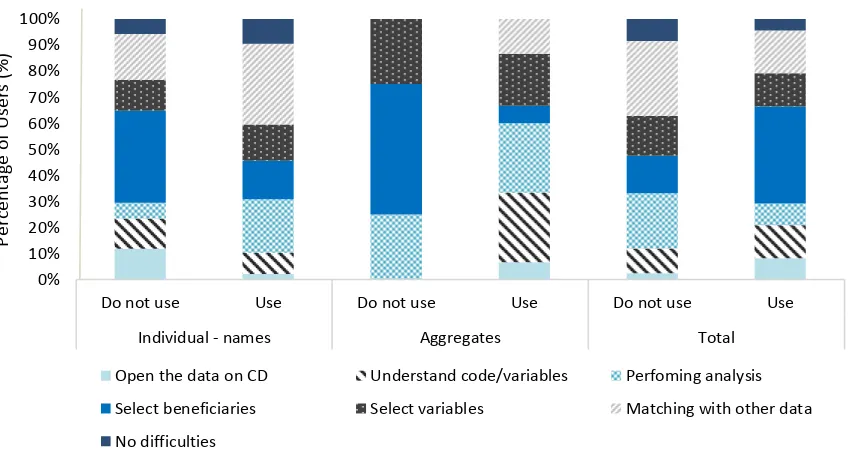
Figure 9 shows challenges that users experienced with the data by user type and by reported use. Firstly, there are some unlikely difficulties reported by the users. For instance, nearly 50 percent of institutions that requested aggregate data and did not use it report having experienced difficulties in identifying beneficiaries, a task that this type of data is not suited for. Among institutions that did use the data, there are also a few surprising answers. For instance, about 40 percent of users of anonymous data reported difficulties in selecting programme beneficiaries and matching the UDB with other data sources, while both are virtually impossible with this type of data. This may suggest that respondents understand these answers differently than intended, or alternatively, there may be some confusion among users regarding the different types of data available in the UDB and their specific use.
Other commonly reported difficulties experienced with the UDB data include understanding the variables and analysing the households’ socio-economic conditions. Documentation is currently provided on the CD containing the data to explain the different variables included in it. However, this information may not be user-friendly for all, especially for those users with limited IT and data management skills. As for difficulties in analysing the characteristics of the poor, respondents suggest that the capacity of local government institutions personnel to analyse the UDB data be improved, especially given that in some areas the size of the data they received is too large to be easily handled.
Figure 9: Difficulties encountered with the UDB data by user type
Note: Among the 114 institutions that received UDB data, 96 reported having used the data, while 18 reported not having used it. Disaggregating by type of data, 99 received individual data by name and address and ten received only aggregates.
0%
Open the data on CD Understand code/variables Perfoming analysis
Select beneficiaries Select variables Matching with other data
28
Figure 10: Intended future uses of the UDB data
The UFS also asks users about their intended future use of the UDB. Their answers are shown in Figure 10, separately for institutions that currently use the data and those that do not. Among institutions that have not yet used the data, over 70 percent plan to distribute it to SKPD and about 65 percent plan to validate/verify it and use it for planning. Among institutions that already use the data, nearly 90 percent intend to use it for planning local programmes. This represents a good opportunity for TNP2K to provide training on how to optimally use the data for programme planning. Regarding the large share of local institutions that plan to conduct validation/verification, it may be argued that these plans are not likely to occur if the UDB data is updated in 2014, as discussed in the next section.
6.4. Recommendations on supporting local governments in using the UDB data
It is first recommended to follow up regularly with each institution that received the data, for instance on a monthly basis, to ensure that any of their problems and needs for further assistance can be addressed. There is also the need for UPSPK/TNP2K to frequently communicate and work individually with each institution in order to improve their understanding of the UDB and guide them on the type of data that is most appropriate for their needs.
Regarding the different uses of the UDB data, TNP2K can further support local governments in planning programmes and policies as well as in developing poverty information systems. This support can entail technical help on developing data management tools and the provision of training on the use of such tools for analysing the data.
UPSPK has started experimenting with a business intelligence application that is useful for such purposes. This application helps produce aggregates on any population subgroups in a flexible and simple way. Training local governments on how to use this application and making it available on the UDB website is likely to increase their buy-in and their use of the UDB. In fact, UPSPK has started providing on-demand training to local government institutions, which has generated substantial interest
0
Institutions that have not yet used the data (18) Institutions that have used the data (96)
29 in this planning tool. It is recommended for UPSPK to expand these training activities in order to increase the use of the data. Additionally, a close collaboration with TNP2K’s Advocacy Team, which regularly conducts training for TKPKDs, can enable UPSPK to reach out to a larger number of local governments. The production of booklets and interactive training materials, describing in detail the potential that the UDB data offers for policymaking at the local level, is also recommended.
30
7. Data Verification and Validation
7.1 Objectives of Verification / Validation
Validation assesses whether households listed in the UDB are correctly classified according to their actual poverty status. It aims, firstly, to confirm the proxy-means testing (PMT) welfare classification and identify errors of inclusion and exclusion, and secondly, to update household ranking, depending on how their circumstances might have changed over time. Verification, on the other hand, consists of confirming the physical existence of households in the field, as well as the accuracy of their characteristics recorded in the UDB. It further aims to ensure that the UDB data is up to date, given that the PPLS survey was conducted in 2011.
Most households do not experience significant changes in their socio-economic characteristics in the short term. Validation of the full data on the poorest 30 percent or 40 percent, which is relatively expensive,13 would not lead to the identification of significant changes in household socio-economic
conditions. Validation/verification may not be the most efficient use of limited public resources available for poverty reduction. For instance, local government resources can be used to expand program coverage to include households considered eligible but that are excluded from the UDB list. Instead, TNP2K advises that field verification of beneficiary compliance with the eligibility criteria of each program or community consultations be conducted to update the beneficiary list of each program or verify eligibility for the program criteria.
7.2. The incidence of validation/verification among local users of the UDB
In all four districts visited for the qualitative assessment, the UDB data is planned to be, or has already been, validated or verified. In Bintan, the validation of households classified in the bottom 30 percent was already completed at the time of assessment. The BAPPEDA decided to validate the UDB data for two reasons. Firstly, in the previous targeting surveys (PSE 2005 and PPLS 2008), all surveyed households have become beneficiaries of social protection programmes, whereas not all households surveyed in the PPLS 2011 subsequently became beneficiaries of national programmes that use the UDB (e.g. Raskin). Additionally, upon performing a rapid check of the UDB data in one kecamatan, BAPPEDA officers observed that some non-poor households were included in the poorest 30 percent. As a result, it was decided to conduct the validation for the entire district. The second reason for validating the data and requesting TNP2K’s approval of its results14 is the requirement from the local
parliament (DPR-D, Dewan Perwakilan Rakyat Tingkat Daerah) to submit a verified list of beneficiaries before approving the local budget (APBD, Anggaran Pendapatan dan Belanja Daerah) funding for any programme.
13 In Bintan, the budget for the verification of the poorest 30 percent (5,731 households) in 2012 is about Rp. 400 million. This amounts to about Rp 70,000 per household, whereas the PPLS 2011 has an average cost of Rp. 25,000 per household. For 2013, a budget of Rp. 300 million has been approved. In Cirebon, Rp. 500 million have been budgeted for the 2012 validation. In Badung, Rp. 285 million have been budgeted to assess the differences between the UDB and the PPLS 2008.
31 In the UFS, about 40 percent of the respondents report having validated/verified the data (Figure 8). Figure 11 shows the distribution of local institutions that have conducted or plan to validate the UDB data across regions. The highest share of local institutions that plan to conduct or have already conducted the validation of the UDB data is in Kalimantan. This may be due to Kalimantan having experienced a large decrease in their Raskin beneficiary quotas when Raskin started using the UDB in June 2012 – this occurred for most districts of Kalimantan and in other provinces whose previous beneficiary quotas from the PPLS 2008 were higher than predicted by their relative poverty levels.
Figure 11 – Current and planned validation/verification, by region
Note: There are 40 users from Sumatra, 38 from Java, 9 from Kalimantan, 16 from Sulawesi and 12 from Eastern Indonesia.
As with nearly 60 percent of UFS respondents from Java, all districts of the qualitative assessment also plan to validate the UDB data. The BAPPEDA personnel in Badung have expressed interest in doing so, although field verification had been already performed for the scholarship programme that covers children from the poorest 30 percent households. In Kota Pekalongan, the BAPPEDA plan to validate, in collaboration with the local BPS office, the UDB data for Jamkesda, although only for households classified in the fourth decile. Finally, Cirebon plans to verify the data used for local programmes every year, starting November 2012, based on instructions from the provincial BAPPEDA to update the poverty information system that was set up for West Java.
Regarding future plans to conduct validation, it appears that 80 percent of local institutions that have already validated the data plan to do it again in the future, whereas only about 50 percent of respondents who have not done it have such plans. An important question is whether these plans will be pursued if the UDB is updated in 2014, as planned. The fact that many local governments plan to validate the UDB data and that it is quite expensive (often more expensive per household than the PPLS11) is a good argument for the central government to update the UDB in 2014. Alternatively, it would be useful to develop an ongoing mechanism to update the data, i.e. adding and removing households based on (the evolution of) their socio-economics conditions.
0
Kalimantan Sulawesi NT & Eastern Sumatra Java
32
7.3. Data validation and perception of data quality
Based on the UFS, Figure 12 shows that the quality of most variables (names, addresses, age, gender and welfare rank) is mostly rated 4 and above out of 6, although the rating of the welfare rank in the data is slightly lower, mostly between 3 and 5. Interestingly, the rating of the UDB data quality is similar between local governments that performed validation/verification and those that did not. This suggests that validating/verifying the UDB data does not change users’ perceptions of data accuracy, even though the validation results show, as in Bintan, that the number of households wrongly included or excluded from the poorest 30 percent is relatively low.
Data validation and/or verification can simply be an attempt from local governments to understand and therefore be able to take responsibility for the beneficiary selection process, which is generally seen as based on arbitrary criteria, including the decision on whom to survey.15 Furthermore, it appears that it
is still unclear for local government officers that not all surveyed households will be eligible to receive social assistance, which used to be the practice in the past. Local government officers also resort to validating and verifying the data because they are the first target of complaints and grievances from communities if the latter perceive the data to be incorrect, in particular for national programmes.
Figure 12 -User satisfaction with the quality of the UDB data
Note: The satisfaction scale goes from 1 for very unsatisfied to 6 for extremely satisfied (denoted on the x-axis). 42 institutions performed validation and 34 did not. 39 institutions that reported having received the data did not reply to this question (among these 19 reported having used the data).
15 Some of the respondents from the qualitative assessment in Cirebon have mentioned elite capture from village and neighbourhood heads during the data collection process.
0 0
Institutions that did not perform validation
33
7.4. Recommendations
As mentioned earlier, local governments are familiar with the PPLS 2008, which they have been using to support the implementation of local poverty reduction programmes. The PPLS 2008 remains therefore the benchmark and where there are many discrepancies between the UDB (number of households classified in the poorest 30 percent) and the PPLS 2008, local governments are more inclined to conduct validation/verification. More socialisation and explanation of the UDB and its similarities and differences with the PPLS 2008 is therefore likely to reduce the likelihood of UDB data validation.
The updating of the UDB in 2014 is likely to deter local governments from conducting validation/verification. However, it is recommended that local governments be actively involved in the process, especially during the data collection. It is also recommended to communicate more openly with local governments the methods and other characteristics of the process in order to make it more open and inclusive. Involving local governments in the updating of the UDB might further contribute to increasing their confidence that poor households are surveyed, which may eventually promote the use of the UDB.
It is also recommended that a mechanism be developed to address grievances from the communities concerning inclusion and, more importantly, exclusion errors. Even with the updating of the UDB in 2014, it would be difficult to sustainably discourage local government institutions from validating and verifying the data in the absence of a credible and functional grievance mechanism. If local governments observe errors in the data and have no channel of addressing them, their only option is to validate or verify the data.
34
8. Summary of Recommendations and Concluding Remarks
In this study, we evaluate the use of the UDB at the local level, in order to identify areas of improvement in the cooperation between TNP2K and local governments for increased effectiveness of local poverty reduction programmes. Based on a qualitative assessment conducted in 4 districts and on a UFS, this study reveals that the UDB is being used at the local level. However, it could be enhanced if more active and thorough socialisation and communication of the UDB is undertaken among local government institutions and communities. Frequent interactions between UPSPK and local government institutions would also encourage more effective and increased use of the UDB.
More socialisation and communication on the UDB, both in-person and through the distribution of communication material is needed at the local level. The perception of the UDB can be improved by producing and distributing more systematically booklets, Q&A, informative videos about the UDB, the beneficiary selection process and the potential uses of the data. Such socialisation material should be widely distributed to local government officers in order to enable them to address the communities’ questions about the UDB.
Secondly, it is important for TNP2K/UPSPK to be proactive in maintaining contact with local governments. It would also be useful to develop a systematic and updated database of local government contacts, which would facilitate strong relationships with local government institutions even when the only contact will have moved to a different institution.
The data request process can be also improved by simplifying second and subsequent requests for the data. When there are no subsequent requests, UPSPK should proactively contact users at regular intervals. A pop-up window should appear when opening the CD containing the data, with a message inviting local governments in simple and straightforward language to contact UPSPK for anything they would need as well as to receive the password to access the data. The use of the data can be further enhanced by proactively contacting local institutions at regular intervals after the data has been given to them. This would not only allow for the identification of areas where support is needed, but also offset the high staff turnover issue that makes the contact information collected at the time of the data request quickly outdated.
UPSPK should be proactive in proposing training on the use of the UDB data, targeting primarily the BAPPEDAs, which act as the secretary of the TKPKD offices and are in charge of the coordination and oversight of local poverty reduction strategies. Such training should cover specifically the use of the UDB data for programme planning and implementation; it could be offered on demand to individual users, as well as during local events (at district or province levels) comprising more than one institution/local governments. In line with respondents’ suggestions, we also recommend developing training materials to be broadly distributed among users.
In addition to large scale socialisation of the UDB, a functioning and effective grievance redress mechanism should be established to improve the perception of the UDB among local governments and the general public. This, in addition to actively involving both these stakeholders during the planned updating of the UDB in 2014, will be helpful in reducing the widespread tendency of local users to validate and/or verify the data.
36
Appendix
Annex 1: Selection of areas for the qualitative assessment
Category No. of
Districts with some degree of interaction with UPSPK
Kota Depok 1 Mar – Apr 2012 11 No Good relationship between BPS and
Districts with no interaction with UPSPK after data reception
37
Annex 2: User feedback questionnaire
Formulir Umpan Balik
Penggunaan Basis Data Terpadu untuk Program Perlindungan Sosial
oleh Pemerintah Daerah
==================================================================
====
Bapak/Ibu yang terhormat,
Instansi Bapak/Ibu diundang untuk berpartisipasi dalam survei umpan balik ini karena instansi Bapak/Ibu pernah meminta dan memperoleh data dari Basis Data Terpadu (BDT) untuk Program Perlindungan Sosial yang dikelola oleh Sekretariat Tim Nasional Percepatan Penanggulangan Kemiskinan (TNP2K). Pengisian formulir ini idealnya dilakukan oleh pejabat yang mengelola data dan program perlindungan sosial/penanggulangan kemiskinan di daerah Bapak/Ibu. Apabila pengelolaan and penggunaan data ini dilakukan oleh sejumlah unit atau instansi di daerah Bapak/Ibu, maka kami menyarankan agar formulir ini diisi melalui diskusi dengan pejabat-pejabat dari unit dan instansi terkait.
Informasi dari instansi anda dalam survei ini sangat penting bagi peningkatan kualitas pelayanan Sekretariat TNP2K dalam memfasilitasi penggunaan BDT. Kami berharap agar pertanyaan-pertanyaan dalam formulir ini dijawab dengan apa adanya. Kami akan menjaga kerahasiaan jawaban yang diberikan dalam survei ini.
Tolong diisi data tentang instansi Bapak/Ibu Nama Instansi :
Tolong diisi data kontak untuk komunikasi lebih lanjut terkait survei ini Nama Lengkap :
Jabatan :
NIP :
Nomor Telepon/HP : Alamat Email :
1. Dari institusi mana instansi Bapak/Ibu mengetahui keberadaan Basis Data Terpadu? (boleh memilih lebih dari satu jawaban)
A. Sekretariat Tim Nasional Percepatan Penanggulangan Kemiskinan (TNP2K) B. Tim Koordinasi Penanggulangan Kemiskinan n/Kota/Kab
C. SKPD Prov/Kota/Kab
D. Kementerian/ Lembaga Pemerintah Pusat
E. Program-Program Nasional (Jamkesmas, PKH, Raskin, BSM, dll.) F. Kantor Badan Pusat Statistik Indonesia (BPS) Prov/Kota/Kab
G. Lainnya (sebutkan):
________________________________________________________________________________
Jika jawaban A (Sekretariat TNP2K), melalui media apa instansi Bapak/Ibu mendapatkan informasi tentang Basis Data Terpadu? (boleh memilih lebih dari satu jawaban)