56
IN SELECTED REGIONS KELURAHAN TERBAN,
YOGYAKARTA, INDONESIA
Nimsi Melati
Stikes Bethesda Yakkum Jl. Johar Nurhadi No. 6 Yogyakarta 524565 Email:[email protected]
ABSTRACT
Background: Indonesia is the third biggest Asian country with a total population aged 60 years and older population after China and India. Based on data from the year 2012 Susesnas Indonesia, elderly population distribution by province shows that the 13.04% of elderly living in Yogyakarta. The elderly need support to face the live changes to maintain high quality of life. Health care provider, family and community around older people should work hand in hand to be support system for our elderly. Objective: to explore about elderly quality of life and fi nd out if there is a signifi cant difference in the self-assessed quality of life of the elderly respondents when their personal profi le characteristics are taken as test factors. Method: This study uses descriptive correlational design. The population are 95 elderly who live in in RW 5 and RW 10 Kelurahan Terban, Yogyakarta. Their quality of life was assessed by themselves and tested by T-test and Anova. Result: Majority of the respondents are 60-70 years old (63%), female (63%), and living with their signifi cant other (78%). There is no signifi cant difference in the self-assessed quality of life of the elderly respondents when their personal profi le (age (F value of 1.849514) and gender (T value of 0.5085)) characteristics are taken as test factors. On other hand, there is a signifi cant difference in the self-assessed quality of life of the elderly respondents when their personal profi le characteristics (living condition) (T value of 2.0972) is taken as test factor. Conclusion: The quality of life of the elderly are good and the living condition has signifi cant difference in self-assessed quality of life of the elderly respondents. Recommendations: There are inputs for enhancement health care service program especially additional activities in Posyandu Lansia.
Keywords: Elderly - Quality of Life – Posyandu
ABSTRAK
Latar belakang: Indonesia adalah negara ketiga terbesar yang memiliki populasi lanjut usia (lansia) usia 60 tahun keatas setelah Cina dan India. Berdasarkan data Susenas Indonesia tahun 2012, distribusi populasi lansia berdasarkan provinsi menunjukkan bahwa 13.04% lansia tinggal di Yogyakarta. Lansia memerlukan dukungan untuk menghadapi perubahan kehidupan untuk mempertahankan qualitas hidupnya. Penyedia layanan kesehatan, keluarga dan komunitas disekitar lansiaa harus bekerja sama untuk menjadi pendukung bagi para lansia kita. Tujuan: Mengetahui tentang kualitas hidup lansia dan mengetahui adanya perbedaan signifi kan qualitas hidup dengan karakteristik lansia. Metode: Penelitian ini menggunakan dekriptif korelasi. Populasi penelitian ini adalah 95 lansia yang tinggal di RW 5 dan RW 10 Kelurahan Terban, Yogyakarta. Kualitas hidup lansia diukur oleh lansia sendiri dan diuji dengan T-tes dan Anova. Hasil: Mayoritas response berusia 60-70 tahun (63%), wanita (63%), dan tinggal bersama keluarga (78%). Tidak ada perbedaan signifi kan antara qualitas hidup lansia dengan usia (F value 1.849514) dan jenis kelamin (T value 0.5085). Di sisi lain, ada perbedaan signifi kan antara kualitas hidup lansia dengan kondisi hidup (T value 2.0972). Kesimpulan: Kualitas hidup lansia baik dan kondisi hidup memiliki perbedaan signifi kan dengan kualitas hidup lansia. Saran: Beberapa masukan di berikan untuk meningkatkan program pelayanan kesehatan terutama kegiatan tambahan di Posyandu Lansia.
Kata kunci: Lansia-Kualitas Hidup- Posyandu
INTRODUCTION
Indonesia is the third biggest Asian country
with a total population aged 60 years and
older population after China and India.
Based on data from the year 2012 Susesnas
province shows that the 13.04% of elderly
living in Yogyakarta (Kementrian Kesehatan
RI, 2013).
Elderly facing many changes in their life such
as physical, emotional and fi nancial changes.
They need support to face the changes to
maintain high quality of life. Health care
provider, family and community around older
people should work hand in hand to be support
system for our elderly.
Quality of life is feeling of satisfaction when
a person meets their needs. Shin and Johnson
(1978) as cited by Walker (2005) defi ne quality
of life as the possession of the necessary
resources to meet the needs of the individual.
This research uses Ann Bowling`s framework
about elderly`s quality of life. Ann Bowling
explain the eight domains which are related
with elderly’s quality of life. The domains
are life overall; health; social relationship;
independence, control over life and freedom;
home and neighborhood; psychological and
emotional well-being; fi nancial circumstances;
and leisure and activities domain (Bowling,
2015).
Seeing the fact that the number of elderly
in Indonesia is getting bigger so that the
researcher want to explore more about elderly
quality of life and fi nd out if there is a signifi cant
difference in the self-assessed quality of life
of the elderly respondents when their personal
profi le characteristics are taken as test factors.
Hence this research can give input to enhance
health care service program especially for
the elderly so that, more programs will be
established and hopefully will improve or
maintain good elderly`s quality of life.
RESEARCH METHOD
This study utilized a descriptive correlation
design. (Best and Kahn, 2006; Fain, 2009;
Fraenkel and Wallen, 2008). This study
was conducted in RW 5 and RW 10 under
Kelurahan Terban, Yogyakarta, Indonesia.
The population was 95 elderly who lives in
that area.
Data collection in this study used a
questionnaire about quality of life which is
adopted and modifi ed from Older People`s
Quality of Life Questionnaire (OPQOL 35).
RESULT
1. Personal characteristic
a. Age
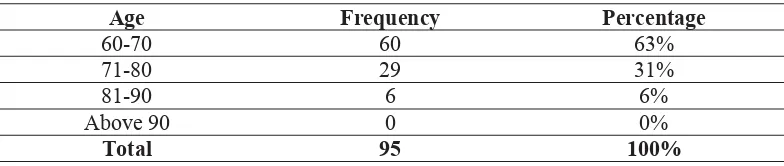
Table 1.
Summary of Values Showing the Frequency and Percentage Distribution of the Personal Characteristics of Elderly Respondents in Terms of Their Age
Age Frequency Percentage
60-70 60 63% 71-80 29 31% 81-90 6 6%
Above 90 0 0%
b. Gender
Table 2.
Summary of Values Showing the Frequency and Percentage Distribution of the Personal Characteristics of Elderly Respondents in Terms of Their Gender
c. Living Condition
Table 3.
Summary of Values Showing the Frequency and Percentage Distribution of the Personal Characteristics of Elderly Respondents in Terms of Their Living Condition
2. Elderly’s Quality of Life
a. Life Overall
Table 4.
Summary of Values Showing the Mean and Verbal Interpretation on the Self-Assessed Quality of Life of the Elderly Respondents in
Terms of Life Overall
b. Health
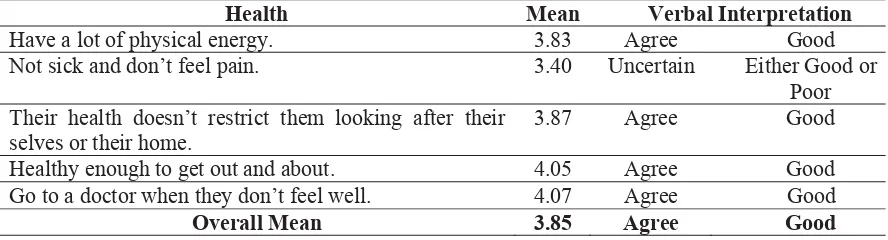
Table 5.
Summary of Values Showing the Mean and Verbal Interpretation on the Self-Assessed Quality of Life of the Elderly Respondents in Terms of Health
Gender Frequency Percentage
Male 35 37% Female 60 63%
Total 95 100%
Living Conditions Frequency Percentage
Living with Significant Other 74 78%
Living with Extended Family 21 22%
Total 95 100%
Life Overall Mean Verbal Interpretation
Enjoy their life overall 3.88 Agree Good
Happy most of the time 3.62 Agree Good
Look forward to things 3.92 Agree Good
Life doesn’t get them down 4.01 Agree Good
Overall Mean 3.86 Agree Good
Health Mean Verbal Interpretation
Have a lot of physical energy. 3.83 Agree Good
Not sick and don’t feel pain. 3.40 Uncertain Either Good or Poor Their health doesn’t restrict them looking after their
selves or their home.
3.87 Agree Good
c. Social relationship.
Table 6.
Summary of Values Showing the Mean and Verbal Interpretation on the Self-Assessed Quality of Life of the Elderly Respondents in Terms of
Social Relationship
d. Independence, control over life and freedom.
Table 7.
Summary of Values Showing the Mean and Verbal Interpretation on the Self-Assessed Quality of Life of the Elderly Respondents in Terms of
Independence, Control over Life and Freedom
e. Home and neighborhood.
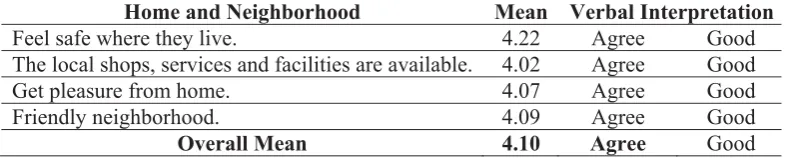
Table 8.
Summary of Values Showing the Mean and Verbal Interpretation on the Self-Assessed Quality of Life of the Elderly Respondents in Terms of
Home and Neighborhood
Social Relationship Mean Verbal Interpretation Their family, friends or neighbors would help if
needed.
4.13 Agree Good Have a good companionship or contact with other
people.
4.05 Agree Good Have someone who gives love and affection. 4.07 Agree Good Have people to enjoy life with. 4.04 Agree Good Have my children around which is important. 4.07 Agree Good Overall Mean 4.07 Agree Good
Independence, Control Over Life and Freedom
Mean Verbal Interpretation
Healthy enough to have independence. 4.05 Agree Good Can please their self what they do. 4.04 Agree Good The cost of things compared to their
pension/income doesn’t restricts their life.
3.65 Agree Good
Have a lot of control over the important things in their life.
3.89 Agree Good
Overall Mean 3.91 Agree Good
Home and Neighborhood Mean Verbal Interpretation
Feel safe where they live. 4.22 Agree Good
The local shops, services and facilities are available. 4.02 Agree Good
Get pleasure from home. 4.07 Agree Good
Friendly neighborhood. 4.09 Agree Good
f. Psychological and emotional well-being.
Table 9.
Summary of Values Showing the Mean and Verbal Interpretation on the Self-Assessed Quality of Life of the Elderly Respondents in Terms of
Psychological and Emotional Well-Being
g. Financial circumstances.
Table 10.
Summary of Values Showing the Mean and Verbal Interpretation on the Self-Assessed Quality of Life of the Elderly Respondents in Terms of
Financial Circumstances
h. Leisure and activities.
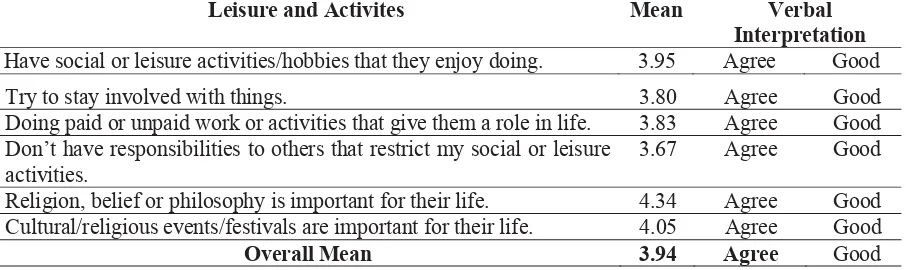
Table 11.
Summary of Values Showing the Mean and Verbal Interpretation on the Self-Assessed Quality of Life of the Elderly Respondents in Terms of
Leisure and Activities
Psychological and Emotional Well-Being Mean Verbal Interpretation Take their life as it comes and make the best of
things.
4.08 Agree Good Feel lucky compared to most people. 4.10 Agree Good
Tend to look on the bright side. 4.04 Agree Good If their health limits social/leisure activities, then
they will compensate and find something else they can do.
3.94 Agree Good
Overall Mean 4.04 Agree Good
Financial Circumstances Mean Verbal Interpretation Have enough money to pay for household bills. 3.52 Agree Good Have enough money to pay for household repairs or help needed
in the house.
3.43 Uncertain Good or Poor Can afford to buy what they want to. 3.53 Agree Good Can afford to do things they would enjoy. 3.67 Agree Good Overall Mean 3.54 Agree Good
Leisure and Activites Mean Verbal Interpretation Have social or leisure activities/hobbies that they enjoy doing. 3.95 Agree Good
Try to stay involved with things. 3.80 Agree Good
Doing paid or unpaid work or activities that give them a role in life. 3.83 Agree Good Don’t have responsibilities to others that restrict my social or leisure
activities.
3. Variable’s Description
a. The summary of ANOVA values showing the signifi cant difference in the difference in
the self-assessed quality of life of the elderly respondents with respect to age.
Table 12.
Summary of ANOVA Values on the Signifi cant Difference in
the Self-Assessed Quality of Life of the Elderly Respondents When their Age Was Taken as a Test Factor
b. The summary of t-test values showing the signifi cant difference in the difference in the
self-assessed quality of life of the elderly respondents with respondent’s gender and
living condition.
Table 13.
Summary of T-Test Values on the Signifi cant Difference in
the Self-Assessed Quality of Life of the Elderly Respondents When their Gender and Living Condition Are Taken as Test Factors
DISCUSSION
1. Personal characteristic
a. Age
Table 1 showed that majority of the
respondents belong to age bracket ranges
from 60-70 years old. The least among
the respondents belongs to 81-90 years
old, having an equivalent rate of 6%.
Indonesian life expectancy based on the
Health Ministry data shows that there
is an increasing number every year.
The 2010 data showed that Indonesian
life expectancy was 69.43 years. That
number increased in 2011 become
69.65 years (Kementrian Kesehatan RI,
2013). According to WHO data, in 2013
Indonesian life expectancy is 71 years
(WHO, 2013).
According to Anggraini and Listyaningsih
(2013) the most infl uence factor that
affect the variety of life expectancy in
Indonesia is the environmental factor.
The other factors are behavior, health
and heredity. In addition, economic
conditions, education and health which is
the basic need of every human being also
affect the life expectancy.
b. Gender
Table 2 shows that among the 95
respondents, there are 60 respondents or
63% are female, while 35 respondents or
37% are male.
The number of elderly women dominate
in Indonesia. Currently an estimated 60%
of the elderly population of Indonesia
are women and this proportion will
increase to 64% in 2030 (Fatmah, 2010; F value computed F critical value Decision
1.849514 3.095433 Accept H0
Variable Computed t T value Level of Significance Decision
Gender 0.5085 1.96 5% Accept H0
Kementrian Kesehatan RI, 2013). The
number of elderly women are higher than
man which concerns with the condition
that woman`s life expectancy in Indonesia
is higher. Woman life expectancy in
Indonesia is 72.8 years and man is 68.8
years (World Health Ranking, 2016).
The life expectancy of men is lower
than women because men tend to have
unhealthy life style and riskier. Some
examples of man`s unhealthy and risky
lifestyle are smokers, drinking, working
in an hazardous environment and risky
recreational activities (Sandra, 2007
in Awad, Yussof, Ismail, and Sarmidi,
2013).
According to Awad, Yussof, Ismail, and
Sarmidi (2013) the factors that affect this
disparities are socioeconomic factors
(income, education) and environmental
factor (air pollution). Higher income
and educational level will increase the
life expectancy because that factors are
related with healthiness.
c. Living Condition
Table 3 shows that most of the respondents
are living with their signifi cant other. They
are 74 respondents or 78% respondents
from total 95 respondents. On the other
hand, only 21 respondents or 22% living
with their extended family.
A study from Agarwala and Saikia (2014)
found out that when elderly who live in
an old age home being asked about the
reason why they choose to live in that
place, one of their answers was related
to the high stress living with extended
family. Living with extended family tends
to increase the risk of having problem
from multigenerational mode of living,
confl ict between mother and daughter
in-law or differences with regard to food
habits.
In this study, most of the elderly are
living with their signifi cant other this
is align with Natividad, Kuan, Bonito,
Balabagno, Manahan, and Anonuevo
(2005) which are say that the elderly need
family to provide emotional and social
support. In Indonesia`s tradition also
carry that the young generation have to
take care of their elderly as the return of
their favor.
2. Elderly’s Quality of Life
a. Life Overall
As seen from table 4, the highest
self-assessment of elderly quality of life goes
to the statement “life doesn’t get them
down” with mean score 4.01 verbally
interpreted as “agree” which means
that the quality of life is “good”. The
lowest mean which score is 3.62 verbally
interpreted “agree” with “good” quality
of life goes to the statement “happy most
of the time”. The overall mean in terms
of life overall dimensions for elderly`s
quality of life is 3.86 with verbal
interpretation “agree” that means “good”
quality of life.
Throughout the journey of human
life, elderly experienced a lot of life
experience. Various life changes can
make people more mature in thought
and action. As stated by Natividad,
and Anonuevo, (2005) who explain
that throughout the life we experienced
acquisition, struggle and legacy. The
quality of what people acquired will give
them strength to face their struggles. If
people acquired negative things than they
will see struggles as heavy problem. The
good and positive things people acquired
will help to solve struggles. Having good
and positive thinking will make people
have good legacy. They can be a good
role model. Seeing this result we can
conclude that the elderly reached a good
legacy.
The highest mean score belongs to the
statement that elderly feels that life
does not make them down. Elderly
experienced life changing such as
physical and psychosocial changes.
Facing this changes elderly should
constantly evolving to adapt with the
environment and the physical limitation
experienced (Stanley, 2006). Even with
more physical and economical limitation
in old age, it seems that the maturity of
the respondent make them always have
positive thinking. They are believe that
they can face the reality.
The lowest mean which score goes to the
statement “happy most of the time”. It is
showed that the elderly respondents are
happy but they might be still looking for
another reason to stay happy at all times.
Some reasons or source of problem in
elderly life may comes from the family.
Agarwala and Saikia (2014) living with
extended family tends to increase the risk
of having problem from multigenerational
mode of living, confl ict between mother
and daughter in-law or differences with
regard to food habits. Having more
problem which make their life stressful
will decrease the quality of life. On the
other hand, according to Balan and Devi
(2015) the elderly who stay active and
doesn’t feel that they are a family burden
will get higher quality of life. It means
that supportive family will make them
happier. Knowing that two study result
we can see that the elderly`s family might
be the resource of problem beside the
support system also.
b. Health
Table 5 shows that the statement “go to
doctor when they don’t feel well” got
the highest mean score which is 4.07
with verbal interpretation “agree” that
means they are having “good” quality of
life. On the other hand the lowest mean
score belongs to the statement “Not sick
and don’t feel pain” with score 3.40,
“uncertain” with verbal interpretation
of “Either Good or Poor” quality of
life, this stament mean score is also the
lowest score among all the statements for
OPQOL. Overall mean for self-assessed
quality of life of the elderly respondent
in terms of health is 3.85 with “good”
verbal interpretation.
Abdollahi and Mohammadpour (2013)
found out that Health Related Quality
of life (HRQOL) for elderly in Iran is
worse in elderly living in nursing home
compared to whom living in home. This
research fi ndings support present research
which shows that the health dimension of
all of the elderly respondent are not living
in the nursing home.
Increased age often makes them feel tired,
pain or discomfort even if they are not sick
(Bowlin, 2005; Stanley 2006). This factor
might be the cause of the statement “Not
sick and don’t feel pain” get the lowest
mean score not only in this dimension
but also the lowest score among all the
question in this questionnaire.
The statement “go to doctor when they
don’t feel well” got the highest mean
score in this dimension. The elderly
willingness to go to the doctor or checking
their health status can be related to the
motivation from their social environment.
In Indonesia there is a Posyandu Lansia
programs in every region. The objectives
of this program are to help and reach the
elderly in their house so that they will
easily get treatment or help. Thus, this
program add a good social environment
for the elderly. According to Mollenkopf
and Walker (2005) People with good
social environment and active in the
activities become easier to adapt and also
having good physical and mental health.
c. Social relationship
Seen from table 6, are the elderly`s quality
of life on social relationship dimensions.
All the items were verbally interpreted as
“agree” which means that having “good”
quality of life. The highest assessment
goes to the statement “their family, friends
or neighbors would help if needed” with
mean score 4.13. The lowest mean score
which is 4.04 belongs to the statement
“have people to enjoy life with”. There
a two statements which are have same
mean score 4.07. The statements are
“Have someone who gives love and
affection” and “Have my children around
which is important “. The overall mean
for this social relationship dimension is
4.07 with “good” verbal interpretation
and which implies having “good” quality
of life.
According to Nugroho (2009) elderly
should be given a chance to socialize or
hang out with other people. This activity
also helps maintaining the communication
skill and prevents dementia. To be
gathered and having fun with others will
lessen the stress level.
This study align with the statement taken
from Nugroho (2009) because the highest
mean score belongs to the statement “their
family, friends or neighbors would help if
needed”. According to previous research
about Elderly`s Posyandu motivation
to follow the activities Senen, Central
Jakarta in 2013 showed that motivation
to attend to the elderly`s Posyandu
activities is related to peer support and
family support.
The lowest mean score which is 4.04
belongs to the statement “have people
to enjoy life with”. This result seems
contradictive with the reality that
majority of the elderly are living with
their significant other. Basically, the
older person needs somebody to live
with because they can be the resource of
help in daily activities or other physical
functions and also provide emotional
Bonito, Balabagno, Manahan, and
Anonuevo, 2005). According to Mauk
(2010) having a social network or friends
and family does not mean that there
is a social supports because the more
important aspects may be the number of
supportive persons and the various types
of support like: emotional, instrumental
and informational support. It means that
they might live or stay with their family
but may be because of the busy activity
of the family like working or schooling
they can always be with the elderly.
d. Independence, control over life and
freedom.
Table 7 shows that almost all the elderly
answered “agree” for all the points
and this means that they have “good”
quality of life. The statement of “healthy
enough to have independence” got the
highest mean score namely 4.05 with
“agree” verbal interpretation. On the
other hand, the statement of “the cost of
things compared to their pension/income
doesn’t restricts their life” got the lowest
mean score namely 3.65 with “agree”
verbal interpretation. The overall mean
is 3.91 with “agree” verbal interpretation
which means “good” quality of life.
Independence is the ability of the elderly
respondent to carry out activities either
physical activity and organize daily
activity. Balan and Devi (2015) found out
that elderly`s quality of life will increase
if they are productive and feel that they
were not a family or social burden. That
study is in line with this research fi nding.
The statement about “the cost of things
compared to their pension/income doesn’t
restricts their life” which got the lowest
mean related to the respondent income.
The majority of elderly respondents is in
the age range 60-70 years (63%). This age
is the age of early retirement in Indonesia
(Government Regulation of the Republic
of Indonesia Number 45 Year 2015). This
is a period of transition and the elderly
require an adaptation especially from
differences in income which is lesser
than before. The elderly often feels
the fi nancial limitation in this period
(Kuan, 1993). Thus, this study result
also strengthen the statement that in the
period of retirement there are changes in
elderly`s fi nancial condition, they receive
less income.
e. Home and neighborhood.
Table 8 shows that the statement of “feel
safe where they live” got the highest
mean score 4.22 with “agree” verbal
interpretation. The lowest mean score
4.02 belongs to statement “the local shops,
services and facilities are available”.
This statement got “agree” verbal
interpretation. The overall mean score is
4.10 with “agree” verbal interpretation
which is the highest mean score among
the other OPQOL dimensions. “Agree”
verbal interpretation means “good”
quality of life.
This research fi ndings are similar with
Rathnayake and Siop (2015) study in
Sri Lanka”. Another research from Wen
and Christakis (2005) showed that the
on individuals’ characteristics but also
on their neighborhoods’. Bowlin (2005)
in her study also stated that home and
neighborhood are important to people.
The statement of “feel safe where they
live” got the highest mean score in
this domain. According to Cramm and
Niebore (2013) feeling safe, having
social cohesion and a sense of belonging
within the neighborhood will help elder
people reduce the frailty.
Elderly respondents ranked the statement
“local shops, services and facilities
available” with lowest mean score.
Indonesian Government Regulation No. 43
of 2004 stated that on the Implementation
of Measures to Improve Elderly Welfare
some programs were prepared such as
service for public infrastructure which
are prioritize the elderly (Kementrian
Kesehatan RI, 2013). Seeing the fact
nowadays, that there is lacking facilities
for the elderly in Indonesia which include
the unavailability of public facilities for
the elderly. Currently the elderly often
have to jostle in public facilities (Malau
and Ahnniar, 2010). This may be one
reason elderly feel that the presence of
services and facilities is still considered
lacking.
f. Psychological and emotional well-being.
From table 9 we can see that the highest
mean score 4.10 belongs to statement
“feel luck compared to most people”.
It has “agree” verbal interpretation.
The lowest mean score 3.94 belongs
to statement “If their health limits
social/leisure activities, then they will
compensate and find something else
they can do”. This statement has “agree”
verbal interpretation. Overall mean for
psychological and emotional well-being
dimension is 4.04 with “agree” verbal
interpretation and “good” quality of life.
Research about the quality of life of the
elderly in urban and rural areas in Serbia
conducted by Urošević, Odović, Rapaić,
Davidović, Trgovčević and Milovanović
(2014) showed that the incidence of
anxiety and depression among older
people is greater in rural than in urban
areas.
The highest mean value on this dimension
is in the statement of “feel luck compared
to most people”. According to Balan and
Devi (2015) quality of life was found to be
high when there are less problems among
the elderly and when psychological
problems are low. The feeling of being
lucky is the good indicators psychological
health.
Research by Balan and Devi (2015) di
Kerala, India also showed that the factors
which increase elderly`s quality of life is
to make the elderly stay productive and
their feeling that they are not a family
burden and society. The present research
showed that the statement “If their health
limits social/leisure activities, then they
will compensate and fi nd something else
they can do” which has “good” verbal
interpretation. This statement represents
the desire of the elderly to remain active
despite increasing age. These fi ndings
relate to research of Balan and Devi
be better if the elderly`s desire and the
opportunity to stay active being provided
and supported.
g. Financial circumstances.
As seen in table 10 the highest mean score
3.67 goes to the statement “can afford to
do things they would enjoy” with “agree”
verbal interpretation. The lowest mean
score 3.43 goes to the statement “have
enough money to pay for household
repairs or help needed in the house” with
“good or poor” verbal interpretation.
Overall mean of fi nancial circumstances
dimension is 3.54 with “good” verbal
interpretation which mean “good” quality
of life.
This dimension got the lowest overall
mean score among the other QOL
dimensions. This fi nding is the same
with Rathnayake and Siop (2015) study
fi ndings in Sri Lanka. According to Balan and Devi (2015) one of the factors
which affect the quality of life of the
elderly is family income. Results of
these studies show that poor quality of
life is a refl ection of low and unsteady
income. A study conducted by Datta,
Datta, and Majumdar (2015) in India also
showed the quality of life will improve
signifi cantly with an increase per capita
monthly income.
This research showed that the elderly`s
quality of life are “good”. They can fulfi ll
what they want and what they need.
Elderly respondents earning himself
from like his job, retirement or family.
The lowest mean score 3.43 goes to the
statement “have enough money to pay for
household repairs or help needed in the
house” with neither agree nor disagree”
verbal interpretation. This factor got the
lowest mean score might be because of
the absence of elderly priority to make
house hold repairmen or payment services
needed at home. In the retirement age
most of the elderly rely their need on
their family. They might choose to fulfi ll
what they want from house hold need.
h. Leisure and activities.
As seen at table 11, the highest mean score
4.34 belongs to the statement “religion,
belief or philosophy is important for their
life” with “agree” verbal interpretation.
The lowest mean score 3.67 belongs to
the statement “don’t have responsibilities
to others that restrict my social or
leisure activities” with “agree” verbal
interpretation. The overall mean stands
at 3.94 with “good” verbal interpretation
which implied that the elderly respondents
have “good” quality of life.
The statement of “religion, belief or
philosophy is important for their life”
get the highest mean score with “agree”
verbal interpretation. Religion, belief
and philosophy of life are concluded as
spirituality. Salcedo (2006) fi nds out that
elderly who stay in nursing home are
not only need physical care, emotional
care and social care, but they also need
spiritual care from the care givers. This
study was held in community area is in
line with Salcedo (2006) research which
took place in nursing home. Thus, we can
see that all the elderly need or feel that
The lowest mean score 3.67 belongs to
the statement “don’t have responsibilities
to others that restrict my social or
leisure activities” with “agree” verbal
interpretation. Some of the elderly`s
respondents said that they still have
another responsibility for other (such as
taking care their grandchild when their
parents working or cooking and taking
care of their house) that sometimes make
them cannot go to social activity. That
means that their responsibility for family
restrict them to do other social activity
outside their house.
According to Maslow in Notoatmojo
(2007), human being has 5 level of needs,
one of them is needs for socialization with
others. Human being needs to participate
on the activity around them and activity
that is conducted with other people. This
theory is proved by fi nding on the study
that elderly respondent need and feel the
importance of gathering with their peer
group. They will feel something lost if
they can`t meet the peer group.
3. Variable’s Description
a. The summary of ANOVA values showing
the signifi cant difference in the difference
in the self-assessed quality of life of the
elderly respondents with respect to age.
Table 12 presents the summary of
ANOVA on the signifi cant difference
between the self-assessed quality of life
of the elderly respondents when grouped
according to their age. Based on the
ANOVA statistical treatment with a 0.05
level of signifi cance, F computed value of
1.849514 was less than F critical value of
3.095433 this result implies that the null
hypothesis of no signifi cant difference
in the self-assessed quality of life of the
elderly respondents when their personal
profi le characteristics (age) are taken as
test factor is accepted.
This results are not in line with research
conducted by Rathnayake and Siop
(2015) and Balan and Devi (2015). Their
research shows that quality of life was
associated with age. Moreover, Balan
and Devi (2015) study fi ndings also
shows that there is signifi cant variation in
the quality of life of the elderly among
different age groups, as age increases the
quality of life decreases.
b. The summary of t-test values showing
the signifi cant difference in the difference
in the self-assessed quality of life of the
elderly respondents with respondent’s
gender and living condition.
Table 13 shows that in terms of gender,
the computed T of 0.5085 was less than T
values of 1.96 so that the null hypothesis
is accepted. This research fi nding is
the same with research conducted by
Rathnayake and Siop (2015).
Chakraborty (2014) got a different
research result. He found out that Indian
female elderly has a lower quality of life,
it might be because the discrimination
in India. Balan and Devi (2015) fi nd
out that quality of life among the male
elderly is higher than female. They also
discussed that the socioeconomic of male
respondent is higher than female might
be the cause of better quality of life.
to have more psychological problems
that have roots in their personal, family,
economic and social life.
The second T-test was done to fi nd out
the significance difference between
self-assessed quality of life and living
condition. The result showed that the
computed T of 2.0972 so that the null
hypothesis is rejected.
Rathnayake and Siop (2015) in their study
also fi nd out that the living arrangement
are signifi cantly associated with quality
of life. The person with whom the elderly
stays, has a defi nite role in determining
the quality of life of the elderly (Balan
and Devi, 2015).
The previous study about Elderly`s
Posyandu motivation to follow the
activities in 2013 showed that motivation
to attend to the elderly`s Posyandu
activities is related to peer support and
family support. The help from family,
friends and neighbors for the elderly is
needed because they are the closest to the
Elderly. In line with research by of Balan
and Devi (2015) that the elderly who is
remain active and don’t feel that they are
a burden for the family to have a higher
quality of life.
SUMMARY AND RECOMMENDATION
1. Summary
a. Majority of the elderly are in young
old, female and living with their
signifi cant other.
b. The self-assessed quality of life of the
elderly respondents in terms of eight
domains are good.
c. There is no signifi cant difference in
the self-assessed quality of life of
the elderly respondents when their
personal profile (age and gender)
characteristics are taken as test factors.
On other hand, there is a signifi cant
difference in the self-assessed quality
of life of the elderly respondents when
their personal profi le characteristics
(living condition) is taken as test
factor.
2. Recommendations
a. To improve the social relationship
of the elderly it is also important
to invite elderly to join the outing
activity. Staying active will make the
elderly happier. Supporting the elderly
especially during religion activity or
praying also very important to help
elderly enhance higher quality of life.
b. Family must always pay attention for
elderly. They need to assist and support
the elderly needs, motivate them to be
active.
c. Conduct special Posyandu activity
once in two months which requires
attendee of the elderly and at least one
of family member. Special Posyandu
has additional activities like practicing
traditional dance, playing gamelan.
d. Health care volunteer must
continuously doing the home visit
for elderly especially who are sick or
didn’t come to the Posyandu activity
recreation program in Posyandu.
e. Implement health education program
for the elderly such as doing elderly
gymnastic every week and offering
special food for elderly.
f. Enforce the implementation of
Government Regulation No. 43
of 2004 on the Implementation of
Measures to Improve Elderly Welfare
by requesting government, worship
place offi cers and the shops to provide
space or special lane for elderly.
g. Apply a comprehensive lecture and
application of geriatric nursing care
to sharpen student`s skill in handling
better elderly care.
h. Future researcher can expand the
variable of the study, specifi cally
related to elderly`s needs compared to
their quality of life
BIBLIOGRAPHY
Abdollahi, Fatemeh and Mohammadpour, Reza Ali. (2013). Health Related Quality of life among the Elderly Living in Nursing Home and Homes. Journal of Mazandaran University of Medical Sciences (JMUMS). Retrieved from http://web.b.ebscohost.com
Mauk, Kristen L. (2010). Gerontological Nursing Competencies of Care 2nd edition. USA: Jones and Bartlett Publishers.
Agarwala, Mreeshi and Saikia, Anup. (2014). Living Arrangement of Aged Woman in Kamrup District of Assam. Indian Journal of Gerontology 2014, Vol. 28, No. 3, pp. 357–371. ISSN 0971-4189
Awad, Atif, Yussof, Ishak, Ismail, Rahmah and Sarmidi, Tamat. (2013). Why Woman Life Longer Than Man? Lesson from Sudan. Journal of Academic Research in Economics, Vol. 5, No. 2, pp 258-278. Retrieved from http://web.a.ebscohost. com
Balan V., Sithara and Devi, V. Girija. (2015). Quality of Life of the Elderly in Thiruvananthapuram District, Kerala. Indian Journal of Gerontology, Vol. 29, No. 3, pp. 331–346. Retrieved from http://web.b.ebscohost.com
Chakraborty, Suchandrima. (2014). Gendered Satisfaction about Quality of Life of Indian Elderly: An Inspection. Journal of Alternative Perspectives in the Social Sciences (2014), Volume 6 No2,248-266. Retrieved from http:// web.b.ebscohost.com
Cramm, Jane M and Nieboer, Anna P. (2013). Relationships Between Frailty, Neighborhood Security, Social Cohesion and Sense of Belonging Among Community-Dwelling Older People. Geriatri Gerontology International 2013;13:759–763. Retrieved from: http://web.b.ebscohost.com
Urošević, Jadranka, Odović, Gordana, Rapaić, Dragan,Davidović, Mladen, Trgovčević, Sanja and, Verica, Milovanović. (2015). Quality of life of the elderly inurban and rural areas in Serbia. Military Medical & Pharmaceutical Journal of Serbia, 74 (11), p 968–97. Retrieved from http:// web.b.ebscohost.com
Salcedo, Theophile G. (2006). Health Care Needs Assessment of the Frail Older Adults: Basis for Development of a Home-Based Care Plan. Thesis, Graduate School: TUA
Bowling, Ann. (2015). Older People`s Quality of Life Questionnaire (OPQOL-35). Retrieved from http://www.ilcuk.org. uk/fi les/pdf_pdf_161.pdf.
Bowling, Ann. (2005). Ageing Well Quality of Life in Old Age. New York: McGraw-Hill.
WHO. (2013). Life Expectancy at Birth 1990-2013. (2). Retrieved from http:// gamapserver.who.int/gho/interactive_ charts/mbd/life_expectancy/atlas.html
Stanley, Mickey. (2006). Buku Ajar Keperawatan Gerontik. Jakarta: EGC.
Mollenkopf, Heidrun and Walker, Alan. (2005). Quality of Life in Old Age International and Multi-Disciplinary Perspectives. Netherlands: Springer.
Natividad, Josefi na N., Kuan, Letty G., Bonito, Sheila R., Balabagno, Areceli O., Manahan, Lydia T., and Anonuevo, Cora A. (2005). Caring for the Older Person .Quezon City: UP Open University
Nugroho, Wahjudi. (2009). Komunikasi dalam Keperawatan Gerontik. Jakarta: EGC
Rathnayake, Sarath and Siop, Sidiah. (2015). Quality of Life and Its Determinants among Older People Living in the Rural Community in Sri Lanka. Indian Journal of Gerontology 2015, Vol. 29, No. 2, pp. 131–153 Retrieved from: http:// web.b.ebscohost.com
Notoatmodjo, Soekidjo. (2007). Kesehatan Masyarakat Ilmu dan Seni. Jakarta: Rineka Cipta.
Datta, Debalina, Datta, Pratyay Pratim, Majumdar, Kunal Kanti. (2015)
Association of quality of life of urban elderly with socio-demographic factors. International Journal of Medicine Public Health 2015;5:274-8. DOI: 10.4103/2230-8598.165944
Walker, Allan. (2005). Growing Older Understanding Quality of Life in Old Age. London: McGraw-Hill Education
Best, John W. and Kahn, James V. (2006). Research in Education Tenth Edition. USA: Pearson.
Fain, James A. (2009). Reading, Understanding, Applying Nursing Research 3rd edition. Philadelphia: F. A. Davis Company.
Fraenkel, Jack R. and Wallen, Norman E. (2008). How to Design and Evaluate Research in Education. New York: McGraw-Hill
Kementrian Kesehatan RI. (2013). Buletin Jendela Data dan Informasi Kesehatan, Topik Utama: Gambaran Kesehatan Lanjut Usia Indonesia. Jakarta: Kementrian Kesehatan Republik Indonesia.
Malau, Ita Lismawati F. and Ahniar, Nur Farida. (2010). Presiden SBY Minta Fasilitas Lansia Ditambah Pemerintah Memberikan Bantuan Pada 10 Ribu Lansia Dari 28 Provinsi. Retrieved from http://nasional.news.viva.co.id
Kuan, Lettty G. (1993). Understanding the Filipino Elderly a Textbook for Nurses and Related Health Professionals. Dipolog City: Jesus G. Kuan Foundation.
Natividad, Josefi na N., Kuan, Letty G., Bonito, Sheila R., Balabagno, Areceli O., Manahan, Lydia T., and Anonuevo, Cora A. (2005). Caring for the Older Person. Quezon City: UP Open University
Pensiun. Retrieved from http://www. bpjsketenagakerjaan.go.id
Fatmah. (2010). Gizi Usia Lanjut. Erlangga: Jakarta.
Anggraini, Eviana and Listyaningsih, Umi. (2013). Disparitas Spasial Angka Harapan Hidup di Indonesia Tahun 2010. Retrieved From http://lib.geo. ugm.ac.id.