11
Journal of Public Administration Studies
U R L : h t t p : / / w w w . j p a s . ub . a c . i d / i nd e x . p hp / j p a sWhy does fiscal decentralization negatively affect student dropout rates? Results from
Indonesia’s National Socioeconomic Survey 2002
-2014 and two case studies
Reni Tri Pujiastuti a , Sujarwoto b
a Sleman District Education Agency, Yogyakarta, Indonesia
b Brawijaya University, Malang, Jawa Timur, Indonesia
———
Corresponding author. Tel.: +62-8112575443; e-mail: [email protected] 1.Introduction
High rates of student dropout have become a major challenge in decentralized Indonesia. Despite impressive increases in student enrollment, Indonesia has not been effective at keeping children in school. In 2015, Indonesia achieved enrollment increases of 110% and 101% in elementary and junior secondary schools, respectively (MoEC, 2015). However, approximately 2.4 million of elementary and junior secondary students fail to complete their education. Indonesia is thus 56th among the 127 countries included in the world ranking of student dropout rates (MoEC, 2015).
Indonesia’s basic educational system was reformed from a centralized to a decentralized system in 1999. Decentralized education has been in keeping with district decentralization, which is enshrined in two laws:
one regulating regional decentralized government (Law 22/1999 on Regional Government) and one regulating fiscal decentralization (Law 25/1999 on the Fiscal Balance between the Central Government and the Regions). These regulations give district government greater responsibility in managing teachers and schools while the central government retains the responsibility for national policy formulation, curriculum and overall quality assurance. The fiscal framework gives greater autonomy to district authorities in managing basic education expenditures in their jurisdictions. By involving district governments in service delivery, educational decentralization should enable district governments to improve educational access, quality and equity.
Decentralization also transfers abundant fiscal resources from central to local governments. This A R T IC L E IN F O R M A T IO N A B S T R A C T
Article history:
Received 1 January 2017 Accepted: 25 March 2017
Available online: 1 September 2017
The consequences of fiscal decentralization on basic education outcomes are always debatable. Yet, its consequences on student dropout rates remain questionable. In this paper, we examine why fiscal decentralization in Indonesia has not effectively reduced student dropout. Mixed method analyses combining the Indonesian National Socioeconomic Survey (Susenas) 2002-2014 and two case studies in the districts of Sleman and Yogyakarta are used to explore the reasons for which fiscal decentralization has not reduced student dropout in Indonesia. Instead of reducing student dropout, we found that fiscal decentralization increases the risk of student dropout at the elementary school, transitional and junior secondary school levels. We found lack of fiscal capacity, inefficiency of educational budget allocation, and technical inefficiency in program implementation to be the main challenges that prevent district governments from effectively reducing student dropout.
2017 FIA UB. All rights reserved.
Keywords: fiscal decentralization, student dropout, mixed method, Indonesia
12 commitment is guaranteed in the 2002 constitutional amendment obliging all decentralized district governments to allocate at least 20% of annual expenditures to education (Suryadarma and Jones, 2013). The resultant Law No. 20/2003 on the National Education System is seen as one of the strongest commitments to education by any country (Nuh, 2013). From 2011 to 2015, educational spending in Indonesia increased 65.3%, from IDR 266.9 trillion to IDR 408.5 trillion (MoF, 2016). Total education spending in 2015 alone rose 20.6%. Moreover, total education spending at the subnational level rose from 59.6% in 2011 to 62.2% in 2015, account for IDR 159 trillion and IDR 254.2 trillion respectively (Ministry of Finance, 2016). This enormous investment is expected to improve both enrollment and student dropout rates.
This study addresses the limitations of prior studies in a number of ways. First, it focuses on student dropout as an outcome of fiscal decentralization in Indonesia at the beginning of decentralization (2002) and after almost one-and-a-half decades of decentralization (2014). Second, based on a national representative sample, we examine the linkage between fiscal decentralization and student dropout rates at the elementary school, transitional, and junior secondary levels. Third, this study combines the results of national survey data (Susenas 2002 and 2014) and case studies on fiscal decentralization and student dropout in two districts in the province of Yogyakarta. With its use of mixed methods, this study also explores why fiscal decentralization has failed to reduce student dropout in both districts. Fourth, this study uses multilevel regression to account for unobserved heterogeneity of the effect of fiscal decentralization on student dropout rates. This analysis is also able to account for other supply and demand factors of student dropout at the district and individual levels. Thus, the results are more robust than those of prior studies based on ordinary least squares.
2.Theory
Several studies on fiscal decentralization and education outcomes have shown the benefits of decentralization on basic educational outcomes. Faguet and Sanches (2008) demonstrated that school enrollment rose along with the share of total education expenditures in Columbian public schools and Argentinian secondary schools. Rajkumar and Swaroop (2008) found that increased public spending becomes effective in increasing primary education attainment in the presence of good governance. Behrman et al. (2002) measured the effect of fiscal decentralization on cohort survival in
the Philippines and concluded that local government shares in education have a significant and positive effect on primary school assessment scores and cohort survival. Aslam and Yilmaz (2011) also found that educational provisions increased dramatically after decentralization in Pakistan due to improvements in capital investments, school maintenance, and educational services.
However, other studies have contradicted these findings. Inchauste (2009) concluded that educational spending in Bolivia has no impact on educational outcomes due to the country’s inefficiency in allocating educational spending. Behrman et al. (2002) found local government educational spending to have a statistically insignificant effect on school assessment score, dropout rates, and enrollment in the Philippines’ public secondary schools. They also found that improved enrollment rates in public schools correlated to a decrease in the resources available on a per-student basis. In addition, increased enrollment outstripped the building of new schools. As a result, the nearly doubled number of students in public secondary schools led to overcrowding and worsening conditions. More than one-fourth of students failed to reach their final year of school
.
Although the studies provide interesting findings, the studies suffer from several limitations. First, most existing studies examining fiscal decentralization and education measure school enrollment or student test scores (Akai, Sakata, and Tanaka, 2007; Freinkman and Plenakanovs, 2009; Galiani et al., 2008; Diaz-Serrano and Meix-Llop, 2012). Second, research has focused on specific levels of education, whether only primary or only secondary (Akai, Sakata and Tanaka, 2007; Freinkman and Plenakanovs, 2009; Galiani et al., 2008; Diaz-Serrano and Meix-Llop, 2012). Third, most studies are based on either cross-country data or on particular province-level data (Treisman, 2002; Busemeyer, 2008). Fourth, even when studies have used district data as the unit of analysis, they have used the aggregate data and thus ignored the nested structure of educational outcome data. Fifth, most quantitative studies have used fixed-effect or ordinary least squares regression to analyze their data and are therefore unable to capture the nested structure of student dropout data (Aslam and Yilmaz, 2011; Busemeyer, 2008; Faguet and Sanchez, 2008)
3.Research Method
13 Socioeconomic Survey (Susenas 2002-2014) and official statistics were used to identify the relationship between fiscal decentralization and student dropout rates as well as other supply and demand factors at the district and individual levels that affect student dropout. Second, in order to enrich the findings from the survey data, two case studies were conducted in the districts of Sleman and Yogyakarta.
3.1.National Socioeconomic Survey (Susenas)
2002-2014 and official statistics
Susenas is a representative survey conducted by
Indonesia’s Central Bureau of Statistics. The survey has been fielded since 1993 to collect rich information regarding the socioeconomic status and public service access of individuals and households in all of Indonesia’s districts. Today, it covers 300,000
households or nearly 1.2 million individuals (BPS, 2015). The education section of the survey asks whether children have access to schools, whether they drop out, why they drop out, whether the poor benefit from appropriate governmental educational programs (i.e. a nine-year compulsory education program), and who is able to take advantage of government subsidies in education (Surbakti, 1995). Susenas also contains information about the sociodemographic characteristics of parents and households, including their income, education, and occupations. In addition, Susenas
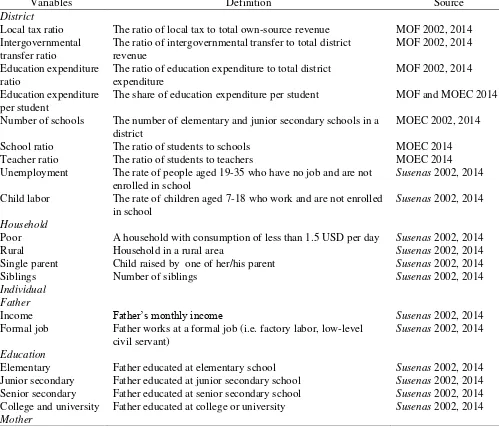
provides information regarding the unemployment and child labor rates in each district. We used Susenas 2002 and 2014 to capture the conditions of student dropout at the beginning of decentralization and after almost one-and-a-half decades of decentralization. Table 1 describes the detailed quantitative data used in this study.
Table 1. Variables, definitions and sources
Variables Definition Source
District
Local tax ratio The ratio of local tax to total own-source revenue MOF 2002, 2014 Intergovernmental
transfer ratio
The ratio of intergovernmental transfer to total district revenue
MOF 2002, 2014
Education expenditure ratio
The ratio of education expenditure to total district expenditure
MOF 2002, 2014
Education expenditure per student
The share of education expenditure per student MOF and MOEC 2014
Number of schools The number of elementary and junior secondary schools in a district
MOEC 2002, 2014
School ratio The ratio of students to schools MOEC 2014
Teacher ratio The ratio of students to teachers MOEC 2014
Unemployment The rate of people aged 19-35 who have no job and are not enrolled in school
Susenas 2002, 2014
Child labor The rate of children aged 7-18 who work and are not enrolled in school
Susenas 2002, 2014
Household
Poor A household with consumption of less than 1.5 USD per day Susenas 2002, 2014
Rural Household in a rural area Susenas 2002, 2014
Single parent Child raised by one of her/his parent Susenas 2002, 2014
Siblings Number of siblings Susenas 2002, 2014
Individual Father
Income Father’s monthly income Susenas 2002, 2014
Formal job Father works at a formal job (i.e. factory labor, low-level civil servant)
Susenas 2002, 2014
Education
Elementary Father educated at elementary school Susenas 2002, 2014
Junior secondary Father educated at junior secondary school Susenas 2002, 2014 Senior secondary Father educated at senior secondary school Susenas 2002, 2014 College and university Father educated at college or university Susenas 2002, 2014
14
Income Mother’s monthly income Susenas 2002, 2014
Formal job Mother works at formal job (i.e. factory labor, low civil servants)
Susenas 2002, 2014
Education
Elementary Mother educated at elementary school Susenas 2002, 2014
Junior secondary Mother educated at junior secondary school Susenas 2002, 2014 Senior secondary Mother educated at senior secondary school Susenas 2002, 2014 College and university Mother educated at college or university Susenas 2002, 2014
Children/students
Age Age of children Susenas 2002, 2014
Female A girl Susenas 2002, 2014
Subjective reasons for dropout
A dummy variable indicating reason for dropping out: cannot afford school costs, works to help parents, attained education is sufficient, shame at being poor and school is far.
Susenas 2014
Student dropout data and socioeconomic characteristics from Susenas were linked with official statistics. First, we linked student dropout data with district total own-source revenue, intergovernmental transfer, district education expenditure, and total district expenditure datasets from the Ministry of Finance 2002 and 2014. Second, in order to examine the effect of supply factors on student dropout, we linked it with district number of schools and with teacher and student datasets from the Ministry of Education and Culture 2002 and 2014.
3.2.Case studies
Case studies were conducted in Sleman and in Yogyakarta. Both districts are located in Yogyakarta Province, which is recognized as center of education in Indonesia. However, Sleman and Yogyakarta have contrasting conditions. While most of Sleman’s district areas are rural, most of Yogyakarta’s municipalities are urban. The purpose of these case studies was to discover how Sleman and Yogyakarta performed their roles following fiscal decentralization and to learn of the challenges they face in reducing student dropout. Interviews were conducted with the head of each district’s education agency and staff. Interviews were also conducted with eight dropouts and/or their parents to learn what caused them to leave school. Interviews were held from June to August 2016.
3.3.Mixed method analyses
Mixed method analyses were applied using the following steps. First, multilevel regression analyses were applied to analyze the Susenas datasets. These analyses were chosen to examine the linkage between fiscal decentralization and student dropout. The model
equation of multilevel regression analyses, considering a dropout student and family i nested in district j, is:
Eij* =ßo + Ʃ ßjWj + ßijXij + µj + ϵij
With: Eij* = logit (P (Eij* =1)), Wj as a set of district characteristics (e.g. fiscal decentralization, etc.), Xij as a set of dropout students and household characteristics (e.g. age, gender, etc.), µj as a random intercept varying over districts with mean zero and variance σµ2, and ϵij normally distributed with zero and variance σϵ2. Generalized Linear Latent and Mixed Models (GLLAMM) were used to estimate the models.
In the models, our dependent variable (Eij) is student dropout, which is measured by: (1) A dummy variable indicating elementary school dropout. Based on Indonesia’s educational system, an elementary school (SD) dropout is defined as a school-age child between 7 and 15 who once enrolled in elementary school (SD) but dropped out before finishing 6th grade or receiving an
elementary school certificate; (2) a dummy variable indicating transitional period dropout. Based on Indonesia’s educational system, a transitional period dropout is defined as a school-age child between 12 and 15 who graduated from elementary school but did not continue to junior secondary school; (3) a dummy variable indicating junior secondary school dropout. Based on Indonesia’s educational system, a junior secondary school (SMP) dropout is defined as a school-age child between 12 and 15 who graduated from elementary school (SD) but dropped out before finishing 9th grade or receiving a junior secondary school
certificate.
15 transfer to total district revenue, the ratio of district education expenditure to total district expenditure, and the ratio of overall educational expenditure to number of students.
We include the number of schools and the ratio of schools to teachers as supply factors at the district government level. District unemployment rates and child labor rates are included to capture demand side factors at the district government level (Liu, 2004; Peraita and Pastor, 2000). At the individual and household level, we include socioeconomic characteristics of dropouts and their parents.
Second, we elaborated the results of multilevel regression analyses with results from the case studies. This was done for two primary reasons: to elucidate the challenges faced by Sleman and Yogyakarta district governments in reducing student dropout and to explore the socioeconomic characteristics of dropouts and their parents.
4.Results and Discussion
4.1.Results
4 . 1 .1 . D escr ip tiv e sta tis tic s a n d mu ltileve l
lo g istic r eg res sio n resu lts
Table 2 shows the Susenas 2002 and 2014 datasets used in this study. Elementary school and transition dropouts decreased, but junior secondary school dropout increased substantially after one-and-a-half decades of decentralization.
The lack of capacity of most district governments to mobilize their resources is illustrated by the low fiscal ratio (mean of fiscal ratio at 0.33-0.34). Likewise, the lack of financial efficiency in most districts is illustrated by the high ratio of central government transfer to district revenue. The share of district education spending increased substantially, from 3% to 35% of total district expenditure. The average number of schools decreased over the twelve-year period studied.
Unemployment and child labor rates also decreased, but the rates remained relatively high. Household poverty increased by 1%. The number of children with single parent increased by 1-2%. The number of children receiving financial assistance decreased substantially, especially for transition-period students and junior secondary school students. Parents’ education improved over the twelve-year period, and mothers’ access to formal jobs increased. The main reason for student dropout was an inability to afford school costs.
Table 2. Descriptive statistics of sample
Variables
Mean DO from elementary
education DO transition
DO from junior secondary education
2002 2014 2002 2014 2002 2014
School dropouts 0.04 0.01 0.13 0.02 0.13 0.02
District Level
FD: ratio of local tax to own revenue 0.33 0.33 0.34 0.33 0.34 0.33
FD: ratio of transfer to district revenue 0.85 0.76 0.84 0.75 0.84 0.75
FD: ratio of education to district
expenditure 0.03 0.34 0.03 0.35 0.03 0.35
education expenditure per student (log) n.d 6.90 n.d 6.75 n.d 6.75
number of schools 535 340 649 439 649 439
ratio of student to school n.d 172 n.d 698 n.d 698
ratio of student to teacher n.d 14 n.d 33 n.d 33
unemployment rate 0.38 0.30 0.38 0.30 0.38 0.30
child labor rate 0.08 0.05 0.08 0.05 0.08 0.05
Household Level
live in rural area 0.63 0.60 0.54 0.58 0.54 0.58
being poor 0.05 0.15 0.04 0.13 0.04 0.13
being orphan 0.07 0.09 0.10 0.11 0.10 0.11
number of siblings 2 2 2 2 2 2
getting financial assistance 0.13 0.14 0.15 0.09 0.15 0.09
father's characteristics
income (log) 3.49 12.08 3.91 11.87 3.91 11.87
work at formal job 0.26 0.29 0.29 0.28 0.29 0.28
education
16
junior secondary 0.13 0.16 0.13 0.15 0.13 0.15
senior secondary 0.17 0.23 0.18 0.23 0.18 0.23
college and university 0.05 0.07 0.07 0.08 0.07 0.08
mother's characteristics
income (log) 1.11 6.2 1.44 6.44 1.44 6.44
work at formal job 0.09 0.13 0.11 0.13 0.11 0.13
education
elementary 0.36 0.31 0.36 0.32 0.36 0.32
junior secondary 0.13 0.17 0.13 0.17 0.13 0.17
senior secondary 0.13 0.19 0.14 0.19 0.14 0.19
college and university 0.03 0.07 0.04 0.07 0.04 0.07
Individual Level
child's age 10 11 14 14 14 14
female 0.48 0.48 0.51 0.49 0.51 0.49
reason for drop out
cannot afford school-cost n.d 0.0100 n.d 0.0100 n.d 0.0100
works to help parents n.d 0.0014 n.d 0.0026 n.d 0.0026
education is enough n.d 0.0006 n.d 0.0018 n.d 0.0018
shame of being poor n.d 0.0003 n.d 0.0004 n.d 0.0004
school is far n.d 0.0010 n.d 0.0020 n.d 0.0020
n district 310 497 310 497 310 497
n household 83,452 137,713 41,179 52,742 41,179 52,742
n individual 117,029 200,541 45,643 56,318 45,643 56,318
Source: Susenas 2002, Susenas 2014, and official statistics, n.d. means no data available
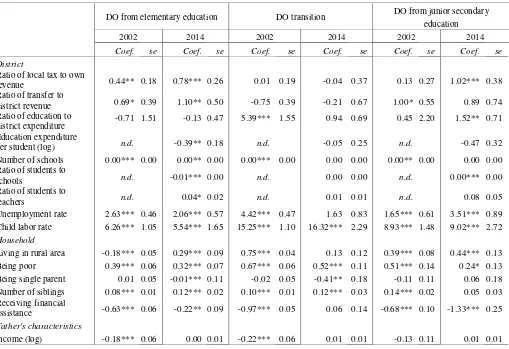
Table 3. Results of multilevel logistic regression
DO from elementary education DO transition DO from junior secondary
education
2002 2014 2002 2014 2002 2014
Coef. se Coef. se Coef. se Coef. se Coef. se Coef. se
District
Ratio of local tax to own
revenue 0.44** 0.18 0.78*** 0.26 0.01 0.19 -0.04 0.37 0.13 0.27 1.02*** 0.38
Ratio of transfer to
district revenue 0.69* 0.39 1.10** 0.50 -0.75 0.39 -0.21 0.67 1.00* 0.55 0.89 0.74
Ratio of education to
district expenditure -0.71 1.51 -0.13 0.47 5.39*** 1.55 0.94 0.69 0.45 2.20 1.52** 0.71
Education expenditure
per student (log) n.d. -0.39** 0.18 n.d. -0.05 0.25 n.d. -0.47 0.32
Number of schools 0.00*** 0.00 0.00** 0.00 0.00*** 0.00 0.00 0.00 0.00** 0.00 0.00 0.00
Ratio of students to
schools n.d. -0.01*** 0.00 n.d. 0.00 0.00 n.d. 0.00*** 0.00
Ratio of students to
teachers n.d. 0.04* 0.02 n.d. 0.01 0.01 n.d. 0.08 0.05
Unemployment rate 2.63*** 0.46 2.06*** 0.57 4.42*** 0.47 1.63 0.83 1.65*** 0.61 3.51*** 0.89
Child labor rate 6.26*** 1.05 5.54*** 1.65 15.25*** 1.10 16.32*** 2.29 8.93*** 1.48 9.02*** 2.72
Household
Living in rural area -0.18*** 0.05 0.29*** 0.09 0.75*** 0.04 0.13 0.12 0.39*** 0.08 0.44*** 0.13
Being poor 0.39*** 0.06 0.32*** 0.07 0.67*** 0.06 0.52*** 0.11 0.51*** 0.14 0.24* 0.13
Being single parent 0.01 0.05 -0.01*** 0.11 -0.02 0.05 -0.41** 0.18 -0.11 0.11 0.06 0.18
Number of siblings 0.08*** 0.01 0.12*** 0.02 0.10*** 0.01 0.12*** 0.03 0.14*** 0.02 0.05 0.03
Receiving financial
assistance -0.63*** 0.06 -0.22** 0.09 -0.97*** 0.05 0.06 0.14 -0.68*** 0.10 -1.33*** 0.25
Father's characteristics
17
Working at formal job 2.34*** 0.83 0.18** 0.09 2.62*** 0.79 -0.04 0.13 1.62 1.43 -0.03 0.14
Education:
Elementary -0.56*** 0.05 -0.28*** 0.08 -0.33*** 0.04 -0.12 0.11 -0.24*** 0.08 -0.22* 0.13
Junior secondary -0.76*** 0.08 -0.59*** 0.12 -1.15*** 0.07 -0.53*** 0.17 -0.57*** 0.12 -0.52*** 0.18
Senior secondary -0.93*** 0.10 -1.00*** 0.15 -1.58*** 0.10 -0.89*** 0.21 -0.82*** 0.15 -0.82*** 0.21
College and university -0.52*** 0.17 -1.74*** 0.39 -1.07*** 0.16 -1.02** 0.44 -1.26*** 0.31 -1.23*** 0.45
Mother's characteristics
Income (log) -0.18** 0.08 0.00 0.00 -0.22*** 0.08 -0.02** 0.01 -0.11 0.14 0.00 0.01
Working at formal job 2.21** 1.02 -0.10 0.13 3.01*** 0.92 0.13 0.18 1.32 1.79 0.21 0.19
Education:
Elementary -0.65*** 0.05 -0.62*** 0.07 -0.36*** 0.04 -0.10 0.11 -0.50*** 0.08 -0.33*** 0.12
Junior secondary -0.71*** 0.09 -0.96*** 0.12 -1.16*** 0.09 -0.65*** 0.18 -0.85*** 0.14 -0.81*** 0.19
Senior secondary -0.84*** 0.12 -1.28*** 0.17 -1.26*** 0.12 -1.21*** 0.25 -1.16*** 0.20 -1.00*** 0.22
College and university -0.62*** 0.23 -1.24*** 0.34 -0.68*** 0.20 -0.90 0.46 -0.67 0.37 -1.19*** 0.43
Children’s
characteristics
Child's age 0.52*** 0.01 0.25*** 0.01 0.18*** 0.02 -0.03 0.05 0.32*** 0.04 0.63*** 0.06
Female gender -0.25*** 0.03 -0.73*** 0.06 0.03 0.03 -0.31*** 0.09 -0.20*** 0.06 -0.64*** 0.10
Reason for dropping out
Cannot afford school
costs n.d. 3.56*** 0.08 n.d. 6.02*** 0.13 n.d. n.d.
Works to help parents n.d. 3.61*** 0.15 n.d. 6.22*** 0.24 n.d. n.d.
Attained education is
sufficient n.d. -18.49 7537 n.d. 5.74*** 0.27 n.d. n.d.
Shame at being poor n.d. 4.59*** 0.29 n.d. 5.06*** 0.46 n.d. n.d.
School is far n.d. 3.36*** 0.18 n.d. 5.73*** 0.26 n.d. n.d.
Variances
Individual 0.44*** 0.03 0.48*** 0.05 0.49*** 0.03 0.58*** 0.07 0.53*** 0.03 0.59*** 0.08
District 0.06*** 0.01 0.66*** 0.11 0.07*** 0.01 0.09*** 0.02 0.08*** 0.01 0.10*** 0.02
Log likelihood -13678 -5986 -14056 -2500 -4664 -2290
N districts 310 497 310 497 310 497
N households 83,452 137,713 41,179 52,742 35,875 44,626
N children 117,029 200,541 45,643 56,318 39,709 47,565
* p<0.10; ** p<0.05; *** p<0.01
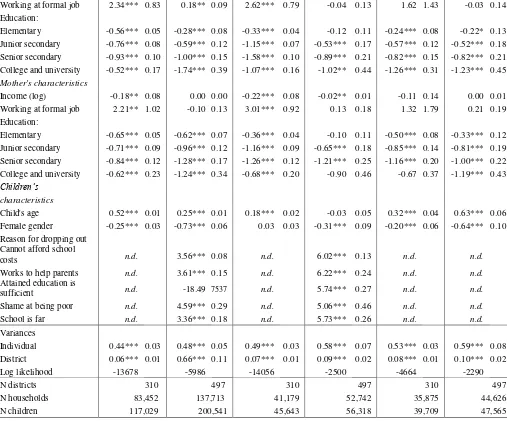
Table 3 presents the results of multilevel logistic regression. Most fiscal decentralization indicators show positive and insignificant associations with student dropout at all levels. District fiscal capacity increases student dropout at elementary and junior secondary schools. District fiscal capacity is not associated with dropout at transition. Likewise, district fiscal efficiency as measured by the ratio of intergovernmental transfer to district revenue increases dropout at elementary and junior secondary schools. This measure is also not associated with dropout at transition. Increasing the efficiency of education spending, as measured by a higher ratio of district education expenditure to overall district expenditure, is likely to increase dropout at junior secondary school and at the elementary to junior secondary school transition. Districts that spend more per student are able to reduce student dropout rates, but only at the elementary level. The insignificant association of number of schools and teachers shows
ineffectiveness of educational decentralization, as the main basic educational services transferred to local governments, to drop out.
Student dropout is strongly associated not with supply factors but with demand factors both at the district and individual family levels. We found higher district unemployment and child labor rates to increase the risk of student dropout. Having poor families, having more siblings and living in rural areas increase the risk of dropout. Scholarships help children stay in school.
18 younger children; female children are less likely leave school than male children. Inability to afford school costs, working to help parents, shame at being poor, and school distance are also associated with higher dropout risk at elementary schools and in the transitional period.
4 . 1 .2 . C a se stu d y resu lts
We found confirmation that fiscal decentralization has not been effective in reducing school dropout in Indonesia. Our findings were based on interviews with key informants and the study of official government documents at Sleman and Yogyakarta.
Inefficient budgeting
We found inefficiency in budget allocations in both districts. As seen in Table 4, the majority of district education expenditures went toward personnel, mainly civil service salaries (both personnel and teacher) and teacher allowances. Eighty-nine percent of total annual education expenditures in Sleman and 77% in Yogyakarta went to personnel.
The high proportion of personnel expenditures may appear in almost all district governments in Indonesia, given that teachers comprise the largest number of government officials. This means that routine expenditures in each district government dwarf the expenditures assigned to development projects
Table 4. Components of educational expenditure in Sleman and Yogyakarta (in millions of USD)
Year Sleman expenditure Yogyakarta expenditure
Personnel Project Total Personnel Project Total
2012 66,9 6,3 73,2 42,2 6,8 49,0
2013 57,1 6,2 63,3 33,9 9,3 43,1
2014 59,6 8,5 68,1 37,9 12,0 49,9
2015 58,7 7,3 66,0 37,1 13,1 50,2
2016 55,8 7,2 63,0 35,3 13,8 49,0
Mean 59.62 7.10 66.72 37.28 11.00 48.24
% 89% 11% 77% 23%
Sources: Sleman and Yogyakarta district educational agencies, 2016
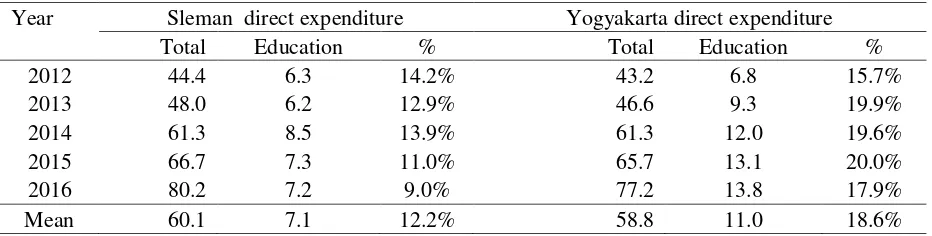
Priorities in budget allocation
Local officials have not always prioritized education in their allocations of budget. Although Indonesia’s constitution states that district governments should allocate at least 20% of annual budget to education, both Sleman and Yogyakarta spent less than this. Table 5 illustrates local government direct expenditures in both districts.
When education is not a priority for local officials, this is reflected in its budget allocation. Although Sleman enjoys relatively high revenues, an informant who works at Sleman’s local finance office explained that:
The regulation to allocate 20% of annual budget to the education sector has been fulfilled by the local government. The problem, then, is when local government has to match the allocation of its budget, not only to central government regulations, but also to the priorities of local leaders.
Although this qualitative data cannot be generalized for all district governments in Indonesia, it can begin to explain the positive association between fiscal decentralization, as measured by the ratio of local tax to total own revenue, and school dropout rates.
Table 5. Local government direct expenditures in Sleman and Yogyakarta (in millions of USD)
Year Sleman direct expenditure Yogyakarta direct expenditure
Total Education % Total Education %
2012 44.4 6.3 14.2% 43.2 6.8 15.7%
2013 48.0 6.2 12.9% 46.6 9.3 19.9%
2014 61.3 8.5 13.9% 61.3 12.0 19.6%
2015 66.7 7.3 11.0% 65.7 13.1 20.0%
2016 80.2 7.2 9.0% 77.2 13.8 17.9%
Mean 60.1 7.1 12.2% 58.8 11.0 18.6%
19
Projects mandated by central government
The central government requires district governments to carry out many specific educational projects. As a result, the remaining budget for local initiatives is tightened accordingly. As stated by an informant who works in the Sleman district education agency:
Authority delegation is a mandate based on law. It
means that we are still under regulation. […] We have a
special project to keep students from poor families in school by giving financial assistance at the senior secondary school level. We have not reached the lower levels of education because of the minimal budget.
Technical inefficiency in program implementation
Technical instructions and guidelines for implementing programs and projects are often published near year’s end, resulting in the delay of programs, reduced time to finish, and, often, considerably reduced budgets. Additionally, the central government may reduce budgets during the year. This necessitates changes in project execution and decreases revenues. As stated by an informant, an official in district education who works at the Sleman local finance office:
Local government has to be ready for things like this. Then we need to rearrange the new priorities and decide which programs to size down.
Central government regulations sometimes fail to fulfill local needs. As explained by an informant:
The central government, both the budget and the use, determines conditional grants in the education sector.
[…] Let the school itself decide its needs […] whether
the school needs to build a new classroom, or a library, or something else.
It is principally because of a lack of allocative efficiency that decentralization has been ineffective in reducing Sleman and Yogyakarta’s school dropout rates. Fiscal decentralization works only if district governments have budgets for development projects to improve educational accessibility and quality. Local officials must also create proper policies and execute projects that reflect citizens’ needs, particularly those of targeted groups such as students from poor families.
Other supply factors
The availability of adequate budgets, facilities, and adequate numbers of schools and teachers is expected to decrease student dropout. Based on our quantitative findings, this has not been the case. However, one strategic policy that does effectively reduce school dropout is providing financial assistance for students from poor families. We found such financial assistance to be effectively implemented in Yogyakarta but not in Sleman. Yogyakarta’s district government offers a special unit to assist students from poor families, even if their schools are outside Yogyakarta’s jurisdiction. This assistance covers not only school operational costs, but also students’ personal costs. It is also available to children who have dropped out and wish to return to formal or non-formal schooling, whether or not they come from poor families. As stated by an informant from Yogyakarta’s district education agency:
The children are motivated and guided to go back to
school […] and those retrieved children who are willing
to go to school are financially assisted even if they do not have KMS [an official card issued by Yogyakarta district government for poor families].
Confirming the finding that scholarships help to reduce school dropout rates, Table 6 presents data on educational performance in Sleman and Yogyakarta.
Table 6. Educational performance in Sleman and Yogyakarta
Indicators Sleman Yogyakarta
2011 2012 2013 2014 2015 2011 2012 2013 2014 2015
Elementary education
Dropout percentage 0.044 0.040 0.032 0.045 0.031 0.020 0.013 0.009 0.009 0.005
Dropout numbers 40 36 29 42 29 9 6 4 4 2
Number of students* 906 899 913 929 942 457 447 442 438 433
Student : school ratio 174 173 173 175 177 263 270 263 262 261
Student : teacher ratio 14 15 15 15 15 16 16 17 16 15
Student : classroom ratio 25 24 24 24 24 27 27 26 26 25
20
Gross enrollment (%) 116 117 115 117 117 153 149 146 148 146
Junior secondary
education
Dropout percentage 0.080 0.074 0.034 0.041 0.031 0.028 0.028 0.031 0.022 0.004
Dropout numbers 32 30 14 18 14 6 7 7 5 1
Number of students* 399 407 414 443 450 215 246 226 230 224
Student : school ratio 314 317 313 324 336 370 416 382 391 379
Student : teacher ratio 12 12 12 13 13 13 14 14 107 14
Student : classroom ratio 31 31 30 30 30 30 31 30 32 30
Net enrollment (%) 80 82 81 82 84 101 98 106 110 106
Gross enrollment (%) 114 114 109 111 112 131 136 147 148 147
Sources: Sleman and Yogyakarta official government documents, * Numbers in hundreds
The number of student dropouts in Yogyakarta is substantially lower than that in Sleman, although supply factors are more favorable in Sleman than in Yogyakarta. Sleman has offered scholarship assistance for poor students only at the senior secondary level, while Yogyakarta offers scholarship assistance for poor students and attempts to retrieve children who have dropped out at all educational levels. It is likely that the school dropout numbers in Yogyakarta government are smaller than in Sleman because of scholarship assistance.
Demand factors
Our quantitative findings have shown robust results indicating demand-side factors as the influencing factors in school dropout. In order to offer a more comprehensive explanation of those results, this article reports the qualitative findings gathered from interviewing members of eight families whose children dropped out of elementary or junior secondary school or did not continue to the junior secondary level.
Household factors
All eight children came from middle-income and poor families as indicated by the conditions of their homes, the equipment in their homes, and parental income.
The first family interviewed consisted of two parents and their son. The father was a construction laborer with no fixed income who had graduated from elementary school, while the mother was a housewife who had graduated from junior secondary school. In the following transcript describing the son’s reasons for leaving school, A represents the researcher, B1
represents the father, and B2 represents the mother.
B2: It is because of our financial problems.
B1: No, it is not. It is because our son did not perform well in school.
A : If later your son wants to return to school, are you willing to pay the school costs?
B1: Honestly, it is hard for us to pay. We only have a little money. Yes, I admit that I cannot afford to
pay. I asked my son: ‘Do you really want to
continue going to school or not, you get to have
an opinion, so that it will be useful for me to pay.’
However, my son has no clear answer.
The second interviewee, the father of a boy who did not continue to junior secondary school, was unemployed and had no educational background; his wife sold second-hand goods. The family home had no solid wall; rather, it was covered with cloth.
A : What is your son’s reason for not continuing to go
to school?
B1 : He likes playing internet games. Actually, we can still afford to pay his school, but this child had often gone to play internet games during school
time. Therefore, I do not want to pay anymore.
In addition to poor conditions, parents’ educational backgrounds also appear to influence their children’s decisions to drop out of school. All parents, regardless of their own educational backgrounds, say that they want their children to complete at least a junior secondary education. The third interviewee, the father of a child who dropped out of junior secondary school, worked part-time at a sugar cane plantation and had graduated from junior secondary school. He stated:
I had persuaded my son to go back to school and finish junior secondary school, since he was in ninth grade and just needed a little more time to finish. However, my son insists on leaving school again. I actually want him to keep going to school.
The fourth interviewee was a mother working as a
“serabutan” or daily laborer with no fixed income; she
21 no job and no part in raising their three children. The mother stated:
As a parent, I have hope that all my children will have at least an elementary school certificate. So that when people ask what our educational background is, we can
answer. …I also want them to graduate and have a
school certificate to apply for jobs in factories.
It is likely that children whose parents have weak classmates are, tend to drop out due to shame. The fifth interviewee was a mother worked alongside her husband as a construction laborer. Neither parent had any educational background. They had four children, of which the son in question was the third. He was in the same grade as his younger sister before dropping out.
B1 : About three months ago, he suddenly told me,
B1 : Construction labor with his father.
A (to the child): Where did you get the money to buy
B2 : [drooping his head and smiling a little]
A : As his parent, do you prefer that he stay in school or work?
B1 : I actually want him to finish school. If he graduated from junior secondary education, then it would be his decision to work or to continue to high school. The important thing is that he get the school certificate. That is what I hope.
A : What is his brother’s education?
B : He graduated from elementary school, and works in building construction.
This boy seems to have had several reasons for dropping out. Among them was that his older brother had graduated only from elementary school. Children tend to imitate the choices of their family members and peers.
The sixth interviewee dropped out of seventh grade in the middle of year after her family moved to a hilly, remote area. Her father worked as a building construction laborer, while her mother worked as housekeeper in town. Her headmaster said that she scored very high on tests, but that she only wanted to go to school when there was a test and finally dropped out.
A : Why are you lazy about going to school? Are you bored because the school day is long?
B2 : Yes. adequate numbers of teachers do not consistently reduce student dropout. Teacher competency is also important in the learning process.
4.2.Discussion
By comparing conditions in 2002 and 2014, this study examines the relationship between fiscal decentralization and student dropout rates in Indonesia. We found that fiscal decentralization, rather than reducing student dropout from elementary and junior secondary school, has increased it. Fiscal decentralization is not associated with school dropout in the transitional period between elementary and junior secondary school.
22 officials have not always prioritized the education sector in allocating their budgets.
Other main findings also point to the inefficiency of public education spending allocation. Adequate numbers of schools have decreased student dropout only at the elementary level. The case study findings confirm this evidence. In both Sleman and Yogyakarta, the number of schools and teachers have no association with student dropout rates. Rather, scholarship assistance significantly reduces student dropout.
Most demand-side factors are significantly associated with school dropouts, as confirmed by the results of multilevel regression and case studies. Poverty appears to weaken the demand for schooling, not only because it affects the ability of households to pay school fees, but also because it is associated with a high opportunity cost. As children grow older, the opportunity cost of education becomes even larger, hence increasing the pressure for children to earn income for their households. These findings highlight prior studies that explore the reasons of students to drop out both in developed and developing countries. For example, studies on school dropout rates in rural areas of Spain and China indicate that labor market conditions, poor socioeconomic status, residence in rural areas, and large family size are the determinant factors in primary school dropout behavior (Liu, 2004; Pearita and Pastor, 2000). Parents’ human capital is also strongly associated with their children’s chances of staying in school. Regardless of parental educational backgrounds, it is important for parents, especially fathers, to support their children’s education.
Children with many siblings are at increased risk of dropping out of school, likely because of poverty. Children who are older than their classmates are tend to drop out due to feelings of shame. Studies on school dropout in Malawi, India, and China also confirm that the likelihood of student dropout increases with age (Jukes et al., 2014; Yi et al., 2012). Boys are more likely to drop out than girls are. Low motivation to study, particularly common among male students, causes poor academic performance, which, in turn, leads to the need to repeat grades. Students held back more than once are considerably older than their classmates are and may drop out because of shame. Older children also wish to support their own personal needs but are unable to think of their long-term futures. They may then drop out and become unskilled laborers in order to earn quick cash.
This study has a number of limitations that should be addressed in future research. First, with cross-sectional data we see the results as associations. The causal effect of fiscal decentralization and school
dropout is something which future research, using available panel data, should seek to establish. Second, this study explores the conditions of fiscal decentralization in Indonesia only at its beginning and after one-and-a-half decades without providing information about the intervening years. Future studies may use time series data to capture fiscal decentralization and student dropout in all years or to compare results before and after decentralization. Third, fiscal decentralization and school dropout in Indonesia’s basic education system is only one measure of the relationship between decentralization and educational outcomes. Future studies may also question the effect of all three aspects of decentralization on, for instance, children not attending school at all educational levels.
Despite these limitations, this study presents a number of implications for both the educational outcome and the decentralization literature as well as for the practice of decentralization in terms of development. School dropout rates are truly dominated by demand-side factors, but government behaviors are part of these demand-side factors. Government responsibility and responsiveness to local needs, especially targeting poor households, is essential. From an empirical perspective, this study therefore suggests that it is crucial to consider the mechanism of fiscal decentralization in Indonesia’s educational sector. Second, our findings support the hypothesis that fiscal decentralization can undermine efficiency when local government officials fail to provide for citizens’ basic needs (Bardhan, 2002; Prud’homme, 1998; Tanzi, 1999). Additionally, fiscal decentralization can increase disparities because of district officials’ incapacity in managing financial resources, particularly in poorer areas (Oates, 2005). Our findings also suggest that, in order to effectively reduce school dropout, district governments must improve their efficiency in allocating educational expenditures through implementing strategic policies that directly purposed to help poor children.
5.Conclusion
23 local officials have not always prioritized the education sector in allocating their budgets.
References
Akai, N., Sakata, M., & Tanaka, R. (2007). Financial Decentralization and Educational Performance: Evidence from State-level Panel Data for the United States. Program on Housing and Urban Policy. Institute of Business and Economic Research: Berkeley.
Aslam, G., & Yilmaz, S. (2011). Impact of Decentralization Reforms in Pakistan on Service Delivery-An Empirical Study. Public
Administration and Development, 31,159-171.
Bardhan, P. (2002). Decentralization of Governance and Development. Journal of Economic Perspective. 16 (4),185-205.
Behrman, JR., Deolalikar, AB., & Soon, LY. (2002).
Promoting Effective School Through Education Decentralization in Bangladesh, Indonesia, and
Phillippines. Asian Development Bank: Manila.
BPS. (2015). Indonesia - Survei Sosial Ekonomi
Nasional 2014 [Indonesia's national
Socio-Economic Survey]. Indonesia's Central Bureau of
Statistics: Jakarta.
Busemeyer, MR. (2008). The Impact of Fiscal Decentralisation on Education and Other Types of Spending. Swiss Political Science Review. 14 (3), 451-481.
Diaz-Serrano, L. & Meix-Llop, E. (2012). Do Fiscal and Political Decentralization Raise Students' Performance? A Cross-Country Analysis. IZA
Discussion Paper Number 7622, 1-26.
Faguet, JP., & Sanchez, F. (2008). Decentralization's Effects on Educational Outcomes in Bolivia and Colombia. World Development. 36 (7), 1294-1316. Freinkman, L., & Plekhanov, A. (2009). Fiscal
Decentralization in Rentier Regions: Evidence from Russia. World Development.37(2), 503-512. Galiani, S., Gertler, P., & Schargrodsky, E. (2008).
School Decentralization: Helping the Good Get Better, but Leaving the Poor Behind. Journal of
Public Economics. 92(1011), 2106-2120.
Inchauste, G. (2009). Decentralization in Bolivia: Has It Made a Difference? in Ahmad and Brosio, Does Decentralization Enhance Service Delivery and
Poverty Reduction? Edwar Elgar: Glos.
Jukes, M., Jere, CM., & Pridmore, P. (2014). Evaluating the provision of flexible learning for children at risk of primary school dropout in Malawi. International
Journal of Educational Development. 191-202.
Liu, F. (2004). Basic Education in China's Rural Areas: A Legal Obligation or an Individual Choice?.
International Journal of Educational Development.
24, 5-21.
MoEC. (2015a). APK/APM PAUD, SD, SMP, dan SMK 2014/2015 (GER/NER All Levels of Schools
2014/2015). Indonesia's Ministry of Education and
Culture: Jakarta.
MoEC. (2015b). Ikhtisar Data Pendidikan dan Kebudayaan Tahun 2014/2015 [Statistics of
Education and Culture 2014/2015]. Indonesia's
Ministry of Education and Culture: Jakarta.
MoF. 2016. Anggaran Pendidikan (Education
Expenditures). Cited on April 6, 2016, from the
Ministry of Finance website:
http://www.anggaran.depkeu.go.id/dja/athumbs/apb n/PENDIDIKAN1.pdf
Nuh, M. (2013). Indonesia's Education Reformation.
The Indonesian Journal of Leadership, Policy and
World Affairs: Strategic Review. 3, 22-30.
Oates, WE. (1999). An Essay on Fiscal Federalism.
Journal of Economic Literature. 37 (3), 1120-1149.
Oates, W. 2005. Toward A Second Generation Theory of Fiscal Federalism. International Tax and Public
Finance. 12, 349-373.
Peraita, C., & Pastor, M. (2000). The Primary School Dropout in Spain: The Influence of Family Background and Labor Market Conditions.
Education Economics. 8 (2), 157.
Prud'homme, R. (1995). The Dangers of Decentralization. The World Bank Research
Observer. 10(2), 201-220.
Rajkumar, AS., & Swaroop, V. (2008). Public Spending and Outcomes: Does Governance Matter? Journal
of Development Economics. 86, 96-111.
Snijders, T., & Bosker, R. (1999). Analysis: An Introduction to Basic and Advanced Multilevel
Modelling. SAGE: London.
Sujarwoto, S., & Tampubolon, G. (2015). Decentralisation and citizen happiness: A multilevel
analysis of self-rated happiness in
Indonesia. Journal of Happiness studies, 16(2), 455-475.
Sujarwoto, S. (2012). Political decentralization and local public services performance in Indonesia. Journal of Public Administration and Governance, 2(3), 55-84. Sujarwoto. S. (2016). Does Democracy Make You Happy? Multilevel Analysis of Self-rated Happiness in Indonesia. Jurnal Studi Pemerintahan: Journal of Government and Politics, 7(1).
24
2010–2012. Telecommunications Policy, 40(7), 602-616.
Surbakti, P. (1995). Indonesia's National Socio-Economic Survey: A Continual Data Source For
Analysis on Welfare Development. Central Bureau
of Statistics: Jakarta.
Suryadarma, D., Jones, GW. 2013. Meeting the Education Challenge. in Education in Indonesia, edited by Suryadarma, D and Jones, GW. ISEAS: Singapore.
Tanzi, V. (1996). Fiscal Federalism and Decentralization: A Review of Some Efficiency and Macroeconomic Aspects. Annual World Bank
Conference on Development Economics 1995.
Treisman, D. (2002). Decentralization and the Quality of Government. Unpublished. 1-47.
UNESCO. (2010). School Dropout: Patterns, Causes, Changes and Policies. Education for All Global
Monitoring Report Background Paper No.
2011/ED/EFA/MRT/PI/08: 1-24.
Yi, H., Zhang, L., Luo, R., Shi, Y., Mo, D., Chen, X., Brinton, C & Rozelle, S. (2012). Dropping Out: Why Are Students Leaving Junior High in China's Poor Rural Areas? International Journal