IMPLEMENTATION OF IMAGE FUSION METHOD FOR
WATERMARK ON COLOR IMAGE USING WAVELET
TRANSFORMATION DOMAIN
Agung Mulyo Widodo
Computer Science Esa Unggul UniversityJl. Arjuna Utara No.9,Kebon Jeruk Jakarta Barat 11510
62-0215674223
[email protected]
Budi Tjahjono
Computer Science Esa Unggul University Jl. Arjuna Utara No.9,Kebon Jeruk
Jakarta Barat 11510 62-0215674223
[email protected]
ABSTRACT
Along with the development of computer technology, digital data especially data in the form of digital images, which caused new problems that was copyright issues was used. to show the originality of the creator's creativity in his work. In order to protect these rights, researchers applied watermarking on digital color images using wavelet transforms. This transformation could divide the image into multiple sub-domains by using low filters and high filters. Part of the low frequency image represented the fine part of the image while the high frequency part.
accommodate edge information and image textures. By
manipulating the image wavelet coofisien to hide the watermark allows it to be used as a labeling of the copyright of a digital image. This research used 24-bit BMP format image with 128x128 dimension for each parent image and watermark image which used discrete wavelet transform one level from daubechies family to generate watermarked image. The watermarking test consisted of two parts: the visibility test which required that the watermarked image should be slightly changed from its parent image. The equation called similarity was used to know quality of watermarked. The second test was a resistance test that used SNR (Signal to Noise Ratio) which was usually used to assess the noise in the signal but in this research will be used to assess the freshness of the image. According to the similarity test and SNR to the watermarked resistance image of JPEG compression, cropping image and grayscale for the invisible and visible watermarking can be concluded that the watermarking technique in this research is resistant to JPEG Compression, cropping image and grayscale covertion.
CCS Concept
•Mathematics of computing ~ Mathematical analysis ~ Numerical analysis ~ Computation of transforms
Keywords
Watermarking ; parent image; watermark image; watermarked image; wavelet discrete transformation ; visibility test ; resistance test.
ACM Refference
Permission to make digital or hard copies of all or part of this work for personal or classroom use is granted without fee provided that copies are not made or distributed for profit or commercial advantage and that copies bear this notice and the full
citation on the first page. Copyrights for components of this work owned by others than ACM must be honored. Abstracting with credit is permitted. To copy otherwise, or republish, to post on servers or to redistribute to lists, requires prior specific permission and/or a fee. Request permissions from [email protected].
CSAI 2017,December 5–7, 2017, Jakarta, Indonesia © 2017 Association for Computing Machinery. ACM ISBN 978-1-4503-5392-2/17/12…$15.00
https://doi.org/10.1145/3168390.3168438
1. INTRODUCTION
Some of the ways that have been done to overcome copyright in digital images and other digital data is header marking, which is to provide copyright information in the header of digital image data but someone with expertise in processing methods, image data marks or other digital data. can be lost. Encryption, encoding digital data into a representation using a secret key, but the data dissemination is not guaranteed. Recently, some researches use steganography which is the art and science of hiding sensitive information in ways that prevent detection. Different image steganography technique exists which are classified into spatial domain and transform domain steganography. In spatial domain scheme, the secret information is directly embedded. Its high capability of hiding and easy retrieval makes it to be used frequently. An example is the least significant bit algorithm (LSB). [1]. Transform domain scheme is used for hiding a large amount of data. It hides information in frequency domain by altering magnitude of all transforms of cover image. Discrete Cosine Transform (DCT), Discrete Fourier Transform, and Wavelet Transform are the main types of transforms used in steganography. These transforms all have coefficients associated with them. The secret data is hidden within these coefficients which also defines how the image or file should be transformed. Robustness refers to how well a steganography technique can resist the extraction of hidden data. It measures the ability of the steganography technique to survive the attempts of removing the hidden information. Such attempts include, image manipulation (like cropping or rotating), data compression and image filtering [2].
impairing the data. Watermarking for digital images consist of visible watermarks and invisible ones. The first ones are used to mark, obviously in a clearly detectable way, a digital image in order to give a general idea of what it looks like while preventing any commercial use of that particular image. Converselly, invisible watermarks are used for content and/or author identification [3].
A method called the simplest of watermarking is to use the LSB method that inserts the data label into the image bit but the resulting watermark image is not resistant to compression, cropping or other image processing [4-5]. Applying of DCT technique to embed the watermark. With the help of DCT technique we can insert the data in short variation of time. A digital watermark is an invisible mark embedded in digital image which may be used for Copyright Protection [6]. It has been done using a watermarking algorithm combination of the Discrete Wavelet Transform (DWT) and the Discrete Cosine Transform (DCT) watermarking on digital image. Performance evaluation results show that combining the two transforms improved the performance of the watermarking algorithms that are based solely on the DWT transform [7]. But this methods has been never implemented on color image. Besides it has also been done implementation a robust image watermarking technique for the copyright protection based on 3-level discrete wavelet transform (DWT). In this technique a multi-bit watermark is embedded into the low frequency sub-band of a cover image by using alpha blending technique. The insertion and extraction of the watermark in the grayscale cover image was be claimed simpler than other transform technique [8]. But this methods hasn’t been
implemented on color image too. The use of transformations such as RSPPMC (Randomly Sequenced Pulse Position Modulated) watermarking [9]. In the article divide the image into 8 x 8 blocks and then DCT converts and modifies the DCT coefficients to insert the watermark. First producing a watermark image that is more resistant (robust) to JPEG compression, but less when given noise or cropping done. Currently the latest development of watermarking technology is introduced a novel image steganography system, which embeds (RGB) secret image within (RGB) cover image chosen by an enhanced resilient back propagation neural network. The performance has been evaluated during embedding and extraction stages considering using several cover and secret images and considering several sizes. Experiments show that Peak of SNR is improved efficiently [10]. But this method has not been tested robustness it to image processing.
For this purpose, researchers apply a digital image watermarking by using a wavelet transform that can be divided into sub-domains by using low filters and high filters, where parts of low-frequency images represent the fine parts of the image and the high-frequency section represents the edge information and image texture [11]. By manipulating the wavelet image coefficients it can be used to hide the watermark making it possible to be used as a digital image copyright label. Using watermarking with wavelet transforms is expected to generate watermarked images that are labeled resistant (robust) and see-through will be recognized, although the watermark image undergoes image processing such as JPEG compression, cropping, and grayscale conversion.
2. WATERMARKING
One way to protect intellectual property rights over multimedia products (images / photos, audio, text, video) is to insert information into the multimedia data with digital watermarking techniques[11].
The information embedded into multimedia data is called a watermark, and can be considered as a digital signature or a digital stamp from the legitimate owner of the multimedia product. Giving signatures with watermarking techniques is done so that the inserted information does not damage the protected digital data. Watermarks in digital data can not be detected by people who do not know the secret of the watermark insertion scheme, and also the watermarks can not be identified and removed. Watermarks can be used as proof of ownership to help digital publishers protect copyrighted material. If anybody else claims that the digital product it acquires is owned, then the copyright holder of the multimedia work may deny the claim by the verification process. The trick, the watermark is extracted from the disputed digital product. The extracted watermark is compared to the copyright owner's watermark. If the same, it is indeed the copyright holder of multimedia products.
Basically, watermarking technique is the process of adding identification code permanently into digital data. The identification code can be text, image, sound, or video. In addition to not damaging the digital data of the product to be protected, the inserted code should have robustness of various advanced processing such as alteration, geometry transformation, compression, encryption, and so on. The robustness property means the watermark data is not damaged by the advanced processing.
Watermarking can also be categorized as visible watermarking (watermarks visible to the human senses) and invisible watermarking (invisible watermarks). Watermarking can also be categorized as blind watermarking and non blind watermarking process. In addition to the purposes of copyright labeling (copyright labeling), watermarking is also used for other purposes as follows [11]:
• Tamper-proofing.
Watermarking is used as a tool to identify or show that digital data has changed from the original.
• Feature location.
Watermarking is used to identify the contents of the digital data at certain locations.
• Annotation / caption.
Watermarking is used only as a description of the digital data itself.
2.1 Wavelet Transform
Wavelet transform (WT) is an alternative approach that allows analyzing multiple signals. WT analyzes signals at different frequencies with different resolutions. WT is made to provide the best time resolution and small frequency resolution at high frequency and best frequency resolution and small time resolution at low frequency.
Continuous wavelet transform (Continuous Wavelet transform (CWT) is defined as follows [12]:
C (a, b) =∫ ( ) , ( ) (1)
Where t is time f (t) and frequency in time domain, whereas
, ( ) = (2)
these conditions state that this function oscillates. The parent equation implies that the functions with different support sections used in the transformation process are derived from a single parent function. In other words the parent wavelet is a prototype for processing other parent functions. The translational equation is used on the same sensing, has been used in STFT associated with the parent location (window), as the parent (window) is shifted for all signals. This equation corresponds to the time information on the transform domain. However, we have no frequency parameters, such as those belonging to STFT, although they have scales. Scaling as a mathematical operation, also dilated and compresses the signal.
The smallest scale is related to signal dilatation and large scale is related to signal compression. But on the definition of the wavelet transform, the scaling equation is used in denominators and is therefore contrary to the initial statement adopted.
2.1.2
Discrete Wavelet Transformations
We recognize three kinds of wavelet analysis: Continuous, semidiscrete, and discrete. The difference between the three kinds of WT depends on the way in which scale and shear parameters are discredited [12]. Discrete Wavelet Transformation has the discrete function f(n) and the definition of discrete wavelet transform (DWT).
( , ) = ( , ) = ∑ ( ) , ( ) (3)
Where is the mother discrete wavelet defined as follows:
, ( ) = 2 (2 − ) (4)
Parametera,bisa=2j,b=2jk. Back transformation is defined in the same way.
( ) = ∑ ∑ ( , ) , ( ) (5)
Wavelets Daubechies are one of the existing orthogonal wavelets, and are commonly used for large amounts of discrete data because these wavelets have high zero mean and use multiresolution analysis in their operation. Wavelet daubechies orthogonal D2 up to 20 are generally used, and the number of index filters is equal to the number of coefficients. Each wavelet has the number of Zero moments equal to half the number of coefficients. Zero moment is the ability of wavelets to represent polynomial or information signals. Both the function of the scale (Low pass filter) and the wavelet function (High / band pass filter) used must be normalized to have an amount equal to 2 and the sum of squares equals 2. In some applications both must be renormalized
to have the number 2 , and all are shifted by coefficients with even indexes orthogonal to each other.
2.1.2
Signal Processing Using Quadrature
Mirror Filter (QMF)
The terminology of signal processing is Quadrature mirror filter. The relationship between g and h is bound by:
) andg (k)is known as a high pass or highband filter. Filters are a family of Finite Impulse Response (FIR). Here is the relationship given by the use of the fourier transformation and the lowpass filter with anh (n)impulse renewal. Filter filtering relates to mathematical operations of signal convolution with impulse
filter response. The lowpas filter eliminates all frequencies above the high frequency of the signal.
The high frequency component present in the signal is radian, if the signal is modeled at the nyquist rate, the nyquist rate corresponds to π rad/s at the discrete frequency domain. After passing the signal entirely to the lowpass filter, half the samples can be eliminated based on the nyquist rule, when the signal has a
high frequency of 2 π radians.
The DWT algorithm can be explained as follows:
• Selecting a filter coefficient QMF consists of a low pass filter (h) and a high pass filter (g)
g (n) = (-1) ^ n * h (L-n)
Where;n= filter index (n = 0,1,2, .., L) L= highest index of filter
• Image decomposition is done by using and filter and image reconstruction is done by using h and g filter
g (n) = (-n) h (n) = (-n)
• Transformation in two dimensions (image) is done by doing 2 times one-dimensional wavelet transformation that is one direction horizontal and one vertical direction. The trick is done convolution image data with filter coefficients
2.2 YUV Color Transformation
The YUV color model is a National Televition Systems Commitee (NTSC) color model that uses a special RGB color to display images on the screen. One of the main advantages of this format is that grayscale data is separated from color data, so the same data can be used for both color and black-and-white screens.
components form the chrominance or the relative percentage of the underlying color against the other principal. If is given triplet RGB (Ri, Gi, Bi) for pixel i, then the value of YUV for the corresponding pixel is calculated with the above equation
3. RESEARCH METHODS
The design stages of the wavelet transformation algorithm, the watermarking algorithm and the software design of the image object in this study are described below.
3.1 Image Modeling
grayscale and Y in YUV colors. In this research, the RGB image is transformed into YUV colors before has been done wavelet transforms and watermarking insertion for then returns it into RGB form when wavelet reverse transformation. Here is an RGB transformation to YUV and vice versa, use equation (8) and (9).
3.2 Wavelet Transformation Algorithm
The wavelet transformation has two stages: image decomposition and image reconstruction stage. In this study using wavelet daubechies transformation with 1 zero mean or 2 (two) low pass filter coefficients (h) on the parent image and using 1 zero mean or 2 (low) low pass filter coefficients (h) on wavelet transform of watermark image. The decomposition stage of the image luminance (Y) value is convoluted with hand g, which h is a reversal of the low pass coefficient (h) and g is a reversal of the high pass coefficient (g) in which the relationship between low
pass coefficient (h), high pass coefficient (g) , hand gare as follows:
g (n) = (-1) ^ n * h (L-n) (10)
Where;n= filter index (n = 0,1,2, ..,L) L= highest index of filter
g (n) = g (-n) (11)
h (n) = h (-n) (12)
After that the result data from the convolution is lowered into half the data (downsampling) by taking even index data in the x direction so that obtained the results of half the results of convolution h (L1) and data of convolution g (H1). After that
the data L1 and H1 are done convolution again with hand g
coefficients and are done downsampling in the y direction. The watermark image is transformed to 1 level i.e until L1L2, L1H2,
H1L2, H1H2 are obtained. Here are the procedures for
decomposing wavelets:
• The first step, to perform of data convolution with filter h and g.
• The second step, to do downsampling the result of convolution inxor horizontal direction
• The third step to do convolution of downsampling results with filter hand g.
• The fourth step, to do downsampling the result of convolution inyor vertical direction.
• The fifth step, performs steps 1 through to 4 for the next level decomposition in the low resolution section
In the reconstruction phase, the first thing to do is to process the upsampling in theydirection and fill the empty part with zero or average between two even index values. Then multiply the coefficients of low pass (h) and high pass (g) and sum up the convolution resultshandg. After that to do upsampling the result of sum to the x direction and multiplies it byhandg, then sums it up and produces the reconstruction image.
Here is the wavelet reconstruction procedure:
• The first steps, to do upsampling inydirection of data and it makes convolution with filter h and g
• The second step, to do sum of the results of both convolution • The third step, to do upsampling the sum data in x direction
above and convolution with filter h and g
• The fourth step, to do sum of the results of both convolution
• The fifth step, to repeat step 1 through to 4 for the next wavelet level
3.3 Design of Watermarking Algorithm.
Watermarking on wavelet domains is composed of two parts: encoding and decoding. After the parent image and watermark image are decomposed using wavelet transforms, the watermark low coefficient (Lw)of the watermark image is inputted into the
low parent coefficient (Li) using the following equation:
Lwi= Lw(1+ (α * Li)) (13)
Where: Li = Wavelet coefficient of the parent image
Lw= Wavelet coefficient of watermark image Lwi= Wavelet coefficient of the watermarked image
It is well known that the low-resolution part of the wavelet transform contains a lot of imagery information and the human eye is very sensitive to this part so the changes in this section will have an effect on image sensing. Therefore, the selection of small
α values is the key to manage the unseen watermarked image display. While wavelet coefficients of other watermark images included in the wavelet coefficients of other parent images, but with different algorithms as follows:
Lwi= Lw+ βLi (14)
Where: Li= Wave coefficient of the parent image
Lw= Wavelet coefficient of watermark image
Lwi= Wavelet coefficient of the watermarked image
In this research isselected large β valuesbecause the human eye can not sense changes in this section that contains texture and image edges, but very sensitive to noise so that by choosing a largeβvalue can strengthen or reinforce the watermarked image against the provision of noise.
While in the decoding stage uses the equation which is derived from the encoding equation is as follows. In the low-resolution part of the image:
Li= 1 / α((Lwi/ Lw) -1) (15)
In the rest of the resolution:
Li= 1 / β (Lwi-Lw) (16)
3.4 Designing Software
The software is built using Visual Basic programming language by utilizing the equations and algorithms that have been prepared above, consist of :
• To transform RGB to YUV
The process of transforming the color of the image to YUV begins by taking the RGB value on each pixel of the parent image and watermark and entering the value into equations (8) to convert to YUV then the result of the calculation is stored in the colory file. txt, coloru.txt, colorv.txt to be used for processing wavelet transformations as well as conversion back to RGB imagery.
• To transform YUV to RGB
• Image Decomposition
The image decomposition process in the wavelet transform begins to read the Y value of each pixel stored in the colory.txt file then which is convoluted with the filter
coefficients, h and g the next is done downsampling by simply displaying theyvalue on the even column and will generate the image with two subbands i.e subband low (L) and subband high (H). Then each down-sampling result is
done convolution again with h and g, then the result is done downsampling again but in a different way that only displays theYvalue on even rows so that it will generate four subbands i.e LL subband, LH subband, subband HL, and subbandHH. After that will be done watermark substitution process on each coefficient of wavelet parent image and watermark image. Then the substitution result coefficient will undergo a reconstruction process to form the watermarked image
• Image Reconstruction
Image reconstruction of the wavelet transformation is begun with is process upsample on subband LL, subband LH, subband HLand subband HH by increasing the number of rows and gives even row the same value to the data value of each subband and assigning subband LL, subband LH, subbandHL,HHsubband before downsampling processing on odd-line lines. Then the convolution is done with filter coefficients h and g, then the result is done upsampling processing again by increasing the number of data columns by giving even values of columns with data value of decomposition result and odd columns with subbandL and subband Hvalues before has been downsampling then the result is convoluted again with a filterhandg. After that the resulting Y value is combined with the U and V values in the coloru.txt and colorv.txt files to convert to RGB again and then shown to the canvas provided by the designed program and stored into the image with BMP extension.
• Watermark Substitution
After experiencing the process of image decomposition the next step is to substitute the watermark into the parent image using the equation substitution (13) and (14) is by using the
coefficient α on the lower subband section which is known as
the part that contains a lot of information and can be sensed
by the human eye, to determine the value of α small values
are taken and the equations with β coefficients for other subband sections are subband portions containing edge information and image textures.
• Watermark Separation
To get the watermark back from the watermarked image, watermark separation process is done. The watermarked image that has undergone the image decomposition process, each coefficient is included in equation (15), and equation (16), through the equation will be obtained wavelet watermark coefficient or called extraction coefficient which then reconstructed and converted to RGB to generate watermark again.
3.5 Software testing
The watermarked imagery test consists of two parts: the visibility test which requires that the watermarked image should be slightly altered from the parent image. To know the quality of the appearance of the watermarked image is usually used an equation called the similarity or similiaritas as follows:
∑∑
Lw= Wavelet coefficient of watermark image
*
W
L = Wavelet coefficient of extracted watermark image The above equation is used to know the average of pixel values of watermarked image of extraction result compared to original image watermark pixel values. The higher the value of similiarity the better the image quality of the extraction results.
The second test is a hardness test that will use SNR (Signal to Noise Ratio) which is usually used to assess the noise in a signal but in this research will be used to assess the freshness of an image and formulated as follows:
Where: SNR= Signal to Noise Ratio
Li= Wave coefficient of the parent image
Lwi= Wavelet coefficient of the watermarked image
The bigger the SNR value, the more tested the watermarked watermark image is an image containing ORIG writing which is the same size as the main image image that is 128 x 128.
(a) (b)
Figure 1. (a)Parent image of Baboon and ITS logo 128 x 128 (b) Watermarke image of ORIG 128x128
This is because the 24 bit bmp image has a large color combination and the RGB component already exists on each pixel not on the palette as in the 8 bit image making it easier to retrieve RGB image components. The use of the watermark image size is the same as the parent image because it allows for watermarking that follows the low-frequency subband size of the wavelet transforms performed.
4.1 RGB Color Transformation to YUV
4.2 Image Decomposition
Wavelet transformation used in this research is discrete wavelet transform with coefficient daubechies D2 which coefficient can be seen in table 1. The decomposition of the image is a one-level decomposition by converting the luminance value of the transformed image to YUV that is at the Y pixel value using
coefficients, h and g and do the downsampling or storing the coefficients on even columns and rows.
Table 1. Daubechies Coefficient D2 No Daubechies coefficient (h)
1 0,5
2 0,5
After experiencing the image decomposition, the wavelet watermark coefficient is subtituted to the wavelet coefficient of the parent image and reconstruction. Based on equations (10),(11)
and (12) then the value of, h,g,h and gcan be seen in table 2.
Table 2.h,g,h and gcoefficients
No h g h g
1 0,5 0,5 0,5 0,5
2 0,5 -0,5 0,5 -0,5
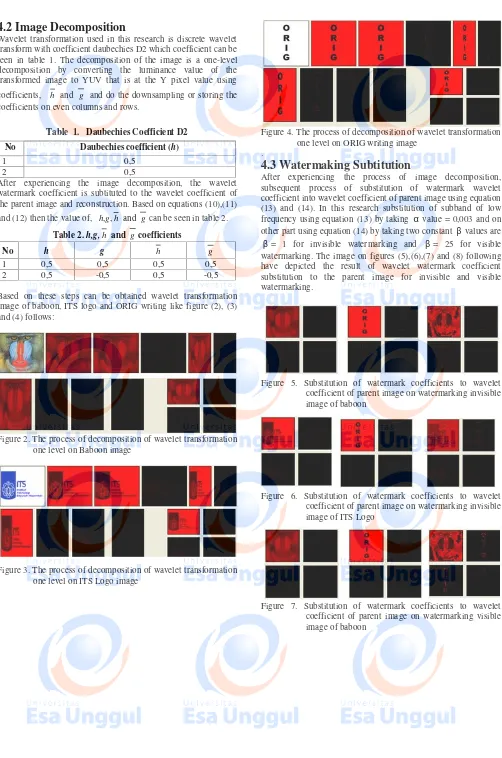
Based on these steps can be obtained wavelet transformation image of baboon, ITS logo and ORIG writing like figure (2), (3) and (4) follows:
Figure 2. The process of decomposition of wavelet transformation one level on Baboon image
Figure 3. The process of decomposition of wavelet transformation one level on ITS Logo image
Figure 4. The process of decomposition of wavelet transformation one level on ORIG writing image
.
4.3 Watermaking Subtitution
After experiencing the process of image decomposition, subsequent process of substitution of watermark wavelet coefficient into wavelet coefficient of parent image using equation (13) and (14). In this research substitution of subband of low frequency using equation (13) by taking αvalue = 0,003 and on other part using equation (14) by taking two constant βvalues are
β= 1 for invisible watermarking and β = 25 for visible watermarking. The image on figures (5),(6),(7) and (8) following have depicted the result of wavelet watermark coefficient substitution to the parent image for invisible and visible watermarking.
Figure 5. Substitution of watermark coefficients to wavelet coefficient of parent image on watermarking invisible image of baboon
Figure 6. Substitution of watermark coefficients to wavelet coefficient of parent image on watermarking invisible image of ITS Logo
Figure 8. Substitution of watermark coefficients to wavelet coefficient of parent image on watermarking visible image of ITS logo
4.4 Reconstruction of Wavelet Transformation
This stage of reconstruction consists of two stages: first step is upsampling processing, namely by increasing the number of columns and rows of the image and fill the column or even row with the value of the coefficient of substitution. Odd columns and rows are filled with initial coefficient values before downsampling processing. The second stage performs convolution processing of upsampling results with lowpass coefficients (h) and highpass (g). The coefficient valueshandgare shown in table 2. The following images on figures (9), (10), (11) and (12) have been the result of image reconstruction after the watermark substitution.Figure 9. Reconstruction of wavelet transformation on watermarking invisible image of baboon
Figure 10.Reconstruction of wavelet transformation on watermarking invisible image of ITS logo
Figure 11.Reconstruction of wavelet transformation on watermarking visible image of baboon
Figure 12.Reconstruction of wavelet transformation on watermarking visible image of ITS logo
4.5 YUV to RGB color transformation
YUV to RGB color transformation is done by taking the pixel value in the program picture as theYvalue and taking theUandV
values on theinduku.txt,parentv.txtfile for the parent image and
wateru.txt, waterv.txt and insert it in equations (9). Then the results are displayed on the picture or canvas program that has been created and stored in file.bmp. Figures (13) and (14) following have been the results of watermarking image transformation invisible and watermarking visible
Figure 13.YUV to RGB transformation results for invisible watermarking
Figure 14.YUV to RGB transformation results for visible watermarking
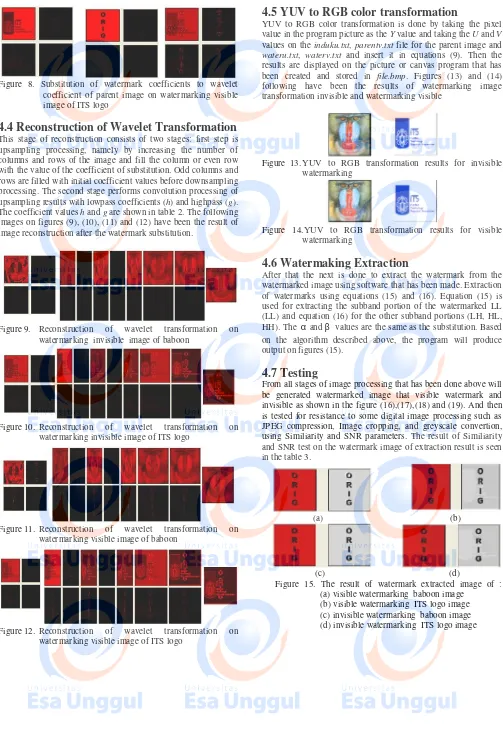
4.6 Watermaking Extraction
After that the next is done to extract the watermark from the watermarked image using software that has been made. Extraction of watermarks using equations (15) and (16). Equation (15) is used for extracting the subband portion of the watermarked LL (LL) and equation (16) for the other subband portions (LH, HL, HH). The αandβ values are the same as the substitution. Based on the algorithm described above, the program will produce output on figures (15).
4.7 Testing
From all stages of image processing that has been done above will be generated watermarked image that visible watermark and invisible as shown in the figure (16),(17),(18) and (19). And then is tested for resistance to some digital image processing such as JPEG compression, Image cropping, and greyscale convertion, using Similiarity and SNR parameters. The result of Similiarity and SNR test on the watermark image of extraction result is seen in the table3.
(a) (b)
(c) (d)
Figure 15. The result of watermark extracted image of : (a) visible watermarking baboon image
Figure 16. Watermarked image and watermark extracted for visible watermarking baboon image
Figure 17. Watermarked image and watermark extracted for watermarking of the invisible baboon image
Figure 18. Watermarked image and watermark extracted for visible watermarking ITS logo image
Figure 19. Watermarked image and watermark extracted for invisible watermarking ITS logo image
Table 3. Calculation of similiarity and SNR watermark image result of baboon and ITS logo image extraction Image Watermarking Similiarity SNR (dB)
Baboon Invisible 0.8054 6.9454
Visible 0.8081 6.9734
ITS logo Invisible 0.7682 6.2523
Visible 0.7684 6.2528
Testing of visibility and firmness is done by compressing up watermarked images up to 64:1, converting watermarked images to grayscale, and watermarked image cropping. The results of similiarity and SNR calculations, MSE watermark image of extraction results after the test are shown on table 4,5, 6,7,8 and 9. Mean of Signal Noise Ratio (SNR), and Similiarity (SIM) for JPEG Compression can be calculated with the following equation
M N
Mean=
∑
(19)Where: N = data of each element M = Amount of data
Table 4. The results of SNR Calculations, Similiarity After Testing for Invisible Watermarking Baboon Image.
Test SNR Similiarity
Compession 2:1 6,9579 0,8071
Compession 4:1 6,9769 0,8089
Compession 8:1 6,9853 0,8099
Compession 16:1 6,9896 0,8107
Compession 32:1 6,9899 0,8116
Compession 64:1 7,003 0,8122
Grayscale 5,9269 0,7487
Crooping 8,2434 0,8654
Table 5. The results of SNR Calculations, Similiarity After Testing for Visible Watermarking Baboon Image.
Test SNR Similiarity
Compession 2:1 6,9917 0,8103
Compession 4:1 7,0089 0,8121
Compession si 8:1 7,0152 0,8131
Compession 16:1 7,0181 0,8139
Compession 32:1 7,0299 0,8148
Compession 64:1 7,0390 0,8157
Grayscale 5,9269 0,7487
Crooping 8,2635 0,8671
Table 6. SNR calculation results, similarity After testing for Invisible watermarking ITS logo image
Test SNR Similiarity
Compession 2:1 6,3457 0,7738
Compession 4:1 6,4371 0,7793
Compession si 8:1 6,4919 0,7826
Compession 16:1 6,5322 0,7851
Compession 32:1 6,5673 0,7869
Compession 64:1 6,5952 0,7887
Grayscale 5,9269 0,7487
Crooping 6,5892 0,7867
Table 7. SNR Calculation Results, Similarity After Testing for Visible Watermarking ITS Logo Image
Test SNR Similiarity
Compession 2:1 6,4281 0,7791
Compession 4:1 6,4789 0,7822
Compession si 8:1 6,5187 0,7846
Compession 16:1 6,5527 0,7865
Compession 32:1 6,5804 0,7881
Compession 64:1 6,6083 0,7897
Grayscale 5,9269 0,7489
Crooping 6,5905 0,7869
Table 8. Mean of SNR, Similarity (SIM) Calculation of JPEG Compression Test Image of Baboon Image
Invisible watermarking
Visible watermarking
Mean of SNR (dB) 6,9837 7,0171
Mean of SIM 0,8101 0,8148
Table 9. Mean of SNR, Similarity (SIM) Calculation of JPEG Compression Test Image of ITS Logo Image
Invisible watermarking
Visible watermarking
Mean of SNR (dB) 6,4949 6,5159
Mean of SIM 0,7827 0,7850
is compressed using the wavelet transform of each value (Y) pixel to rise, where it is known that the high pixel value tends to declare the white color so that when the resulting watermark extraction process becomes lighter and the pixel values are close to the values of the pixels, the original pixel watermark value. SNR parameter states how big the effect of noise on watermark image extraction results. The higher the value the better the watermark the extraction results, based on the pixel value owned by the image. In the compression test it can be seen that the SNR value is increasing when the watermarked image is compressed with the average SNR of 6.9837 dB for the watermarking of the invisible baboon image, the average SNR of 6.4949 dB for the watermarking of the invisible image of the ITS logo and the average SNR 7, 0171 dB, 6,5159 dB for watermarking visible baboon image and ITS logo image. This shows that the noise in the image will decrease when compressed caused by the increase of Y value as described above. In the grayscale conversion test obtained SIM value 0.7487, SNR 5.9269 dB for watermarking visible and invisible image baboon, and SIM value 0.7489, SNR 5.9269 dB for watermarking visible and invisible image of ITS logo. Both are of equal value, due to the grayscale process being the average of the RGB value of each image pixel, but most importantly the watermark of the extraction can still be humanized so it can be used for labeling. In the image cropping test SNR 8.2434 dB, SIM 0,8654 for watermarking invisible image of baboon and SNR 8,2635 dB, SIM 0,8671 for watermarking visible image baboon, SNR 6,5892 dB, SIM 0,7867 for watermarking invisible image of ITS logo and SNR 6,5905 dB, SIM 0,7869 for watermarking visible ITS logo image. The values obtained on cropping test is better because in the cropping process there is only reduction of number and pixel value, no change of pixel value in image watermark so that at extraction pixel value only change because wavelet transform only.
5. CONCLUSION
This research implements watermarking with wavelet transformation as digital label labeling which allows the watermark level to be adjustable and watermarked extracts can be human-sensed after testing the robustness of Compressy JPEG, crooping and grayscale image. Based on the results of the test it can be concluded that the implementation of watermarking techniques used for labeling 128 x 128 different images successively resistant to cutting (cropping), JPEG compression, Grayscale covertion. As a suggestion for further research is the creation of watermarking algorithm with other domains so that it can be used as a comparison of watermarking techniques in this study and the use of two-tier wavelet transformation to improve watermark image resistance.
6.
ACKNOWLEDGMENTS
Our thanks to my brother, Deny Setiyo Budy which is very much helpful in the implementation of this research as well as our
colleagues for suggestions and constructive criticisms for the quality of this research.
7.
REFERENCES
[1] Akinola O. Solomon and Olatidoye A.Adebanke.(2015), On The Image Quality and Encoding Times of LSB, MSB and Combined LSB-MSB Steganography Algorithms Using Digital Images, International Journal of Computer Science & Information Technology (IJCSIT) Vol 7, No 4
[2] Rohit Garg and Tarun Gulati (2012). Comparison of Lsb & Msb Based Steganography in Gray-Scale Images, International Journal of Engineering Research & Technology (IJERT), Vol. 1, Issue 8.
[3] Tamane, S. C., Manza, R. R. and Deshmukh, R.R (2009), Digital Watermarking uses Image Fusion Method, Int. J.of Recent Trends in Engineering and Technology, Vol. 1, No.2. DOI: 01.IJRTET.01.02.223.
[4] Kanzariya Nitin K. and Nimavat Ashish V. (2013), Comparison of Various Images Steganography Techniques, International Journal of Computer Science and Management Research, Vol. 2, Issue 1..
[5] Deepchika Chopra, Preeti Gpta, Gaur Sanjay BC., Anil Gupta (2012),LSB Based Digital Image Watermarking For Graysacale Image, IOSR Journal of Computer Engineering (IOSRJCE),Vol.6, Issues 1 pp. 36-41.www.iosjournals.org
[6] Chetna (2014), Digital Image Watermarking Using DCT, IJCSMC, Vol. 3, Issue 9, September. P. 586-591.
[7] Al-Haj. Ali (2007), Combined DWT-DCT Digital Image Watermarking, Journal of Computer Science, 3, pp. 740-746.
[8] Nikita Kasya, G.R Sinha (2012), Image Watermarking using 3 level Discrete wavelet Transform (DWT), I.J. Modern Education and Computer Science, , Vol. 3,p. 50-56. [9] George, M., Yves Choinard, J., Georgana, N.(2001).. Spatial spectral spatial and spectral watermarking for image and video. Paper, Canada: School of Information Technology and Enginering, Ottawa, Ottario, Danada KIN 6N5.
[10] Naoum R., Shihab A, AlHamouz S. (2016), Enhanced Image Steganography System based on Discrete Wavelet Transformation and Resilient Back-Propagation, IJCSNS International Journal of Computer Science and Network Security, VOL.16 No.1.
[11] Munir.R., (2004).Digital Image Processing with Algorithm. Bandung: Publisher Informatika Bandung.
[12] Polikar, R. (1996).,.Fundamental of Concept and Overview of the Wavetlet Theory, 2nd edition, Dept. Electrical and Computer Engineering,Rowan University.
Authors’ background
Your Name Title* Research Field Personal website
Agung Mulyo widodo Lecture Image processing, Remote sensing,
Artificial Intellegence and Data security
Budi Tjahjono Senior lecturer Image processing, Information system,
and Data security
\begin{CCSXML} <ccs2012> <concept>
<concept_id>10002950</concept_id>
<concept_desc>Mathematics of computing</concept_desc> <concept_significance>500</concept_significance> </concept>
<concept>
<concept_id>10002950.10003714</concept_id>
<concept_desc>Mathematics of computing~Mathematical analysis</concept_desc> <concept_significance>500</concept_significance>
</concept> <concept>
<concept_id>10002950.10003714.10003715</concept_id>
<concept_desc>Mathematics of computing~Numerical analysis</concept_desc> <concept_significance>500</concept_significance>
</concept> <concept>
<concept_id>10002950.10003714.10003715.10003717</concept_id>
<concept_desc>Mathematics of computing~Computation of transforms</concept_desc> <concept_significance>500</concept_significance>
</concept> </ccs2012> \end{CCSXML}
\ccsdesc[500]{Mathematics of computing}