BULLETIN OF GEOLOGY, VOL. 2, NO. 2, 2018 229 DOI: 10.5614/bull.geol.2018.2.2.3
BASIN GEOMETRY ANALYSIS OF “NOKEN” AREA, MESOZOIC INTERVAL,
AKIMEUGAH BASIN, PAPUA
DAVID ONTOSARI1, BENYAMIN SAPIIE 2, HERMES PANGGABEAN3, EDY SLAMETO3.
1. Postgraduate Alumni FITB ITB, Jakarta, Email: [email protected]
2. Program Studi Teknik Geologi, Fakultas Ilmu dan Teknologi Kebumian, Institut Teknologi Bandung (ITB), Jl. Ganesha No.10, Bandung, Jawa Barat, Indonesia, 40132
3. Center for Geological Survey, Geological Agency, ESDM, Jl. Diponegoro Bandung
Sari - Area “Noken” terletak di Cekungan Akimeugah, Papua bagian selatan, mencakup area daratan dan lepas-pantai. Pada penelitian sebelumnya, area ini masih didefinisikan cekungan yang seragam berupa passive margin pada interval Mesozoikum.Sejumlah data mencakup anomali gayaberat berdayaudara, gayaberat satelit (TOPEX-Sandwell), gayaberat pengukuran di darat, total intensitas kemagnetan, sumur migas, seismik, dan data pengambilan conto permukaan yang diperoleh dari Pusat Survei Geologi (PSG) serta Pusat Data dan Informasi (Pusdatin) Kementerian Energi dan Sumber Daya Mineral (ESDM). Data diolah dengan metoda pemodelan inversi maju pada piranti lunak Geosoft dan dipetakan dengan metoda minimum curvature pada piranti lunak Petrel. Hasil analisisnya berupa patahan dan horison stratigrafi pada umur Mesozoikum. Nilai densitasnya terekam dengan baik menggunakan distribusi data dari tiga sumur (Sumur-A, Sumur-B, dan Sumur-C).
Berdasarkan interpretasi peta dan model gayaberat, peta intensitas kemagnetan total, dan model geologi bawah
permukaan pada top Mesozoikum, dapat disimpulkan bahwa geometri cekungan area “Noken” pada masa
Mesozoikum didominasi oleh bentuk graben dan half graben, dengan sumbu memanjang sesar relatif timur laut – barat daya (NW-SW). Peta isopach masa Mesozoikum menjadi data pendukung untuk membuktikan geometri cekungan ini. Secara khusus, pada zaman Trias terbentuk syn-rift dan pada zaman Jura – Kapur terbentuk post-rift. Sumbu memanjang cekungan ini relatif sejajar dengan sesar pembentuknya. Berdasarkan analisis struktur peta bawah permukaan pada masa Mesozoikum dan Kenozoikum, penampang dan model gayaberat dapat diinterpretasikan bahwa evolusi tektonik selama Kenozoikum mengubah geometri cekungan menjadi berarah baratlaut-tenggara.
Kata kunci: gayaberat, kemagnetan, pemodelan inversi-maju, geometri cekungan
Abstrack - Area "Noken" is located in the Akimeugah Basin, southern of Papua, covering onshore and offshore areas. In previous research, this area is still defined as laterally uniform passive margin basin during Mesozoic Era. A number of data include airborne-gravity anomaly, satellite gravity (TOPEX-Sandwell), land gravity, the total intensity of magnetism, oil and gas wells, seismic, and data retrieval surface sample obtained from the Center for Geological Survey, Geological Agency (PSG) and the Center for Data and Information (Pusdatin) Ministry energy and Mineral Resources (ESDM). Data processed by the method of forward-inversion modeling on Geosoft software and mapped by the method of minimum curvature in the Petrel software. The results of the analysis are fault and stratigraphic horizons in the Mesozoic Era. Their density recorded properly using distribution data from three wells (Well A, Well B, and Well C).
Based on interpretation of gravity maps, total magnetic intensity maps, and subsurface geological model at the top of the Mesozoic, could be concluded that the geometry of the basin in "Noken" area during Mesozoic was dominated by the graben and half-graben, with the longitudinal axis of the fault trending relative northeast - southwest (NW- SW). Isopach map of the Mesozoic interval is supporting data to prove this basin geometry. In particular, during Triassic syn-rifts were formed and the post-rift sediments were formed during Jurassic - Cretaceous. The longitudinal axis of the basin is relatively parallel to the fault constituent. Based on the analysis of the structure of the subsurface geological structure map of the Mesozoic and Cenozoic, gravity sections and models can be interpreted that tectonic evolution during Cenozoic changes the geometry of the basin became trending northwest-southeast.
Key words: gravity, magnetic, forward-inversion modeling, basin geometry
1. INTRODUCTION
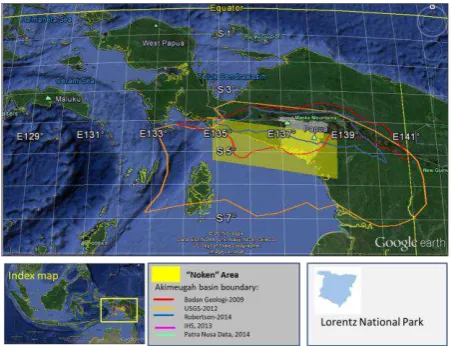
“Noken” area inside Akimeugah basin is located in the southern of Papua (Figure 1), covers onshore and offshore area, categorized
as a prospective basin based on many hydrocarbon shows on the outcrops and wells (Suliantara dan Susantoro, 2013). There are
BULLETIN OF
GEOLOGY
Fakultas Ilmu dan Teknologi Kebumian (FITB) Institut Teknologi Bandung (ITB)
BULLETIN OF GEOLOGY, VOL. 2, NO. 2, 2018 230 DOI: 10.5614/bull.geol.2018.2.2.3
more uncertainty of oil and gas discovery in this area, caused by lack of intensive research in the tectonic setting to hydrocarbon prospectivity. Mesozoic interval as the objective of this paper resulted by previous post drill recommendation in the surrounding
area of “Noken” (Miharwatiman, 2013).
“Noken” area (Figure 1) is a part of greater Akimeugah Basin, confined geographically by Asmat Thrust or Sepik terrane in the north (Hall, 2002), Tasman Line in the east (Bally et al., 2012; Hill and Hall, 2003), Merauke Arch in the West (Moss, 2001) and Aru High or Tarera-Aiduna Fault in the West (Cloos et al., 2005).
Figure 1. “Noken” Area inside all published
basin boundaries of Akimeugah Basin (Patra Nusa Data, 2014; Robertson -A CGG Company, 2014; Schenk et al., 2012; Sukhyar et al., 2009; The Ministry of Forestry, 1997),
origin, basin orientation, sedimentation thickness and basin evolution trough Mesozoic era. The challenges of brings together a variety of diverse data will be limited by the assumption that basin geometry can be determined that the upper limit of the Mesozoic defined interval from well and seismic data, while the lower limit of the Mesozoic interval can be defined from seismic data, combined with gravity and magnetic data validation. Analysis interval Mesozoic basin
geometry at this time, can be done by modeling the gravity with gravity data from wells, seismic and gravity measurements.
Regionally, “Noken” during Mesozoic era was
dominated by syn-rift caused by break-up, block faulting, and thermal doming (Baillie et al., 2003; Parris, 1996) during early Triassic to early Jurassic. This event created Tipuma Formation which is consisted of grey, red and green shales, sandstone, conglomerate, and limestone. That was followed transgressive to regressive sedimentation of post-rift event on continental margin (Holis et al., 2012) during Jurassic to Middle Miocene. It produced Kembelangan group to New Guinea Limestone Group.
2. DATA AND METHODOLOGY 2.1 Data
Data used in this research are grouped into two kind of data: primary and secondary. The interpreted after miss-tie analysis and well-seismic tie using two-way-time depth conversion from 7 wells.
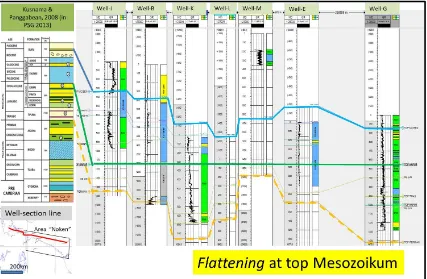
Figure 2. Three wells have density data in all geological era.
BULLETIN OF GEOLOGY, VOL. 2, NO. 2, 2018 231 DOI: 10.5614/bull.geol.2018.2.2.3
in this paper are EMAG (Earth Magnetic Anomaly Grid, (Maus, 2010; Maus et al., 2007) and airborne total intensity of magnetism (Nurmailah and Suyono, 2013; Setyanta, 2013c, 2013e, 2013b, 2013d, 2013a; Setyanta and Suyono, 2013; Siagian, 2013b, 2013a, 2008; Siagian and Mawardi, 2013; Siagian and Suyono, 2013; Widijono, 2013b, 2013d, 2013c, 2013f, 2013a, 2013e).
Secondary data resulted from field samples, field geological structures measurements, and tops of geological age marker using paleontology samples from well reports to control geological interpretation and
reconstruction.
2.2. Methodology
2.2.1. Subsurface interpretation
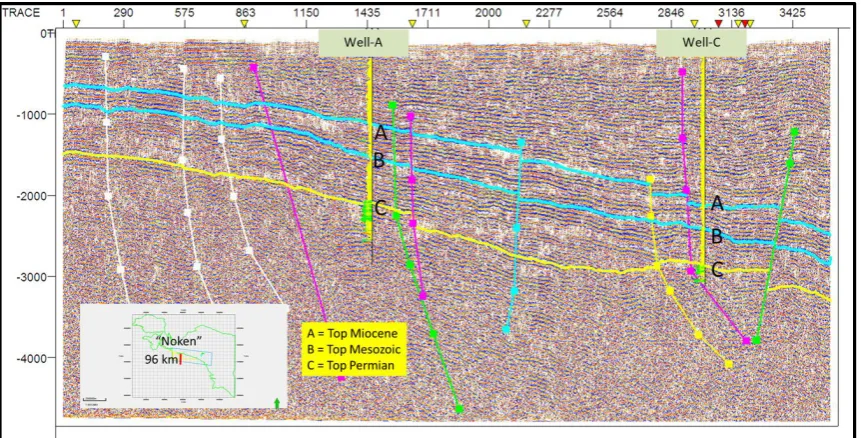
Subsurface interpretation created by well correlation, seismic stratigraphy, and subsurface mapping. Some well correlations crossing east-west (Figure 3, Figure 4) and NE-SW (Figure 5, Figure 6) show indications of graben and half-graben in the Mesozoic interval. Example of seismic interpretation of graben geometry indication in the Mesozoic interval shown in Figure 7 and convinced in
Figure 8.
BULLETIN OF GEOLOGY, VOL. 2, NO. 2, 2018 232 DOI: 10.5614/bull.geol.2018.2.2.3
Figure 4. Well correlation of east-west section, flatten at Mesozoic top.
BULLETIN OF GEOLOGY, VOL. 2, NO. 2, 2018 233 DOI: 10.5614/bull.geol.2018.2.2.3
Figure 6. Well correlation of SW-NE section, flatten at Mesozoic top.
BULLETIN OF GEOLOGY, VOL. 2, NO. 2, 2018 234 DOI: 10.5614/bull.geol.2018.2.2.3
Figure 8. Seismic interpretation of east-west section.
Basin geometry identification using gravity and magnetic data according to Gibson and Millegan (1998) was constructed using play identification stage, include regional reconnaissance, low resolution gravity required, regional depth to basement magnetic data, wide spacing of data acquisition, using regional play and geological interpretation. Gravity data analysis conducted by using correlation of three different data, as exemplified by Childers (et.al. 2001) in Figure 9. It made by a cross-comparison among the gravity data spatially from track to track with interpolation technique cross-section and depth estimation of gridded gravity data (Alotaibi, 2016; Childers et al., 2001). All of these techniques performed in the cross-section of two-dimensional (2D) semi-quantitatively by contrast anomaly, coherence, and its effect on gravity modeling (Jacoby and Smilde, 2009).
Figure 9. Example of three data gravity anomaly using submarine, airborne, and satellite ERS (Childers et al., 2001).
The same method of Childers (et.al. 2001) was
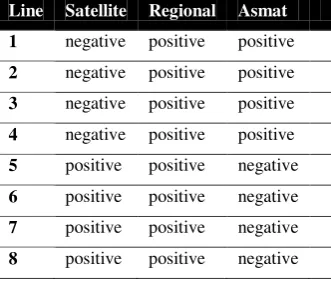
applied in this research to the entire gravity data in the area "Noken". It obtained several positive anomalies between all the data. Only one track (track nine) was negatively correlated among all data. The first four tracks show a strong correlation between the value of regional gravity and field gravity of the Asmat area.
A total of six (6) of the 10 tracks shown a positive correlation value of satellite gravity and gravity fields. Based on this analysis, the gravity data from the satellite could be used in the density modeling, because the area is more extensive coverage to the open sea (Arafura Sea), while the regional gravity data only covers land area and field gravity covers only small area on the island of Papua. It is summarized on Table 1.
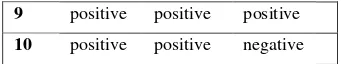
Table 1. Summary of correlation among three
gravity anomaly data according to Childers methodology (Childers et al., 2001).
Line Satellite Regional Asmat
1 negative positive positive
2 negative positive positive
3 negative positive positive
4 negative positive positive
5 positive positive negative
6 positive positive negative
7 positive positive negative
BULLETIN OF GEOLOGY, VOL. 2, NO. 2, 2018 235 DOI: 10.5614/bull.geol.2018.2.2.3
9 positive positive positive
10 positive positive negative
By using existing data, it can be done the analysis of geological structures such as folds, faults down, and reverse fault (Romberg, 1958 in Hinze et al. 2013). The method of analysis using gravity data applied in the area "Noken" and obtained interpretation of geological structures are shown in Error! Reference source not found.. Magnetic data gridded using the value of the total magnetic intensity data (TMI). Gridding conducted using the same algorithm with the gravity data, minimum curvature algorithm. Values that appear on the gridded map is total magnetic intensity values based on Coulomb's law and is expressed in units nanotesla (Hinze, et al., 2013). Interpretation of the geological structure from gridded TIM map conducted using deconvolution of the data, according to Error! Reference source not found..
Figure 10. Structural geology interpretation based on gravity anomaly at various depth
(Romberg, 1958 in (Hinze et al., 2013).
Figure 11. Examples of data convolution total magnetic intensity with a horizontal gradient, and the interpretation of the geological structure (Hinze et al. 2013).
2.2.2. Subsurface modeling
Geological modeling conducted using data and
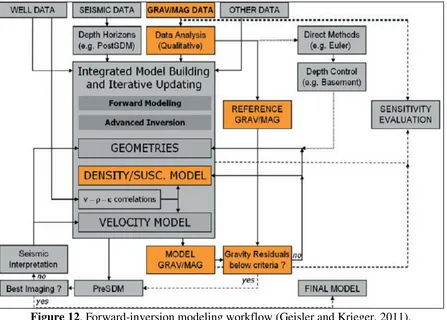
models that have been validated on the steps above, according forward-inversion modeling method, with a range of data. The forward- inversion modeling runs on the module GM-SYS in Geosoft Oasis Montaj, shown in
Figure 12. Desired model shown as concept in
BULLETIN OF GEOLOGY, VOL. 2, NO. 2, 2018 236 DOI: 10.5614/bull.geol.2018.2.2.3
Figure 12. Forward-inversion modeling workflow (Geisler and Krieger, 2011).
Figure 13. Concept illustration geologic modeling with the data magnetism (TIM), gravity (FA =
free air, CBA = complete bouguer anomaly), wells and seismic (Hinze et al. 2013).
Validation of the model with the data density and magnetism parameters were obtained from the World Magnetism Model (World Magnetic Model or WMM, Maus, 2010). Magnetism parameter imposed in the area "Noken" as input validation gravity models are using some geomagnetization parameters, such as inclination, declination, and horizontal magnetic intensity.
3. RESULTS
BULLETIN OF GEOLOGY, VOL. 2, NO. 2, 2018 237 DOI: 10.5614/bull.geol.2018.2.2.3
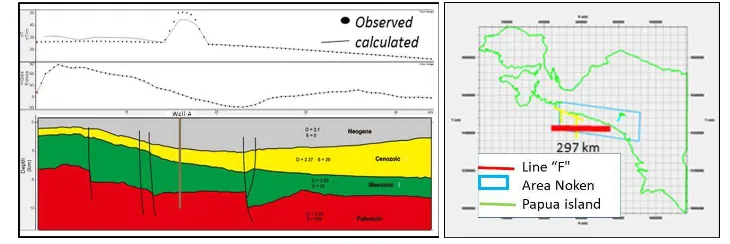
Figure 14. Gravity model of NE-SW section (gravity track is red-lined on the map).
Figure 15. Gravity model of W-E section (gravity track is red-lined on the map).
Isopach map was constructed in the Mesozoic interval, adding a strong suspicion of strike-slip fault pattern that generated graben – half graben during Mesozoic Era. There are six unparalleled strike-slip faults inferred as rhomboidal basin deep development mainly between fault S3 and fault S4 during Mesozoic.
From the map, it is indicated that sinistral strike-slip fault is relatively longer in the
eastern of “Noken” rather than in the western.
The result map and summarize of fault
mechanism are summarized in Figure 16 and
Table 2. The geometry dimension of the
fakf-graben and graben in the southwestern area of "Noken" length of 70 km and a width of 55km with a relatively east-east orientation. At the center of the "Noken" area, the geometry dimension of graben and half graben is 170 km long and 80 km wide, with the orientation relatively northeast-southwest. In the eastern part of the "Noken" area the geometry of graben and half graben has a length of 140 km and width of 80 km with the orientation relatively northeast-southwest.
BULLETIN OF GEOLOGY, VOL. 2, NO. 2, 2018 238 DOI: 10.5614/bull.geol.2018.2.2.3
Table 2. Fault and associated basin geometry, location of each fault on Figure 16 (fault numbering in Figure 16, geometry terms based on Mann, 1983 in Mann, 2007).
4. DISCUSSION
The result of this research that interpretation of heterogeneous Pre-Paleozoic basement in Figure 14 is contrary of homogenous basement model (Padmawidjaja, 2014; Kendrick and Hill, 2001) and strengthen alleged previous investigators on indications of bedrock (Miharwatiman, 2013; Roberts et al., 2011). The rhomboidal basin deep development mainly between fault S3 and fault S4 based on the summary in the Table 2, due to kinematics or differential lateral plate velocities of the fragmented plate during its development in Mesozoic (Triassic – Cretaceous). The basin development is simplified in Figure 17.
Figure 17. Basin geometry evolution
developed by sinistral strike-slip fault kinematics (modified from Mann, 1983 in Mann, 2007).
The syn-rifts geometry interpreted in Figure 15 is poorly determined in the previous research (Hill and Hall, 2003; Hall, 2012). The geometry in the Figure 15, according to Metcalfe (2006), syn-rift associated with left-lateral (sinistral) strike-slip fault and
formed during rifting in Triassic. Rifting continued with spreading of Meso-Thetys became Neo-Thetys and Pacific Ocean in Jurassic.
The faults experienced elongation in the west and the shortening to the east. This is closely related to clockwise rotation in the Banda Embayment section which is relatively affecting the extension of the crust in the western area of "Noken". This process is indirectly influenced by the movement of India's crust fragments that clockwise rotate counterclockwise to the north at the Lime-Miocene end (Hall, 2012).
The fault associations in the "Noken" area are predominantly either the NW-SE or NE-SW trending faults, or corresponding to the elaboration of the faults around the Warim block (Granath and Agrakoesoemah, 1989). This sliding shear of sinistral strike-slip fault appears as the Komewu fault zone, which Henage (1993) interpreted as a fault zone dominated by a dextral strike-slip fault. The interpretation map of dextral strike-slip faults driven by gravity-magnetic data and analyzed by Granath and Agrakoesoemah (1989) can be seen in Figure 18.
Figure 18. Fault association in the “Noken”
area and surroundings, from the previous research in East Lengguru Block (modified from Granath & Agrakoesoemah, 1989).
BULLETIN OF GEOLOGY, VOL. 2, NO. 2, 2018 239 DOI: 10.5614/bull.geol.2018.2.2.3
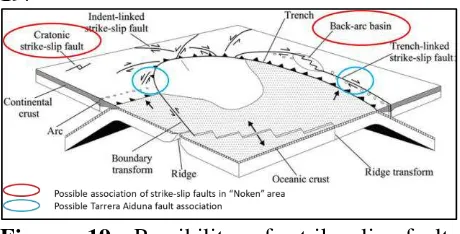
the sinistral strike-slip faults have two possibilities, associated to Triassic back-arc basin development, of caused by Mesozoic to present-day intracratonic strike-slip fault. The simple scheme of this explanation in Figure 19.
Figure 19. Possibility of strike-slip fault
associations in “Noken” area based on strike-slip tectonic setting (modified from Woodcock, 1986 in Mann, 2007).
5. CONCLUSION
Based on interpretation of gravity maps, total magnetic intensity maps, and subsurface geological model at the top of the Mesozoic, could be concluded that the geometry of the basin in "Noken" area during Mesozoic was dominated by the graben and half-graben, with the longitudinal axis of the fault trending relative northeast - southwest (NW- SW). isopach map of the Mesozoic interval is supporting data to prove this basin geometry. In particular, during Triassic syn-rifts were formed and the post-rift sediments were formed during Jurassic - Cretaceous. The longitudinal axis of the basin is relatively parallel to the fault constituent.
Based on the analysis of the structure of the subsurface geological structure map of the Mesozoic and Cenozoic, gravity sections and models can be interpreted that tectonic evolution during Cenozoic changes the geometry of the basin became trending northwest-southeast.
ACKNOWLEDGMENT
The authors thank to Center for Geological Survey management and staff (Mr. Ipranta, Ms. Immaculata, Mr. Akbar Cita, Mr. Masykur W., Mr. Taufiq and Mr. Hanif) for the office study internship. Thanks to Pertamina Hulu Energi (PHE) Exploration Director Mr. Rudy Ryacudu and PHE Managements (Mr. Budi
Tamtomo, Ms. Rusalida Raguwanti, Mr. Dadi Lestiyardi, Mr. Pande Made Oka Iriana, Mr. Tonny S.P., and Mr. Jujur Hutabarat) for the encouragement. Thanks to Pusdatin ESDM staff (Mr. Deni Mulya Gunawan), Patra Nusa Data staff (Mr. Dedi and Mr. Juanda) for the data, and also all academic staff of FITB-ITB, Bandung.
REFERENCES
Alotaibi, B., 2016, Two Manual Ways to Interpret Gravity Anomaly:, https://prezi.com/qo7lc2xwwasu/two-manual-ways-to-interpret-gravity-ano maly/ (accessed September 2016). Baillie, P., Fraser, T., Hall, R., and Myers, K.,
2003, Geological development of Eastern Indonesia and the northern Australia collision zone: a review, in
Proceedings of the Timor Sea Symposium, Darwin, Northern Territory, Australia, June 19–10, p. Geology and Tectonics: Phanerozoic Passive Margins, Cratonic Basins and Global Tectonic Maps, Elsevier, p. 970–1151,
http://linkinghub.elsevier.com/retrieve/ pii/B978044456357600024X
(accessed August 2015).
Childers, V.A., McAdoo, D.C., Brozena, J.M., and Laxon, S.W., 2001, New Gravity Data in the Arctic Ocean: Comparison of Airborne and Ers Gravity: Journal of Geophysical Research: Solid Earth, v. 106, p. 8871–8886, doi: 10.1029/2000JB900405.
Cloos, M., Sapiie, B., Ufford, A.Q. van, Weiland, R.J., Warren, P.Q., and McMahon, T.P., 2005, Collisional Delamination in New Guinea: The Geotectonics of Subducting Slab Breakoff: Boulder, Colo, Geological Society of America, Special paper 400, 51 p.
BULLETIN OF GEOLOGY, VOL. 2, NO. 2, 2018 240 DOI: 10.5614/bull.geol.2018.2.2.3
Uncertainty in Subsalt Imaging with
Gravity and FTG:,
www.terrasysgeo.com.
Gibson, R.I., and Millegan, P.S. (Eds.), 1998, Geologic Applications of Gravity and Magnetics: Case Histories: Society of Exploration Geophysicists and American Association of Petroleum Geologists, 1989, Variations in Structural Style Along the Eastern Central Range Thrust Belt, Irian Jaya: PROCEEDINGS IPA, v. Eighteenth Annual Convention, p. 11.
Hall, R., 2002, Cenozoic geological and plate tectonic evolution of SE Asia and the SW Pacific: computer-based reconstructions, model and animations: Journal of Asian Earth Sciences, v. 20, p. 353–431.
Hall, R., 2012, Late Jurassic–Cenozoic reconstructions of the Indonesian region and the Indian Ocean: Anomali Bouguer Lembar Rotanburg, Papua: Pusat Penelitian dan Pengembangan Geologi.
Hayat, D.Z., and Raharjo, D.N., 2009, Peta Anomali Bouguer Lembar Omba, Papua: Pusat Penelitian dan Pengembangan Geologi.
Hayat, D.Z., and Sobari, I., 2010, Peta Anomali Bouguer Lembar Timika, Papua: Pusat Penelitian dan Pengembangan Geologi.
Henage, L.F., 1993, Mesozoic and Tertiary Tectonics of Irian Jaya: Evidence for Non-Rotation of Kepala Burung: PROCEEDINGS IPA, v. Twenty
Second Annual Convention, p. 763– 792.
Hill, K.C., and Hall, R., 2003, Mesozoic-Cenozoic Evolution of
Australia’s New Guinea Margin in a
West Pacific Context, in Special Paper 372: Evolution and Dynamics of the Australian Plate, Geological Society of America, v. 372, p. 265–290, Exploration: Principles, Practices, and Applications: Cambridge, Cambridge Univ. Press, 512 p.
Holis, Z., Ponkarn, A.S., Gunawan, A., Damayanti, S., and Gunawan, B.K., 2012, Structural Evolution of Banda Arc, Eastern Indonesia: As a Future Indonesian Main Oil and Gas Development, in AAPG International Convention and Exhibition, Singapore, AAPG, Search and Discovery Article, v. #50766, p. 11.
Jacoby, W., and Smilde, P.L., 2009, Gravity interpretation: fundamentals and application of gravity inversion and
geological interpretation ; with
CD-ROM: Berlin, Springer, 395 p. Kendrick, R.D., and Hill, K.C., 2001,
Hydocarbon Play Concepts for the Irian Jaya Foldbelt, in Proceeding IPA, Jakarta, Indonesian Petroleum Association, IPA01-G-087, v. 1, p. 353–367.
Mann, P., 2007, Global Catalogue, Classification and Tectonic Origins of Restraining- and Releasing Bends on Active and Ancient Strike-Slip Fault Systems: Geological Society, London, Special Publications, v. 290, p. 13–142, doi: 10.1144/SP290.2.
Maus, S., 2010, World Digital Magnetic Anomaly Map: NOAA candidate:
EMAG3: NGDC’s candidate for the
World Digital Magnetic Anomaly Map, http://geomag.org/models/wdmam.htm l (accessed December 2016).
BULLETIN OF GEOLOGY, VOL. 2, NO. 2, 2018 241 DOI: 10.5614/bull.geol.2018.2.2.3
J.D., and Ravat, D., 2007, National Geophysical Data Center Candidate for the World Digital Magnetic Anomaly Map: Geochemistry, Geophysics, Geosystems, v. 8, p. n/a-n/a, doi: 10.1029/2007GC001643.
Metcalfe, I., 2006, Palaeozoic and Mesozoic tectonic evolution and palaeogeography of East Asian crustal fragments: The Korean Peninsula in context: Gondwana Research, v. 9, p. 24–46, doi: 10.1016/j.gr.2005.04.002. Miharwatiman, J.S., 2013, Exploration of the
Arafura Basin Indonesia:
Moss, S., 2001, Extending Australian Geology Into Eastern Indonesia and Potential Source Rocks Of The Indonesian Arafura Sea: PESA NEWS, p. 54–56. Nurmailah, and Suyono, 2013, Peta Citra
Intensitas Magnetik Total Lembar Eminee Dataran Arafura, Papua: Pusat Survei Geologi Kemagnetan.
Padmawidjaja, T., 2014, Penelitian Gayaberat Cekungan Akimegah, Kabupaten Asmat: Pusat Survei Geologi, Badan Geologi, Kementrian ESDM, 26 p. Parris, K., 1996, Central Range Irian Jaya
Geology Compilation: PT. Freeport Indonesia PT. Freeport Indonesia in conjunction with GRDC Autocad drawing.
Patra Nusa Data, 2014, Inameta Platinum Insight: Patra Nusa Data Inameta Platinum Insight lite Edition, http://product.patranusa.com/daval/# (accessed February 2016).
Roberts, G., Ramsden, C., Christoffersen, T., Wagimin, N., and Muzaffar, Y., 2011, East Indonesia: Plays and Prospectivity of the West Aru, Kai Besar and Tanimbar Area-Identified from New Long Offset Seismic Data: Search and Discovery Article, v. 10348, p. 10–13. Robertson -A CGG Company, 2014,
Robertson Tellus Sedimentary Basins
of the World Map:,
http://www.robertson-cgg.com/product s/tellus.
Sandwell, D.T., Muller, R.D., Smith, W.H.F., Garcia, E., and Francis, R., 2014, New Global Marine Gravity Model from
Cryosat-2 and Jason-1 Reveals Buried Tectonic Structure: Science, v. 346, p. 65–67, doi: 10.1126/science.1258213. Schenk, C.J., Brownfield, M.E., Charpentier,
R.R., Cook, T.A., Klett, T.R., Pitman, J.K., and Pollastro, R.M., 2012, Assessment of Undiscovered Oil and Gas Resources of Papua New Guinea, Eastern Indonesia, and East Timor in 2011: US Department of the Interior,
US Geological Survey,
http://pubs.usgs.gov/fs/2012/3029/FS2 012-3029.pdf (accessed August 2015). Setyanta, B., 2013a, Peta Citra Intensitas
Magnetik Total Lembar Amar Dataran Arafura, Papua: Pusat Survei Geologi Kemagnetan.
Setyanta, B., 2013b, Peta Citra Intensitas Magnetik Total Lembar Awok Dataran Arafura, Papua: Pusat Survei Geologi Kemagnetan.
Setyanta, B., 2013c, Peta Citra Intensitas Magnetik Total Lembar Laut Namarop Dataran Arafura, Papua: Pusat Survei Geologi Kemagnetan.
Setyanta, B., 2013d, Peta Citra Intensitas Magnetik Total Lembar Oghorin Dataran Arafura, Papua: Pusat Survei Geologi Kemagnetan.
Setyanta, B., 2013e, Peta Citra Intensitas Magnetik Total Lembar Warse Dataran Arafura, Papua: Pusat Survei Geologi Kemagnetan.
Setyanta, B., Indragiri, N.M., and Raharjo, D.N., 2008, Peta anomali bouguer lembar Beoga, Papua: Pusat Penelitian dan Pengembangan Geologi.
Setyanta, B., and Suyono, 2013, Peta Citra Intensitas Magnetik Total Lembar Tg. Wakia Dataran Arafura, Papua: Pusat Survei Geologi Kemagnetan.
Siagian, H.P., 2008, Peta anomali bouguer lembar Yapero & Birufu, Papua: Pusat Penelitian dan Pengembangan Geologi. Siagian, H.P., 2013a, Peta Citra Intensitas Magnetik Total Lembar Sungai Cemara Dataran Arafura, Papua: Pusat Survei Geologi Kemagnetan.
BULLETIN OF GEOLOGY, VOL. 2, NO. 2, 2018 242 DOI: 10.5614/bull.geol.2018.2.2.3
Kemagnetan.
Siagian, H.P., and Mawardi, S., 2013, Peta Citra Intensitas Magnetik Total Lembar Sungai Inabuka Dataran Arafura, Papua: Pusat Survei Geologi Kemagnetan.
Siagian, H.P., and Suyono, 2013, Peta Citra Intensitas Magnetik Total Lembar Mimika Dataran Arafura, Papua: Pusat Survei Geologi Kemagnetan.
Sobari, I., and Hayat, D.Z., 2008, Peta anomali bouguer lembar Enarotali, Papua: Pusat Penelitian dan Pengembangan Geologi. Sobari, I., Susilo, A., and Siagian, H.P., 2008, Peta anomali bouguer lembar Wamena, Papua: Pusat Penelitian dan Pengembangan Geologi.
Struckmeyer, H.I.M., 1991, Mesozoic to Cainozoic Palaeogeographic Maps for the Eastern New Guinea Region: BMR Australia Paleogeography 38 BMR Record 1991/113, 55 p.
Sukhyar, R., Wirakraman, A.D., Sukarna, D., Suwarna, N., Surono, and Nazar Buyung, 2009, Sedimentary Basin Map of Indonesia, Based on Gravity and Geological Data: Geological Agency. Suliantara, S., and Susantoro, T., 2013,
Pemetaan Cekungan Target Eksplorasi Migas Kawasan Timur Indonesia: Lembaran Publikasi Minyak dan Gas anomali bouguer lembar Waghete, Papua: Pusat Penelitian dan Pengembangan Geologi.
The Ministry of Forestry, 1997, Lorentz National Park map: Minister of Forestry, Republic of Indonesia
Keputusan Menteri Kehutanan Nomor :
154/Kpts-II/1997,
http://www.btnlorentz.blogspot.com/. Widijono, B.S., 2013a, Peta Citra Intensitas
Magnetik Total Lembar Munu Dataran Arafura, Papua: Pusat Survei Geologi Kemagnetan.
Widijono, B.S., 2013b, Peta Citra Intensitas Magnetik Total Lembar Pece Timur
Dataran Arafura, Papua: Pusat Survei Geologi Kemagnetan.
Widijono, B.S., 2013c, Peta Citra Intensitas Magnetik Total Lembar Pulau Laag Dataran Arafura, Papua: Pusat Survei Geologi Kemagnetan.
Widijono, B.S., 2013d, Peta Citra Intensitas Magnetik Total Lembar Suator Dataran Arafura, Papua: Pusat Survei Geologi Kemagnetan.
Widijono, B.S., 2013e, Peta Citra Intensitas Magnetik Total Lembar Sungai Lorent Dataran Arafura, Papua: Pusat Survei Geologi Kemagnetan.