ANALYSIS
Dynamic substance flow analysis: the delaying mechanism of
stocks, with the case of PVC in Sweden
Rene´ Kleijn *, Ruben Huele, Ester van der Voet
Centre of En6ironmental Science,Leiden Uni6ersity,P.O.Box9518,2300RA Leiden,The Netherlands
Received 19 October 1998; received in revised form 14 July 1999; accepted 14 July 1999
Abstract
Today’s stocks are tomorrow’s emissions and waste flows. As a result of the time lag introduced by the buffering function of the stock of materials and products in society environmental problem flows which seem to be under control can easily rebound. In this paper an example is given of how signal processing can be used in dynamic Substance Flow Analysis for estimating the future generation of waste and emissions from present societal stocks. An approach is outlined to estimate the outflow of waste products from stocks on the basis of assumptions on the shape of the distribution describing the inflow of new products, the average life span of the products, and the life-span distribution. To exemplify the approach we used a theoretical case of PVC in Sweden. It was found that the delaying mechanisms of the stocks can make the outcome counterintuitive. Furthermore, the chosen shape of the input-distri-bution function has the most influence on the predicted outflows, especially in the case of possible fashion-type (exponentially increasing) markets. The choice of the shape of the inflow distribution could, therefore, be based on qualitative knowledge of the market of the different products. The life-span distribution appears to have a more subtle influence on the height of the peaks and the time that they occur. So far only a normal distribution has been considered; more research is recommended into other types of distribution. © 2000 Elsevier Science B.V. All rights reserved.
Keywords:Dynamic modeling; Industrial metabolism; PVC; Signal processing; Stocks; Substance flow analysis
www.elsevier.com/locate/ecolecon
1. Introduction
Many of the environmental problems we are facing today are a result of society’s processing of materials. One of the challenges of economics is to relate the generation of waste and emissions to
societal developments. This can be approached from many sides. One possibility is to look at the societal system in environmental terms. This ap-proach is taken by Ayres (e.g. Ayres, 1989; Ayres et al., 1989; Ayres and Simonis, 1994) in his introduction of the concept of industrial metabolism. This concept argues the analogy be-tween the economy and environment on a mate-rial level: the economy’s ‘metabolism’ in terms of materials mobilization, use and excretion to create * Corresponding author. Tel.:+31-71-5277477; fax:+
31-71-5277434.
E-mail address:[email protected] (R. Kleijn)
‘technomass’ is compared to the use of materials in the biosphere to create biomass. Whereas the biosphere has had billions of years to evolve and attune its processes to such a state that waste generated in one process is converted into a re-source for another, the economy is still in its early stages of wastefulness. In order to speed up ‘eco-nomic evolution’, society must look to the bio-sphere for guiding principles. The description of the economy thus is limited to a description of the physical economy. The research area of industrial ecology (e.g. Jelinski et al., 1992; Socolow et al., 1994; Graedel and Allenby, 1995; Ayres and Ayres, 1996; Allenby, 1999) occupies itself among others with elaborating and operationalizing this concept, and takes the physical economy as its primary subject.
An important research instrument in this field is the materials balance (e.g. Kneese et al., 1970; Ayres and Ayres, 1996), a tool for describing the materials regime of the economy based on the Law of Mass Preservation, analogous to the long-standing practice of investigating ecological-mate-rials cycles. Analytical tools based on the materials balance are Materials Flow Analysis (MFA) and Substance Flow Analysis (SFA). These tools are useful for supporting environmen-tal policy (van der Voet, 1996; Bringezu and Kleijn, 1997): they enable policy makers to trace the origins of pollution problems and to evaluate the appropriateness of the societal management of materials and substances.
Until recently, MFA has concentrated mostly on flows. During the past few years, MFA
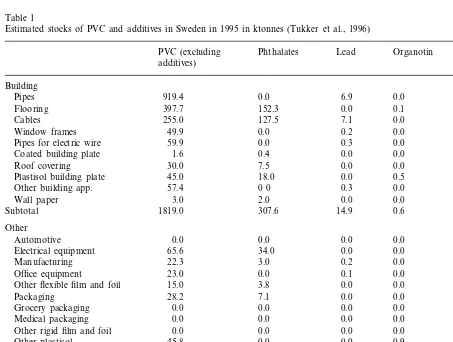
re-Table 1
Estimated stocks of PVC and additives in Sweden in 1995 in ktonnes (Tukker et al., 1996)
Phthalates SnS
PVC (excluding Lead Organotin
additives)
Flooring 397.7 0.1 1.8
127.5 7.1
Cables 255.0 0.0 0.0
0.0 0.0
0.2
Window frames 49.9 0.0
0.0 0.3
Pipes for electric wire 59.9 0.0 0.0
1.6 0.4
Coated building plate 0.0 0.0 0.0
0.0 0.0
0.0
Roof covering 30.0 7.5
45.0 18.0
Plastisol building plate 0.0 0.5 0.0
57.4
Other building app. 0 0 0.3 0.0 0.0
3.0 2.0
Wall paper 0.0 0.0 0.0
Subtotal 1819.0 307.6 14.9 0.6 1.8
Other
Electrical equipment 0.0 0.0 0.0
0.0 0.0
0.2
Manufacturing 22.3 3.0
Office equipment 23.0 0.0 0.1 0.0 0.0
0.0 0.0
Other flexible film and foil 15.0 3.8 0.0
0.0
Packaging 28.2 7.1 0.0 0.0
0.0
Grocery packaging 0.0 0.0 0.0 0.0
Medical packaging 0.0 0.0 0.0 0.0 0.0
0.0 0.0
0.0 0.0
Other rigid film and foil 0.0
0.0 0.9
0.0 0.0
Other plastisol 45.8
Medical tubes/hoses 10.0 4.0 0.0 0.1 0.0
0.0 0.0
Other soft tubes/hoses 0.0 0.0 0.0
12.0 6.0
Camouflage fabrics 0.3 0.0 0.0
0.0 0.0
Other artificial leather 15.0 9.8 0.0
67.5 0.7 1.0
Subtotal 236.9 0.0
375.1
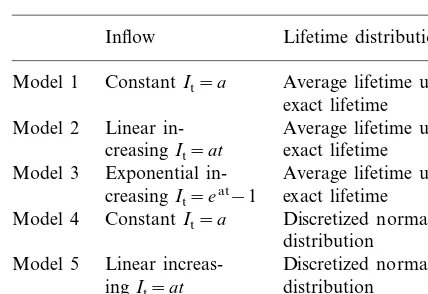
Table 2 Chosen models
Inflow Lifetime distribution
Model 1 ConstantIt=a Average lifetime used as exact lifetime
Linear in- Average lifetime used as Model 2
creasingIt=at exact lifetime
Average lifetime used as Exponential
in-Model 3
creasingIt=eat−1 exact lifetime
Model 4 ConstantIt=a Discretized normal
distribution Linear
increas-Model 5 Discretized normal
distribution ingIt=at
Exponential
in-Model 6 Discretized normal
distribution creasingIt=e
at−1
stocks interact with each other: stocks grow when the inflows exceed the outflows of a (sub)system and certain outflows of a (sub)system are propor-tional to the stocks. In this article, we discuss some possibilities to estimate future outflows on the basis of information on current stocks. We use PVC in Sweden as a case in point. This case was partly based on a study by TNO and CML for Norsk Hydro (Tukker et al., 1996).
2. Methods and data
2.1. Flows and stocks in SFA
There are different types of relations between stocks and flows. We distinguish:
the outflow is proportional to the stock’s
mag-nitude: the stock as a size buffer;
the outflow is a delayed inflow: the stock as a
time buffer.
2.1.1. The stock as a size buffer
Certain flows are dependent directly on the magnitude of certain stocks. For example, leach-ing of nitrate from the topsoil to the groundwater is not directly dependent on the addition of ni-trates through fertilizers or atmospheric deposi-tion, but is proportional to the stock (i.e. the concentration) of nitrate in the soil. The relation between the inflow of nitrate into the soil and the outflow through leaching is indirect, via the re-sulting increase of the stock in the soil. In this case, the time of introduction of a nitrate-ion is not related to the time it leaches to the groundwa-ter. In other words, the chance of leaching is equal for every nitrate ion present in the soil.
Modeling this type of flow-stock relation is relatively straightforward: first the magnitude of the stock has to be determined, for example, by measurements or by mass balance calculation on the basis of records of past inflows and outflows, and then the outflow can be calculated as a simple fraction of the stock leading to a geometric distri-bution. For example, the SFA model Flux uses this option (Boelens and Olsthoorn, 1998). Most environmental stocks conform to this type, and some emissions from economic stocks as well. searchers have realized that stocks may be equally
2.1.2. The stock as a time buffer
However, this approach is not valid for all types of stocks. An example is the modeling of waste flows from stocks of goods in society, e.g. PVC in roof gutters. In this case the waste generation depends on the stock of PVC in a different manner. Contrary to the nitrate example mentioned above, it does make a difference at what point in time a
certain product entered the stock. For PVC gutters there will be more or less a FIFO (first-in-first-out) type of regime; each individual gutter has a certain life span and on average the older specimens will enter the waste stage earlier than the newer ones. Thus, not only the magnitude of the stock but also the age distribution of products in the stock deter-mines the outflow.
In such a case the relation between the present size of the stocks and the future emissions and waste flows is often not straightforward and can-not be modeled easily (Huele and Kleijn, 1997; Huppes et al., 1997). This is even more true when a composite stock is regarded: the societal stock of PVC as it is today consists of a large number of products with widely varying average life spans.
2.2. Modeling the stock’s outflow as a delayed inflow modified by life-span distribution
One general rule of mass balances is that the mass inputs of a process equal the mass outputs. This rule is derived from the 18th-century Lavoisier’s law of conservation of mass. Lavoisier’s law results in the most basic starting point for MFA: IN=OUT. It also applies in the case of stock modeling. Although the inflows have to equal the outflows in the end (in the steady state situation) this might never occur in reality because of changes in regimes and flows over time. If IN\OUT the substance which is studied will accumulate and stocks will be formed within the system. If INBOUT there will be a negative accumulation and the stocks in the system will be depleted.
For our modeling of the outflow from stocks we have chosen to adopt the approach of regard-ing the outflow of the system as a delayed and reversed (negative) inflow. This approach has been used before, for example, for modeling the development of buildings (Gabathuler and Wu¨est, 1984) and is now adapted for the modeling of waste and emissions generation from societal stocks of products. In this view, the stocks are then a result of the combination of inflows and outflows over the years. The life span of the products determines the delay. This life span, although generally known or estimated as an av-erage, will be distributed in some way: some indi-vidual products will be discarded earlier than others. To obtain an accurate picture of stock formation and depletion the distribution of life span should be known as well. However, empiri-cal data on the life-span distribution is often not available and the collection of such data can be very time consuming.
An alternative for using empirical data would be to assume a certain life-span distribution. Here there are various possibilities. Most commonplace would be to use a normal distribution: the devia-tions from the average are equal to both sides. The normal distribution was mentioned as an example of a known impulse response in the book of Baccini and Bader (1996). However, the choice for a normal distribution is rather arbitrary. One could imagine that in some cases there are argu-ments for another type of distribution. Skewed distributions such as Weibull’s, which is already used in lifetime modeling (Sto¨cker, 1995), might sometimes be more appropriate. In some cases even more complicated distributions may apply, for example, a distribution with two peaks de-pending on the environment of use (corrosive vs sheltered), or a small peak very soon (the first-year deaths) followed by a larger one later on.
In this article, the output=delayed input ap-proach described above is used to describe the economy as a system that responds to an input of products (the input signal) with an equal output after a certain delay (the output signal). The shape of the output signal is determined by the shape of the input signal and by the transforma-tion of this signal or, in other words, the signal processing by the system. The outflow in a certain year can thus be calculated as a combination of the inflows of earlier years and the life-span distri-bution (or disposal function) of the product. In mathematical terms this is equal to convolution. In terms of Systems Theory: we use a dynamic, linear, deterministic model. In our example of PVC in Sweden, we use the normal distribution to describe the disposal function. In terms of Sys-tems Theory, we assume two known impulse re-sponses, one derived from unity and the other from a discretized normal distribution.
2.3. Estimating the stock’s inflow
are still being produced. The inflow will change over time and decrease or increase according to the developments in supply, demand, and policy measures, resulting in an input-distribution over a number of years. If we want to predict future waste flows by the model described above, this input distribution is important information.
Lacking such an input distribution, several ap-proaches can be taken. One is to construct it by collecting time-series data on past inflows. For some of the more bulky products, for example, automobiles, this may be a good possibility be-cause production and trade statistics provide such data. When statistical data is lacking for the specific good, information must be gathered via a time consuming process of interviews and digging into other data sources.
Another approach would be to circumvent the problem by starting by collecting more informa-tion on the stocks themselves. A survey could be carried out on the existing stocks to determine the age of the individual products within the current stock, e.g. the age of PVC waterpipes in the current infrastructure. Information on the age of the products could be retrieved via measurements, interviews, etc. By combining the data on age of the products with data on average life time and life-time distributions the future waste flows then can be calculated. This approach is very valuable because it will result in database of more or less empirical data. An important disadvantage of this approach is, however, that it is very time consum-ing and therefore, expensive, and that the odds for arriving at a sufficient database are not very high.
A third approach, applicable when either time or data are lacking, would be to estimate the future outflows on the basis of an assumed time-series for the inflow. The shape of the inflow distribution can be based on the type of market in which the product belongs. For example, if we considered vinyl-clothing, we would know the market would be a fashion-type market in which exponential growth (and decline) of consumption can occur. On the other hand, the market for PVC-pipes seems to be described better by a model of linear increase in consumption. The thus-assumed time-series of consumption (inflow)
should again be combined with data on average life time and life-time distribution to estimate the future waste flows (outflow).
In this paper, we take the third approach and screen a number of possible input distributions, not only to predict future waste flows (and stocks) of PVC but also to assess the sensitivity of such predictions for assumptions.
3. Application of the modeling approach: five different ways for predicting future PVC waste flows
PVC is widely dispersed in society and is accu-mulated in anthropospheric stocks in various products, which at some time in the future will have to be processed as waste. A number of reasons can be given for the environmental rele-vance of the PVC stocks:
there is a scientific debate about the role of
PVC in the formation of dioxins in municipal waste incinerators (e.g. Born, 1992; Kanters, 1996);
PVC may disturb the recycling processes for
other plastics;
together with PVC, problematic additives such
as phthalates, lead, organotins and tin sulfide are accumulated. These additives may cause emissions both during use and during waste treatment.
It is therefore, important to prepare adequate waste treatment facilities. In order to do this, information is required regarding the moment in time and the quantity in which PVC stocks will be offered for waste treatment. In a number of coun-tries policies for phasing out of PVC in certain applications are being discussed.
emis-sions and waste flows’ can be visualized. The only empirical starting point was Swedish data on stocks of PVC in various applications in 1994. The estimated amount of PVC and additives in stocks in Sweden in 1994 is given below in Table 1.
To this, data assumptions are added regarding the input distribution, the life span and its distri-bution in order to arrive at the outflow.
Regarding the input distribution, three options are considered:
the simplest assumption would be a constant
inflow since the introduction of the different products. A constant inflow is an approxima-tion of a stock that has reached a certain stable size, the inflow compensates the unavoidable losses;
another possible inflow distribution would be
the result of a linearly increasing inflow. This could represent a stock that is growing slowly and steadily, for example, in line with popula-tion growth or income growth;
a third possibility would be an exponential
increase since the introduction of the products. An exponential growth may be imagined for new products conquering markets rapidly, such as fashions, or a new material replacing an old one. In the real world this distribution would be an S-shaped logistic curve. Here the logistic curve is further simplified in that the ‘natural’ end of the exponential increase will never actu-ally be reached by assuming that input-reduc-ing policy measures will be in place before this time.
Two options are considered in relation to the life-span distribution:
the simplest option, which may serve as a
reference, is to assume an exactly known life span, which is not distributed;
as a second option, a discretized normal
distri-bution is considered.
Out of a combination of these options, five models are generated. These are presented below in Table 2.
In all models the following starting points have been used:
the stocks’ sizes including additives have been
used, i.e. 926.3 ktonnes for PVC pipes, 551.9
ktonnes in PVC flooring, and 389.6 ktonnes for PVC cables;
the starting year for application of PVC was
1960 for pipes, 1975 for flooring, and 1965 for cables. These assumptions are educated guesses;
the average life span is 60 years for pipes, 15
years for flooring, and 30 years for cables, also educated guesses;
the standard deviation of the average life span,
used in models 4, 5, and 6, is assumed to be roughly one-sixth of the life span, i.e. 10 years for pipes, 3 years for flooring, and 5 years for cables;
the application of PVC in pipes, flooring, and
cables will linearly decline from 1995 to zero in 2010 because of an assumed phasing out pol-icy. This assumption is not related to any policy but was made to illustrate the time buffering of stocks.
In the next section, the results of the calcula-tions are presented.
4. Results
Kleijn
et
al
.
/
Ecological
Economics
32
(2000)
241
–
254
249
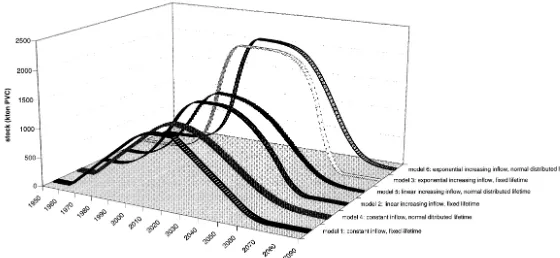
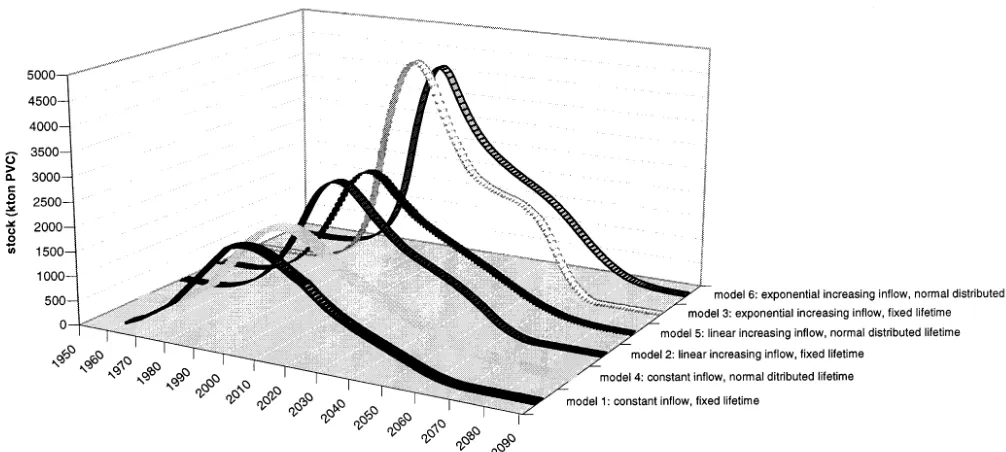
models. The magnitude of the stock is, as might be expected, much larger than the inflow or outflow. The influence of the type of input distri-bution which is used is important. The biggest stock is reached when an exponential increasing inflow is assumed (model 3 and 6). Again the results would be less extreme if the logistic S-curve would have been used in these two models. The influence of the life-span distribution is hardly visible in the stocks’ sizes.
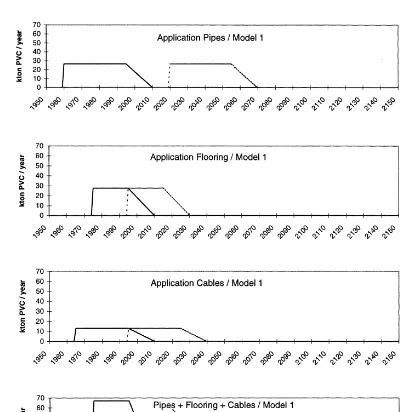
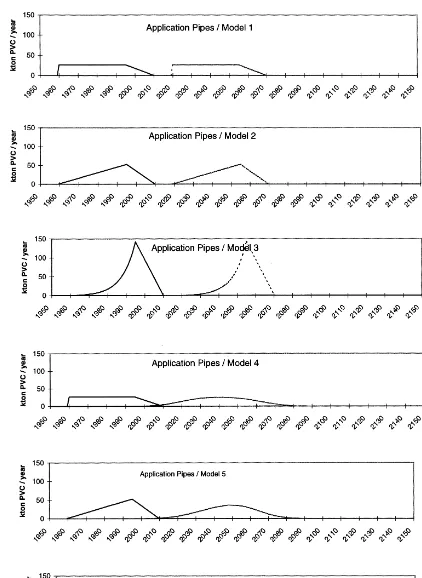
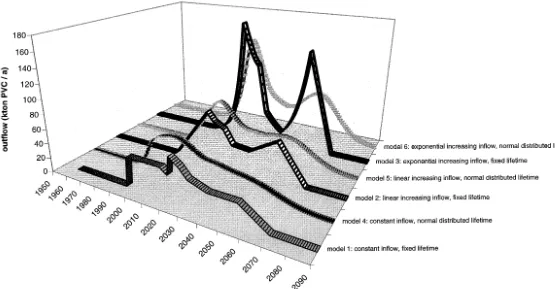
Fig. 4 contains the results of the combination of the three major PVC applications on the total outflow of PVC over time. Even with the first model, with the simple assumptions of a constant inflow and an exactly known life span, the combi-nation leads to a rather complex distribution. Most models generate two peaks. The first peak occurs between 2010 and 2020 and is a result of flooring and cables becoming waste. The second peak between 2050 and 2060 comes from dis-carded pipes. Again we can see the influence of the assumptions regarding the input distribution: the exponential increase leads to very much higher peaks than the other two inflow distributions. The normal distribution smoothes the distributions again, for the constant inflow assumption even to the point of smoothing over the second peak. The first peak is somewhat lower and again somewhat earlier in time. The moment in time where the outflow distribution ends is delayed from 2070 until roughly 2100.
Fig. 5 finally contains the development of the total stock of PVC over time as a result of the three major PVC applications. Again, the results for the exponentially growing inflows are very different from the rest. Using the logistic S-curve in models 3 and 6 would reduce this difference. The results for the other four models lead to rather similar results. Especially interesting is the fact that adding a normal distributed life span only results in minor changes in the stocks. The influence on the outflows (Fig. 4) is much larger.
5. Discussion and conclusions
This paper contains a description of a possible approach to identify and estimate future waste
flows from societal stocks. Although this ap-proach is very preliminary and the PVC case is rather sketchy, some preliminary conclusions can be drawn.
5.1. Possibilities for using the approach in
en6ironmental policy making
If we look at the results in terms of a potential waste-processing problem, we can see that a peak in the generation of PVC waste will rebound long after the application has been phased out. PVC will continue to be part of the generated waste until a century afterwards. Although these results are not directly applicable — the stock estimates are very rough and there is no phasing out policy for these applications — this type of information may be valuable for waste management policies.
5.2. Sensiti6ity of the approach
If we regard the influence of the different vari-ables on the results, we can see that the shape of the input distribution is the most important. It might be advisable, therefore, to derive such input distributions from real data whenever possible. In some cases — as in the case of cars — such data are available in statistics. However, if stocks of less bulky products are involved, it may not be easy to arrive at an input distribution from statis-tical data. In such cases assumptions are required. Other information, such as product and substance characteristics, then must be used to make such assumptions. This could be a line of investigation worth exploring for more than one reason: not only is a good estimate required when data are lacking, but it could also very much streamline the procedure because a very limited amount of data may go a long way. This could greatly enhance the applicability for environmental policy.
Kleijn
et
al
.
/
Ecological
Economics
32
(2000)
241
–
254
251
R
.
Kleijn
et
al
.
/
Ecological
Economics
32
(2000)
241
–
254
span may be sufficient. If more precise informa-tion is required, the distribuinforma-tion becomes more important: in the case of PVC the normally dis-tributed life spans not only led to lower peaks, but in some cases to earlier peaks. Possibly other distributions — especially very skewed ones — could have a larger impact. This must be investi-gated further.
5.3. General conclusion
Stock modeling appears to be a useful proach for environmental policy making. The ap-proach of combining the inflow distribution with a delay and a life-span distribution to arrive at an estimate for the outflow distribution certainly works, although very little can be concluded about how realistic the results may be. The ap-proach must be tested with empirical data to obtain more insight.
References
Allenby, B.R., 1999. Industrial Ecology, Policy Framework and Implementation. Prentice Hall, New Jersey.
Ayres, R.U., 1989. Industrial metabolism. In: Ausubel, J., Sladovich, H. (Eds.), Technology and Environment. Na-tional Academy Press, Washington DC.
Ayres, R.U., Norberg-Bohm, V., Prince, J., Stigliani, W.M., Yanowitz, J.,1989. Industrial Metabolism, the Environ-ment, and Application of Materials-Balance Principles for Selected Chemicals. IIASA report RR-89-11, Laxenburg, Austria, vi + pp. 118.
Ayres, R.U., Simonis, U.K., 1994. Industrial Metabolism, Restructuring for Sustainable Development. United Na-tions University Press, Tokyo, pp. 376.
Ayres, R.U., Ayres, L.W., 1996. Industrial Ecology: Towards Closing the Materials Cycle. Edward Elgar Publishers, pp. 379.
Baccini, P., Bader, H.-P., 1996. Regionaler Stoffhaushalt. Spektrum Akademischer Verlag, Heidelberg, Germany, pp. 420.
Bergba¨ck, B., Lohm, U., 1997. Metals in Society. In: Brune, Chapman, Gwynne, Pacyna (Eds.), The Global Environ-ment. Scandinavian Science Publisher, Wiley-VCH. Bringezu S., Kleijn R., 1997. Short Review of the MFA work
presented. In: Bringezu, S., Moll, S., Fisher Kowalski, M., Kleijn, R., Palm, V. (Eds.), Regional and National Mate-rial Flow Accounting, ‘From Paradigm to Practice of Sustainability’. Proceedings of the 1st ConAccount Work-shop 21 – 23 January, at Leiden. Wuppertal Institute, Wup-pertal, Germany: 306 – 308.
Boelens, J., Olsthoorn, A.A., 1998. Software for material flow analysis. In: Vellinga, P., Berkhout, F.and, Gupta, J. (Eds.), Sustainable Sustainability. Kluwer Publishers, Dor-drecht, The Netherlands.
Born J.P.G., 1992. On the formation of dibenzo-p-dioxins and dibenzofurans in combustion processes. Thesis, Leiden University, Leiden, The Netherlands, pp. 243.
Brunner, P.H., Baccini, P., 1992. Regional Materials Manage-ment and EnvironManage-mental Protection. Waste Manag. Res. 10, 203 – 212.
Gabathuler C., Wu¨est H., 1984. Bauliche Ressourcen und ihre Benu¨tzung, Lagebeurteilung und mogliche Ve-randerungspotentiale (Resources in the Building sector and their meaning, assessment of their location and possible potential for changes) ETH Forschungsbericht MANTO, Zwischenbericht 2, Spezialstudie 2.23, ETHZ, Zurich, Switzerland.
Graedel T.E., Allenby B.R., 1995. Industrial Ecology. Prentice Hall, New Jersey, pp. 412.
Guine´e, J.B., van den Bergh, J.C.J.M., Boelens, J., Fraanje, P.J., Huppes, G., Kandelaars, P.P.A.A.H., Lexmond, Th.M., Moolenaar, S.W., Olsthoorn, A.A., Udo de Haes, H.A., Verkuijlen, E., E. van der Voet, 1999. Evaluation of metal flows and accumulation in economy and environ-ment. Ecological Economics, in press.
Huele R., Kleijn R., 1997. Signal Processing — a Useful Mathematical Technique in MFA. In: Bringezu, S., Moll, S., Fisher Kowalski, M., Kleijn, R., Palm, V. (Eds.), Regional and National Material Flow Accounting, ‘From Paradigm to Practice of Sustainability’. Proceedings of the 1st ConAccount Workshop 21 – 23 January, Leiden. Wup-pertal Institute, WupWup-pertal, Germany: 93 – 95.
Huppes, G., van der Voet, E. and Huele R., 1997. Degrees of Immobilization: a Matter of Time. In: Bringezu, S., Moll, S., Fisher Kowalski, M., Kleijn, R., Palm, V. (Eds.), Regional and National Material Flow Accounting, ‘From Paradigm to Practice of Sustainability’. Proceedings of the 1st ConAccount Workshop 21 – 23 January, Leiden. Wup-pertal Institute, WupWup-pertal, Germany: 252 – 259.
Jelinski, L.W., Graedel, T.E., Laudise, R.A., McCall, D.W., Patel, C.K.N., 1992. Industrial Ecology: Concepts and approaches. Proceedings of a colloquium ‘Industrial Ecol-ogy’ organized by C. Kumar, N. Patel, May 20-21 1991, at National Academy of Sciences, Washington DC. Proc. Natl. Acad. Sci. USA, vol. 89, 793 – 797.
Kanters, M.J., 1996. Chlorination in combustion processes. Thesis, Leiden University, Leiden, The Netherlands, pp. 158.
Kleijn, R., van der Voet, E., 1998. Chlorine in Western Europe, A MacTempo case study. CML, Leiden, The Netherlands, pp. 55.
Kneese, A.V., Ayres, R.U., d’Arge, R.C., 1970. Economics and the Environment. Resources for the Future, Washing-ton DC, pp. 120.
Materials Accounting as a Tool for Decision Making in Environmental Policy. 4th European Commission Pro-gramme for Environment and Climate. Institute for Water Quality and Waste Management, Vienna University of Technology, Vienna, Austria, pp. 129.
Patel, M.K., 1997. Plastics in Germany — an analysis of production consumption and waste generation. Draft paper Fraunhofer-lnstitute ISI, Karlsruhe, Germany.
Socolow, R., Andrews, C., Berkhout, F., Thomas, V., 1994. Industrial Ecology and Global Change. Cambridge Univer-sity Press, Cambridge.
Sto¨cker, H., 1995. Taschenbuch mathematischer Formeln und moderner Verfahren. 3tte Auflage. Verlag Harri Deutsch, Thun u. Frankfurt am Main, Germany.
Tukker, A., Kleijn, R., van Oers, L., Smeets, E.R.W., 1996. A PVC substance flow analysis for Sweden. TNO-report STB/
96/48 part I to IV, TNO, Apeldoorn, The Netherlands, 51, 81, pp. 75 – 78.
van der Voet, E., 1996. Substances from cradle to grave — development of a methodology for the analysis of substance flows through the economy and the environment of a region. Thesis, Leiden University, Leiden, The Netherlands, pp. 348.
.