A SUPERVISED METHOD FOR OBJECT-BASED 3D BUILDING CHANGE DETECTION
ON AERIAL STEREO IMAGES
R. Qin a,*, A. Gruen a
a Singapore ETH Centre, Future Cities Laboratory, 1 CREATE Way, #06-01 CREATE Tower, Singapore 138602 – (rqin@student, [email protected])
Commission III, WG III/3
KEY WORDS: Change detection, Aerial images, Digital Surface Models, Support Vector Machine.
ABSTRACT:
There is a great demand for studying the changes of buildings over time. The current trend for building change detection combines the orthophoto and DSM (Digital Surface Models). The pixel-based change detection methods are very sensitive to the quality of the images and DSMs, while the object-based methods are more robust towards these problems. In this paper, we propose a supervised method for building change detection. After a segment-based SVM (Support Vector Machine) classification with features extracted from the orthophoto and DSM, we focus on the detection of the building changes of different periods by measuring their height and texture differences, as well as their shapes. A decision tree analysis is used to assess the probability of change for each building segment and the traffic lighting system is used to indicate the status “change”, “non-change” and “uncertain change” for building segments. The proposed method is applied to scanned aerial photos of the city of Zurich in 2002 and 2007, and the results have demonstrated that our method is able to achieve high detection accuracy.
1. INTRODUCTION
Monitoring and assessing the building changes are important tasks. On one hand, it is a crucial step for updating the geo-databases, on the other hand, the building change itself is of very much interest for urban related application such as building dynamic analysis, building code compliance and building material flow estimation.
Change detection techniques using two-dimensional (2D) low resolution images are intensively studied for assessing changes at the landscape level (Rogan et al., 2002; Song et al., 2001). Due to the lack of height information, such methods confront problems with illumination discrepancy, and perspective distortion for high resolution images (Qin et al., 2013). The recent works have incorporated DSM (Digital Surface Model) for change detection on the building levels with very high resolution (VHR) remote sensing data (Dini et al., 2012; Rottensteiner, 2008), as well as works at the street level (Qin and Gruen, 2014).
The comparison of DSMs were conducted by the subtraction of DSMs from two period for volumetric analysis by several studies (Gong et al., 2000; Martha et al., 2010). Sasagawa et al. (2013) applied shift-based least squares matching to examine the intensity differences of the ALOS-PRISM orthophotos, and the intensity difference computation was treated symmetrically, thus to reduce the effect of the illumination differences. The DSM difference was computed in pixel-wise. A final step of polygon extraction grouped the pixel-wise intensity and height differences, which were presented separately in the final change map.
Dini et al. (2012) proposed pixel-based approaches by differentiating the derived normalized DSMs (nDSM) generated from IKONOS and GeoEye stereo pairs, and then height difference map was refined with post-filtering techniques. Similarly, Chaabouni-Chouayakh and Reinartz (2011) proposed a post-classification method by first truncating the height differences with a given threshold, and then applied supervised post-classification methods based on various shape features to eliminate false-positives from trees.
Pixel-based methods are usually sensitive to the quality of images and DSM, while object-based methods are more robust towards this problem. Tian et al. (2013) proposed a region-based method to compare height and image intensity difference on groups of pixels (segments) for detecting the changes of forest and buildings with Cartosat-1 stereo pairs. The change vector analysis (CVA) was used to fuse the contribution of height and intensity differences.
Rottensteiner (2008) used the combination of multi-spectral images to update the geo-database, where the multispectral images were mainly used for extracting vegetation index, and the resulting buildings changes were specified as “demolished”, “new” and “changed”.
it is also crucial to find a good way to distinguish the unwanted changes (blunders from DSMs or seasonal variation of the vegetation). The post-filtering strategy sometimes is limited by the quality or availability of vegetation index, as well as the lack of urban class information. Therefore, we propose to pre-classify the ground scene using the image and DSM, and then to apply object-based change detection method on the building class, taking into account their height and textural difference, as well as their shape discrepancies. The advantage of this idea lies in the fact that, by knowing the building classes, we are able to consider the shape differences of buildings. The building segments provide appropriate regions to robustly evaluate the height and texture difference. Moreover, the spectral and height information of buildings can be learned from the data itself, which is widely evaluate the performance of the proposed method. The remainder of the paper is organized as follows: section 2 describes the general workflow and the preprocessing of the stereo pairs. Section 3 and section 4 introduce the detailed methodology and section 6 demonstrates the experiment results. Section 6 concludes the paper.
2. GENERAL WORKFLOW AND DATA
PREPROCESSING
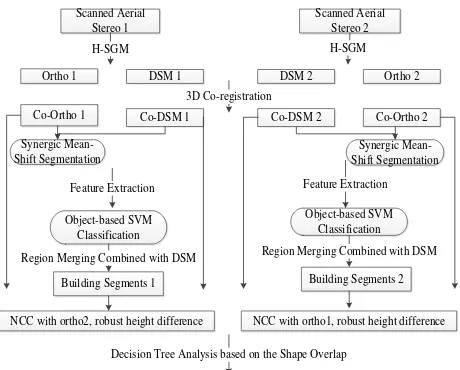
The overall workflow of our proposed method is shown in Figure 1. The scanned aerial stereo pairs are provided by SWISSTOPO (Swisstopo, 2014), together with their orientation parameters, with an average GSD (ground sample distance) of 0.38 meters. The DSMs are generated with hierarchical semi-global matching (H-SGM) (Hirschmuller, 2008; Rothermel et al., 2012). Since the scanned aerial photo usually contains noise during the digitization process, we adopted a bilateral filter (Tomasi and Manduchi, 1998) with a small radius (3 × 3) to de-noise the image before perform H-SGM on the stereo pairs. The generated point clouds are sampled in a regular grid with a GSD of 0.4 m. To eliminate the possible registration errors between the DSMs from two dates, we employ a least squares 3D matching (LS3D) method (Gruen and Akca, 2005), with only shift parameters considered, since the rotation differences are usually not significant. The quality of the co-registered DSM can be assessed by evaluating the height differences of the unchanged area. We have evaluated an area with no visible changes. The RMSE (root mean square error) and standard deviation (STD) of the height are 2.43m and 2.37m, respectively. The profile comparison in Figure 2 also shows that the errors usually happen at the building borders. There are also Region Merging Combined with DSM Region Merging Combined with DSM
Demolished Buildings, New Buildings Co-DSM 1
Co-Ortho 1 Co-DSM 2 Co-Ortho 2
3D Co-registration
Feature Extraction
NCC with ortho2, robust height difference NCC with ortho1, robust height difference
Decision Tree Analysis based on the Shape Overlap
Figure 1. The workflow of the proposed method.
Figure 2. The profile analysis of height differences of DSM. Upper left: an unchanged area, and the red line denotes the analyzed profile; Bottom left: height difference; Right: DSM
comparison of the profile.
3. SUPERVISED CLASSIFICATION AND BUILDING DETECTION
As discussed in section 1, our goal is to first perform the supervised classification to derive the building classes. Since the pixel-based classification is sensitive to noise and potentially requires a large amount of computation for VHR images with large dimension. Therefore, we apply an object-based classification method by segmenting the orthophoto first, and then apply the feature extraction and classification on the resulting segments.
3.1 Image Segmentation
The synergic mean-shift (MS) method (Christoudias et al., 2002) is applied to perform the segmentation, which explicitly employs the weight of the image boundary to constrain the classic mean-shift segmentation, leading to more meaningful segments. Instead of imposing constraints the MS segmentation with the image gradient, we constrain it with the height discontinuity: the Canny gradient magnitude (Canny, 1986) of the DSM is computed as the boundary probability to weight each pixel during the segmentation process. This is particular useful in area with large height jumps but insignificant spectral differences.
3.2 Feature Extraction and Classification
TheSupport Vector Machine (SVM) classifier is widely used in many machine learning applications. It is originally designed for binary classification problems, which finds a hyper plane that maximizes the distance between the training samples of each class.
We adopt the “one-against-all” (OAA) approach for multi-classification problem and the “Radial Basis Function” (RBF) is used as the kernel function.
Since we focus on the building class and other classes are used to eliminate possible disturbances from the vegetation and roads. We
only define three classes “building”, “road”, “vegetation”, and select more training samples for the building classes. The input features are extracted with each resulting segment from section 3.1, and the following features are computed for each segment:
1) Mean color/spectral (in CIELAB color space for RGB images);
2) Variance of luminance;
3) Mean value of the morphological top-hat reconstruction of DSM;
4) Variance of the DSM;
5) Elongation of each segment (the ratio between the minor axis and the major axis of the ellipse fitting).
These features are concatenated into a five dimensional vector, and each element in the vector are normalized into [0, 1] in order to contribute equally to the process of classification. The mean color of each segment is effective to distinguish house roofs and vegetation. The top-hat reconstruction of DSM is effective to separate the ground with off-terrain objects. The variances of luminance and DSM are used to separate the vegetation and impervious surfaces, especially for images with poor spectral signature for the urban classes. The elongation measure senses the shape of the segment, which is effective to distinguish road and building roofs with similar spectral signature as the ground.
3.3 Building Segment Merging
Each segment reveals similar color and height, and it is possible that one actual building segment may be divided into several segments during the segmentation process, thus we merge the detected building segments with their neighboring building segments that have similar height. For our experiment, the neighboring segments whose height differences are less than 1 meter height will be merged as one building segment.
It should be noted that we tolerate false positives from the ground/road segments, as the main purpose of the supervised classification is to eliminate the vegetation. Moreover, the ground segments usually have large size and are less probable to produce false positives. Therefore, under our context, the samples of the building roof spectra should be sufficient to cover most of the roofs, and the number of vegetation and road samples can be very small.
4. OBJECT-BASED CHANGE DETECTION
The change detection method is based on the building segments detected from each date. The region-based change detection methods compare the height and textural differences within segments that have homogenous color, while building segments provide more information: the shape of each building segment
from each date is meaningful, and the unchanged buildings should have similar segments in both dates.
To better utilize the property of building segments, our proposed change detection method is divided into two steps: 1) initial change indicator computation for each date; 2) change indicator updating based on segment overlap.
4.1. Initial Change Indicator Computation
A first step is to assess the change information from the orthophotos and the corresponding DSMs. As mentioned before, the initial change indicator will be computed for each segment on each date, and it should be designed to maximally exploit the textural and height information while maintaining the robustness.
Since the color information of the aerial photos may be affected strongly due to the differences of the atmospheric condition, illumination, etc., simple Euclidean distance between the color information from two dates will result in many false positives. Therefore, for each segment, we compute the normalized correlation coefficient (NCC) of its out-fitting box, and take the maximum of the NCCs by shifting the rectangular box within a 5 X 5 window to reduce misalignment of the orthophotos. The NCC is robust for radiometric difference and useful for highlighting the textural differences.
The height difference is computed within each building segments. As discussed in section 2, most of the matching errors occur at the border of the buildings. Therefore, we first compute the histogram of the height difference for each building segment, and then calculate the mean height of pixels that are larger than 10% of the total pixels in the histogram. To represent the height difference in a robust way and further fuse with the NCC value, we divide the height difference of each building segment with a fixed basic height as the normalized height difference of the segment:
(1)
Thus the change indicator can be written as a weighted form:
(2)
In our experiment, we take , and these parameters can be adjusted due to the quality and resolution of the data.
4.2 Change Indicator Updating based on Segment Matching
The initial change indicator reveals the probability of change based on their height and textural differences, and this indicator might contain errors, which lead to false positives for most of the cases. To enhance the separability of the change and unchanged segments, we check the overlap of the building segments from both dates, and a decision process is adopted to re-compute the value of the change indicator according to their overlaps.
updating the value of the change indicators based on the overlap of the building segments from both dates.
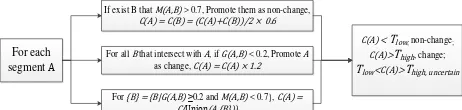
For a segment in one date and segment in the other date, we segments that find highly overlapped building segments (high ), and increase the value by 20% if they do not find any segments with overlaps (low ). For buildings partly overlapped, their change indicators will be assigned as the change indicator of the joint segments. Figure 3 shows the process.
For each segment A
If exist B that M(A,B) > 0.7, Promote them as non-change,
C(A) = C(B) = (C(A)+C(B))/2 × 0.6
Figure 3. The workflow of the decision tree analysis.
The updating process is done for all the building segments, and buildings. Overlapping building segments with different status are
promoted as “change” buildings if one of them has “change”
status. In our experiment, the thresholds are:
, which are selected by empirical tests.
5. EXPERIMENT AND RESULT ANALYSIS
Two pairs of scanned stereo aerial photos are used to valid the proposed methods. For computational convenience, a sub-area of 2000 × 2000 pixels is used for our experiment, which covers residential and commercial buildings. Overviews of the data are shown in Figure 4.
It can be seen that there is a clear seasonal difference between the two datasets. Since there is no near-infrared band for the scanned photos, the vegetation can only be detected via their color information and DSM. The relative weak spectral signature of the objects in date 2 may not be sufficient to identify the vegetation area by mere greenness. Therefore, the supervised classification is needed to find the vegetation area by learning the characteristics of the scene.
5.1 Classification
Three classes (“building”, “road” and “vegetation”) are used for classification. The statistics of the classification are shown in
(AS: all segments; BSS: building sample segments for training; RSS: road sample segments for training; TSS: tree sample segments for training; TB: test samples for building; OA: overall accuracy; BA: Building class accuracy)
Due to the weak spectral variability of the image in date 2, the resulting number of segments is much less than that from date 1, where the segmentation is performed with the same set of parameters. The OA and BA are also lower than those of date 1. Based on the test samples, we obtained acceptable classification accuracy for building.
5.2 Change Detection
The change detection result was evaluated using the reference data, which was manually marked by careful inspection. Since our proposed method yields “uncertain changes” which should be determined by the operator, therefore we only evaluate the
“changed buildings” and “unchanged buildings” for our validation.
TPR (true positive rate), FPR (false positive rate), FNR (false negatives rate), and KC (kappa coefficient) are computed based on the detected changes and the reference data.
(6) agreement between detected results and the ground truth.
Table 2 shows that the proposed method has obtained a TPR of 85.65 percent in pixel-wise evaluation, which shows an acceptable agreement between the detected results and the reference data. In the object-based evaluation, 25 out of 27 changed segments are detected, and the other two are marked as
“uncertain” changes for evaluation. The proposed method has detected 44 segments in total (including “uncertain change” and
“change”), and 18 segments are marked as “uncertain changes” for operators to check, which demonstrate its potential to reduce the labor cost for urban monitoring.
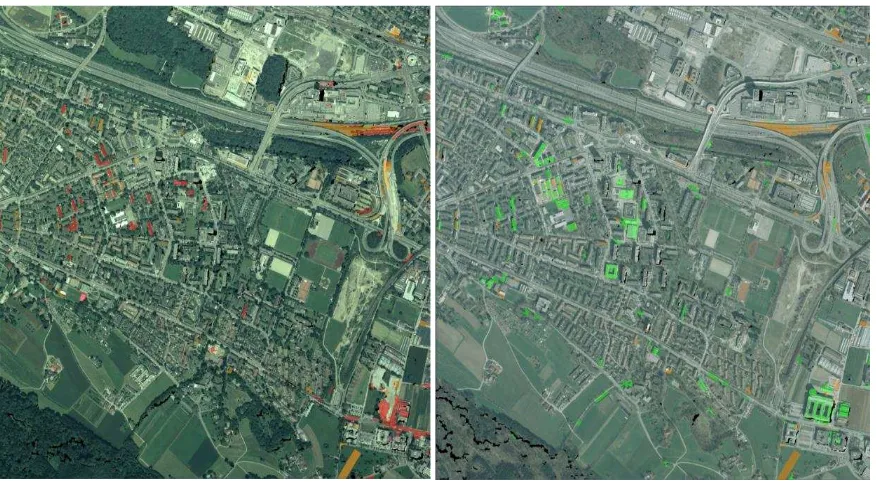
Figure 3 shows the change detection results of our method. It can be observed that almost all the significant changes are detected, and false positives mainly occur at places that vegetation are wrongly identified as buildings. Figure 4 shows that the proposed method not only detects the changed place, but also separates the
changes between “demolished buildings” and “new buildings”,
Figure 4 demonstrates the results of a larger area (5000 × 5000). The same set of parameters/ thresholds are applied on this dataset. By visual inspection, most the significant changes are detected, and there are some non-change segments, which are mainly induced by the matching artifacts, and classification errors.
6. CONCLUSION
In this paper, we have proposed a supervised method for building change detection, and scanned aerial stereo pairs are used for validating our method. The proposed method first detects the
building segments in both dates, and then integrates the height difference, spectral difference, and the segments overlap for change detection. The results have demonstrated the proposed method has achieved satisfactory results. However, the classification result is one of the decisive factors for the change detection, and missing buildings might not be detected as changes. The future work will focus on automating the proposed method; in the meantime reduce the change detection errors.
Figure 3. The experiment result. Left: orthophoto in the year 2002; middle: orthophoto in the year 2007; right: change detection results (red: demolished: green: new building; orange: uncertain changes).
Figure 4. The result of a large area: Left: orthophoto in the year 2002; middle: orthophoto in the year 2007; (red: demolished: green: new building; orange: uncertain changes).
AKNOWLEGEMENTS
REFERENCES
Canny, J., 1986. A computational approach to edge detection.
IEEE Transaction on Pattern Analysis and Machine Intelligence
(6), 679-698.
Chaabouni-Chouayakh, H. and P. Reinartz, 2011. Towards automatic 3D change detection inside urban areas by combining height and shape information.
Photogrammetrie-Fernerkundung-Geoinformation 2011 (4), 205-217.
Christoudias, C. M., B. Georgescu and P. Meer, 2002. Synergism in low level vision. In: 16th International Conference on
Proceedings of Pattern Recognition, pp. 150-155.
Dini, G., K. Jacobsen, F. Rottensteiner, M. Al Rajhi and C. Heipke, 2012. 3D Building Change Detection Using High Resolution Stereo Images and a GIS Database. ISPRS-International Archives of the Photogrammetry, Remote Sensing
and Spatial Information Sciences 1 299-304.
Gong, P., Greg.S. Biging and R. Standiford, 2000. Technical Note: Use of Digital Surface Model for Hardwood Rangeland
Monitoring. Journal of Range Management 53 (6), 622-626. Gruen, A. and D. Akca, 2005. Least squares 3D surface and curve matching. ISPRS Journal of Photogrammetry and Remote Sensing
59 (3), 151-174.
Hirschmuller, H., 2008. Stereo processing by semiglobal matching and mutual information. IEEE Transactions on Pattern
Analysis and Machine Intelligence 30 (2), 328-341.
Martha, T. R., N. Kerle, V. Jetten, C. J. van Westen and K. V. Kumar, 2010. Landslide volumetric analysis using Cartosat-1-derived DEMs. IEEE Geoscience and Remote Sensing Letters 7 (3), 582-586.
Qin, R., J. Gong, H. Li and X. Huang, 2013. A Coarse Elevation Map-based Registration Method for Super-resolution of Three-line Scanner Images. Photogrammetric Engineering and Remote
Sensing 79 (8), 717-730.
Qin, R. and A. Gruen, 2014. 3D change detection at street level using mobile laser scanning point clouds and terrestrial images.
ISPRS Journal of Photogrammetry and Remote Sensing 90 23-35.
Rogan, J., J. Franklin and D. A. Roberts, 2002. A comparison of methods for monitoring multitemporal vegetation change using Thematic Mapper imagery. Remote Sensing of Environment 80 (1), 143-156.
Rothermel, M., K. Wenzel, D. Fritsch and N. Haala, 2012. SURE: Photogrammetric Surface Reconstruction from Imagery. In:
Proceedings LC3D Workshop, Berlin, pp.
Rottensteiner, F., 2008. Automated updating of building data bases from digital surface models and multi-spectral images: Potential and limitations. The International Archives of Photogrammetry, Remote Sensing and Spatial Information
Sciences 37 (Part B3a), pp. 265-270.
Sasagawa, A., E. Baltsavias, S. K. Aksakal and J. D. Wegner, 2013. Investigation on automatic change detection using pixel-changes and DSM-pixel-changes with ALOS-PRISM triplet images.
ISPRS-International Archives of the Photogrammetry, Remote
Sensing and Spatial Information Sciences 1 (2), 213-217.
Song, C., C. E. Woodcock, K. C. Seto, M. P. Lenney and S. A. Macomber, 2001. Classification and change detection using Landsat TM data: when and how to correct atmospheric effects?
Remote Sensing of Environment 75 (2), 230-244.
Swisstopo, 2014. Aerial Photographs and Satellite Images,
http://www.swisstopo.admin.ch/internet/swisstopo/en/home/servi ces/images.html. (Accessed on July 23, 2014)
Tian, J., P. Reinartz, P. d’Angelo and M. Ehlers, 2013. Region -based automatic building and forest change detection on Cartosat-1 stereo imagery. ISPRS Journal of Photogrammetry and Remote
Sensing 79 226-239.
Tomasi, C. and R. Manduchi, 1998. Bilateral filtering for gray and color images. In: International Conference on Computer