INTERACTIVE CLASSIFICATION OF CONSTRUCTION MATERIALS: FEEDBACK
DRIVEN FRAMEWORK FOR ANNOTATION AND ANALYSIS OF 3D POINT CLOUDS
M. R. Hessa,∗, V. Petrovicb, F. Kuestera
a
Dept. of Structural Engineering, University of California, San Diego, USA - (mrhess, fkuester)@ucsd.edu b
Dept. of Computer Science and Engineering, University of California, San Diego, USA - [email protected]
Commission VI, WG VI/4
KEY WORDS:Point Cloud, Visualization, Interactive, Annotation, Classification
ABSTRACT:
Digital documentation of cultural heritage structures is increasingly more common through the application of different imaging tech-niques. Many works have focused on the application of laser scanning and photogrammetry techniques for the acquisition of three-dimensional (3D) geometry detailing cultural heritage sites and structures. With an abundance of these 3D data assets, there must be a digital environment where these data can be visualized and analyzed. Presented here is a feedback driven visualization framework that seamlessly enables interactive exploration and manipulation of massive point cloud data. The focus of this work is on the classification of different building materials with the goal of building more accurate as-built information models of historical structures. User defined functions have been tested within the interactive point cloud visualization framework to evaluate automated and semi-automated clas-sification of 3D point data. These functions include decisions based on observed color, laser intensity, normal vector or local surface geometry. Multiple case studies are presented here to demonstrate the flexibility and utility of the presented point cloud visualization framework to achieve classification objectives.
1. INTRODUCTION
Laser scanning and photogrammetry techniques have been used extensively for the acquisition of three-dimensional (3D) geom-etry of cultural heritage sites and structures. Existing structures, especially historical buildings which have existed for centuries, have undergone changes including additions, floor plan modifi-cations, and physical alterations to original building materials. One crucial step to take before making assessments or decisions concerning preservation or restoration is to document what cur-rently exists. Photogrammetry and laser scanning provide initial geometric information that can be visualized and analyzed, and these data can also serve as a scaffold for derivative data layers. Just as an architect would traditionally annotate an engineering drawing of a building, these 3D models should be annotated to provide additional information to aid in the interpretation of the structures state of health as well as decisions concerning its fu-ture. A natural first step in this process is to classify the structures construction materials into different categories.
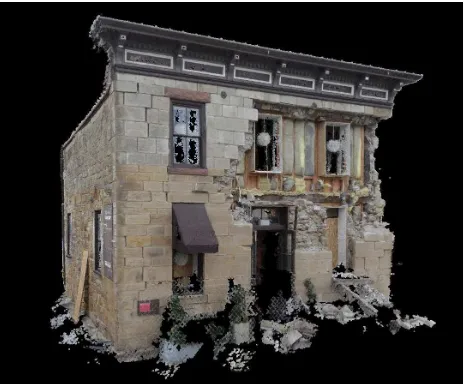
Presented here is a feedback driven visualization framework (Petro-vic et al., 2014, Petro(Petro-vic et al., 2011) that seamlessly enables interactive exploration and manipulation of massive point cloud data (Figure 1). There are countless objectives that can be achieved through the acquisition, visualization and analysis of point clouds. The focus of this work is on the classification of different building materials with the goal of building more accurate as-built mod-els of historical structures. Varying user defined functions will be tested within the interactive point cloud visualization frame-work to evaluate automated and semi-automated classification of 3D point data. These functions can include decisions based on observed color, laser intensity, normal vector or local surface ge-ometry.
∗Corresponding author
Figure 1. Photogrammetric point cloud in visualization engine
as dynamically changing tags. The operating scenario considers a field expert as the user and the functions are designed by the user to achieve their objectives. Utilizing the experts guided input, the system then performs automated routines to refine the clas-sification. This semi-automated hybrid approach to classifica-tion allows more complicated features to be extracted and anno-tated through interactive feedback. The visual feedback achieved through the visualization system, allows for the user to more ac-curately refine the functions being executed to optimize the auto-mated portion of the process.
Previous works have discussed the benefits of these 3D data as-sets for documentation objectives, measurements, and quantified analyses (Pesci et al., 2012, Guidi et al., 2014, Hess et al., 2015, Volk et al., 2014). Explored here is how to bridge the gap from digital documentation towards Historical Building Information Models (HBIM) (Quattrini et al., 2015, Oreni et al., 2014) that not only capture the current state of a structure, but also break down the virtual structure into its components. A vast majority of historical structures that still exist today are masonry construc-tions, so the focus of this work is to achieve the classification of the observed masonry materials through the analysis of 3D data derived from laser scanning or photogrammetric techniques.
Multiple examples are presented here to demonstrate the flexibil-ity and utilflexibil-ity of the presented point cloud visualization frame-work to achieve classification objectives. The presented datasets were generated through laser scanning, photogrammetry, or a combination of the two techniques. The included examples fo-cus on the classification of construction materials used in cultural heritage structures. Specifically this work demonstrates multi-ple approaches to automatically and semi-automatically classify masonry structures into their stone and mortar counterparts. The accurate geometric classification of existing masonry materials will aid in more realistic numerical simulations of a structure in order to plan for preservation and restoration actions.
Observations that can be quantified in this case study include the average sizes of masonry units and mortar joints, variation and distribution of those dimensions, in addition to overall masonry patterning. The goal of this study is to discourage general as-sumptions that can be made concerning the local geometry and uniformity of masonry constructions. In other words, highlighted here is a methodology to capture the as-built structural state. Al-though, in some cases, assumptions concerning masonry geom-etry may not lead to vastly different conclusions, the capability to accurately document the geometry exists and should become standard practice in order to more precisely assess a structures state of health.
2. BACKGROUND
Digital documentation has been widely implemented in the field of cultural heritage and there are many applications of the deriva-tive data. The focus here is on the utility of three-dimensional (3D) data acquired at cultural heritage sites. The uses for these data have elevated from simple documentation for posterity (Ikeuchi et al., 2003, Guarnieri et al., 2004) all the way to numerical struc-tural simulations of entire complex structures (Crespi et al., 2015). The idea of Historic building information modelling (HBIM) has been developed (Murphy et al., 2009) with the idea of gathering survey data with remote imaging techniques in order to build 3D models that capture the geometry of the existing structure along with other types of information. Building information models
(BIM) are typically used for new construction, but there is a sig-nificant benefit in using it for preservation and restoration pur-poses.
Previous works have started to add intelligence to these types of HBIM models through recognition and modeling of architec-tural and strucarchitec-tural components (Murphy et al., 2013, Oreni et al., 2014, Dore and Murphy, 2013). The creation of HBIMs can aid in the creation of construction drawing, documentation of exist-ing damages, plannexist-ing restoration activities, and eventually finite and discrete element modeling for the most accurate numerical simulation of existing structures. The two major gaps that this work looks to address are: 1) the simplification of geometric ir-regularities and 2) the 3D classification of masonry construction. Through the implementation of user guided annotation, dense 3D point clouds can be classified interactively both manually and semi-automatically.
Previous works have attempted masonry classification from a few different approaches. There are many that have used image pro-cessing techniques to isolate masonry stones from mortar (Del Pozo et al., 2015, Dimitrov and Golparvar-Fard, 2014), but there can be issues due to lighting, irregular stone shapes and patterns as well as varying construction phases and styles. Others have utilized laser scanning techniques with the attempt of overcoming some of the problems encountered when simplifying the problem to two dimensions (Sithole, 2008, Riveiro et al., 2016). Even when using 3D data there are difficulties to overcome when attempting to automate classification of a construction technique that varies significantly in time, region, and materials.
Explored here is how to build Historical Building Information Models that break down the virtual structure into its components and maintain the complexity of an existing historical structure. In order to preserve the irregularities and complexities, point cloud data is utilized in order to maintain a superior level of accuracy detail as compared to meshing methods. The interactive nature of the presented approach provides real-time feedback to the user in order to more accurately classify the construction materials and fine tune the classification methods through user customiz-able JavaScript code.
3. PRESENTED APPROACH
The goal of the presented approach is to utilize valuable user in-tuition and input in order to classify 3D masonry material faster and more accurately. The approach uses a ”paint brush”, as seen in Figure 2, that interactively operates on a selected sphere of points within the point cloud. The size of the sphere used to query the points is adjustable and can be changed dynamically. The operations that are performed within the brushing sphere are designed through a real-time updated JavaScript framework that communicates with the visualization engine in order to pass and execute the point data queries. Attributes of the points such as co-ordinates, color, normal and intensity can each be accessed and utilized in the JavaScript functions.
Figure 2. Example of the interactive annotation used on dense point cloud
used due to the different phases of construction as well as the varying styles and colors used in the execution of the masonry facade.
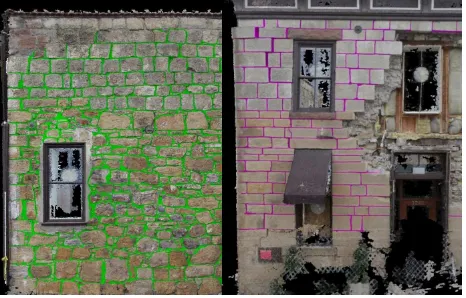
The first step of the presented example was to create a ground truth to compare our semi-automated tests against. The mortar in the front and the side of the building were manually annotated, or tagged, with pink and green respectively (seen in Figure 3). This ground truth tagging has three areas of style and color that each present their own challenges. The lower portion of the side wall is very irregular in pattern, constructed with stones that have a very different color than the mortar material and the topography of the mortar is very well defined. The topography of the mor-tar in the upper portion of the side wall is also reasonably well defined, but the colors of the stone and mortar are very similar. As for the front of the building, the construction is very regular with small mortar joints that as similar in color and do not have a very pronounced geometric pattern. Even though this ground truth creation required two and a half hours, the interactive ma-nipulation of the point cloud made it extremely easy to select neighborhoods of points corresponding to mortar. The resulting annotation is an extremely accurate classification of the existing mortar pattern and 3D geometry. Although this initial process was completely manual, when compared to traditional drafting techniques, the time spent was not significant and the accuracy achieved is much greater.
Figure 3. Ground truth tagging of the mortar
Next, a semi-automatic JavaScript function was developed and tested in order to make annotation of the mortar easier for the used by adding some intelligence to the interactive brush. The initial iteration of the mortar brush utilizes the color and normal of the points in order to make decisions based on local statis-tics. For each bundle of points located in the selective sphere of
the brush, statistics of the color and normal are computed. This method assumes that the center of the initial brush click is what the user desires to be tagged. From there, the visualization system steps out from the center point by point and compares the normal and color of the current point to the color and normal of the center point of the initial selection. Based on the color statistics and an allowable variance in the angle of the normal, the script decides if the current point belongs to stone or mortar.
Through testing, initial parameters were chosen so that mortar was classified if the color and normal thresholds were both sat-isfied. For the color constraint, the current point must be within three standard deviations from the initial point color, based on the local neighborhood statistics. Given the initial reference normal direction and a maximum permissible deviation angle, a candi-date point is accepted if the angle between its normal and the reference direction is smaller than the threshold deviation angle. In particular, a normal is accepted if its dot product with the ref-erence normal is greater than the cosine of the threshold angle.
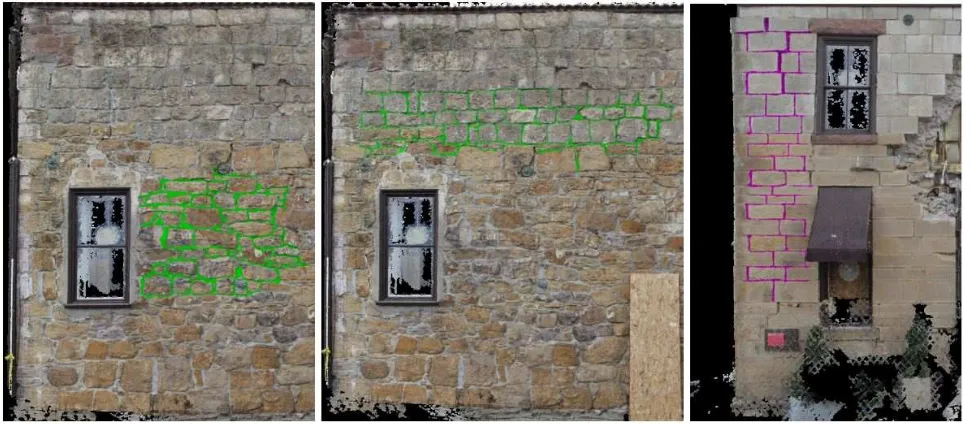
As seen in Figure 2, although many points are queried, only the points corresponding to mortar material are tagged due to the thresholding function defined in the JavaScript. This brush was utilized in three areas with the three different construction styles previously mentioned in order to compare the performance of the brush function under varying colors and normal values. Ten min-utes was allocated for each test in which the user classified as much mortar material as possible with the scripted brush. The real-time feedback of the visualization system, which colors the tagged points, allows the user to revisit areas that have not been sufficiently tagged.
Figure 4. Example of the interactive annotation used on dense point cloud
Figure 5. Ground truth tagging of the mortar
4. CONCLUSIONS
The initial implementation of the presented semi-automated in-teractive classification of masonry point clouds was effective in speeding up the process with limited repercussions in terms of ac-curacy. Improvements will be made in the future to minimize the amount of false positives classified in the process as well as de-crease the amount of false negatives that are not classified along the way. Future efforts will be directed towards the integration of other methods and additional point attributes such as laser inten-sity when handling point clouds generating through laser scan-ning techniques. The flexibility of the scripting framework and its integration with the point cloud visualization system will have much broader implications and the presented case study is rela-tively simple example of the utility of such a robust system.
ACKNOWLEDGEMENTS (OPTIONAL)
This work was supported by the National Science Foundation under award #DGE-0966375, “Training, Research and Educa-tion in Engineering for Cultural Heritage Diagnostics,” and award #CNS-1338192, “MRI: Development of Advanced Visualization Instrumentation for the Collaborative Exploration of Big Data.” Additional support was provided by the Kinsella Fund, the Qual-comm Institute at UC San Diego, the Friends of CISA3, and the World Cultural Heritage Society. Opinions, findings, and conclu-sions from this study are those of the authors and do not neces-sarily reflect the opinions of the research sponsors.
REFERENCES
Crespi, P., Franchi, A., Ronca, P., Giordano, N., Scamardo, M., Gusmeroli, G. and Schiantarelli, G., 2015. From bim to fem: the analysis of an historical masonry building. WIT Transactions on The Built Environment149, pp. 581–592.
Del Pozo, S., Herrero-Pascual, J., Felipe-Garc´ıa, B., Hern´andez-L´opez, D., Rodr´ıguez-Gonz´alvez, P. and Gonz´alez-Aguilera, D., 2015. Multi-sensor radiometric study to detect pathologies in his-torical buildings.The International Archives of Photogrammetry, Remote Sensing and Spatial Information Sciences40(5), pp. 193.
Dimitrov, A. and Golparvar-Fard, M., 2014. Vision-based material recognition for automated monitoring of construction progress and generating building information modeling from un-ordered site image collections. Advanced Engineering Informat-ics28(1), pp. 37–49.
Dore, C. and Murphy, M., 2013. Semi-automatic modelling of building facades with shape grammars using historic building information modelling. ISPRS International Archives of Pho-togrammetry, Remote Sensing and Spatial Information Science
40, pp. 5.
Guarnieri, A., Vettore, A., El-Hakim, S. and Gonzo, L., 2004. Digital photogrammetry and laser scanning in cultural heritage survey. The International Archives of the Photogrammetry, Re-mote Sensing and Spatial Information Sciences35, pp. B5.
Guidi, G., Russo, M. and Angheleddu, D., 2014. 3d survey and virtual reconstruction of archeological sites.Digital Applications in Archaeology and Cultural Heritage1(2), pp. 55–69.
Hess, M., Petrovic, V., Meyer, D., Rissolo, D. and Kuester, F., 2015. Fusion of multimodal three-dimensional data for compre-hensive digital documentation of cultural heritage sites. In:2015 Digital Heritage, Vol. 2, IEEE, pp. 595–602.
Ikeuchi, K., Nakazawa, A., Hasegawa, K. and Ohishi, T., 2003. The great buddha project: Modeling cultural heritage for vr sys-tems through observation. In:Proceedings of the 2nd IEEE/ACM International Symposium on Mixed and Augmented Reality, IEEE Computer Society, p. 7.
Murphy, M., McGovern, E. and Pavia, S., 2013. Historic build-ing information modellbuild-ing–addbuild-ing intelligence to laser and image based surveys of european classical architecture. ISPRS journal of photogrammetry and remote sensing76, pp. 89–102.
Oreni, D., Brumana, R., Della Torre, S., Banfi, F. and Previtali, M., 2014. Survey turned into hbim: the restoration and the work involved concerning the basilica di collemaggio after the earth-quake (l’aquila). ISPRS Annals of the Photogrammetry, Remote Sensing and Spatial Information Sciences2(5), pp. 267.
Pesci, A., Bonali, E., Galli, C. and Boschi, E., 2012. Laser scan-ning and digital imaging for the investigation of an ancient build-ing: Palazzo daccursio study case (bologna, italy). Journal of Cultural Heritage13(2), pp. 215–220.
Petrovic, V., Gidding, A., Wypych, T., Kuester, F., DeFanti, T. A. and Levy, T. E., 2011. Dealing with archaeology’s data avalanche.Computer(7), pp. 56–60.
Petrovic, V., Vanoni, D. J., Richter, A. M., Levy, T. E. and Kuester, F., 2014. Visualizing high resolution three-dimensional and two-dimensional data of cultural heritage sites. Mediter-ranean Archaeology and Archaeometry14(4), pp. 93–100.
Quattrini, R., Malinverni, E., Clini, P., Nespeca, R. and Orlietti, E., 2015. From tls to hbim. high quality semantically-aware 3d modeling of complex architecture.The International Archives of Photogrammetry, Remote Sensing and Spatial Information Sci-ences40(5), pp. 367.
Riveiro, B., Lourenc¸o, P. B., Oliveira, D. V., Gonz´alez-Jorge, H. and Arias, P., 2016. Automatic morphologic analysis of quasi-periodic masonry walls from lidar. Computer-Aided Civil and Infrastructure Engineering31(4), pp. 305–319.
Sithole, G., 2008. Detection of bricks in a masonry wall. The International Archives of the Photogrammetry, Remote Sensing and Spatial Information Sciencespp. 1–6.