HETEROGENEITY INDEX FOR THE ASSESSMENT OF RELATIONSHIP BETWEEN
LAND USE PATTERN AND ROAD TRAFFIC CONGESTION IN
APAPA-OWOROSHOKI EXPRESS WAY, LAGOS METROPOLIS
D. B. Alaigba a, M. Soumah b , M. O. Banjo c
aDepartment of Geographic Information Science (GIS), African Regional Institute for Geospatial Science and Technology (AFRIGIST), formerly, Regional Centre for Training in Aerospace Surveys (RECTAS), PMB 5545, Ile-Ife, Nigeria, [email protected]; [email protected]
bDepartment of Photogrammetry and Remote Sensing (PRS), African Regional Institute for Geospatial Science and Technology (AFRIGIST), formerly, Regional Centre for Training in Aerospace Surveys (RECTAS), PMB 5545, Ile-Ife, Nigeria, [email protected]
cDepartment of Photogrammetry and Remote Sensing (PRS), African Regional Institute for Geospatial Science and Technology (AFRIGIST), formerly, Regional Centre for Training in Aerospace Surveys (RECTAS), PMB 5545, Ile-Ife, Nigeria, [email protected]
KEY WORDS: Traffic Congestion, Land-Use, Heterogeneity Index, AHP
ABSTRACT
The problem of urban mobility is complicated by traffic delay, resulting from poor planning, high population density and poor condition of roads within urban spaces. This study assessed traffic congestion resulting from differential contribution made by various land-uses along Apapa-Oworoshoki expressway in Lagos metropolis. The data for this study was from both primary and secondary sources; GPS point data was collected at selected points for traffic volume count; observation of the nature of vehicular traffic congestion, and land use types along the corridor. Existing data on traffic count along the corridor, connectivity map and land use map sourced from relevant authorities were acquired. Traffic congestion within the area was estimated using volume capacity ratio (V/C). Heterogeneity Index was developed and used to quantify the percentage contribution to traffic volume from various land-use categories. Analytical Hierarchical Processing (AHP) and knowledge-based weighting were used to rank the importance of different heterogeneity indices. Results showed significant relationship between the degree of heterogeneity of the land use pattern and road traffic congestion. Volume Capacity Ratio computed revealed that the route corridor exceeds its designed capacity in the southward direction between the hours of 8am and 12pm on working days. Five major nodes were analyzed along the corridor, and were all above the expected Passenger Car Unit (PCU), these are “Oshodi” 15%, “Airport junction” 10%, “Cele bus stop” 21%, “Mile 2” 14%, “Berger” 15% and “Tincan bus stop” 33% indicating heavy traffic congestion.
1. INTRODUCTION
Countries across globe are witnessing rapid urbanization, the intensity of which may differ according to the socio-economic and political conditions of respective nations. It is a general perception that urbanization refers to increased urban density and activities at the center of the city (Ojima and Hogan, 2009). Urbanization is an indicator of economic growth; however, the negative consequences of urban expansion on different aspects of society is undeniably obvious. The most primary and significant negative consequence of uncontrolled urbanization is rapid transformation in the land use pattern of an urban region (Cheng, 2003). Urban expansion is now regarded as a global phenomenon; cities of all sizes across the world are witnessing rapid urbanization (Alok et al., 2014). Different land use types characterize metropolitan cities and each of them is unique and has its own propensity to generate not only trips but also dictate
the pattern of development. Thus, transportation is a key land use factor in planning and development of cities.
economic development of any urban area, particularly a growing one like Lagos (Osoba, 2012). Traffic congestion occurs when volume of traffic on a particular road exceeds the capacity of that road to accommodate traffic flow, such that free flow (vehicular mobility) is hindered or slowed down. Rapid growth in motorization with less than corresponding improvement in the road network and related facilities, poor structural pattern of roads especially in the traditional area of cities and the unplanned growth and haphazard land-use distribution are all contributory factors to traffic congestion (Geshkov, 2010). Traffic congestion, is a condition on road networks that occurs as use increases, and it is characterised by slower speed, longer trips and increased vehicular queueing which leads to increased travel time. Certain impedances reduce the free flow of traffic in Lagos metropolis. Among these are the increased frequency of road use as a result of urban expansion which various land-use within the area exert on existing network. All these have myraids of effects on the environment, health and the economy of Lagos State at large.
One of the most harmful effects of traffic congestion is its impact on the environment. Despite the growing number of good vehicles on the road, cars stuck in traffic still produce a large volume of carbon. Besides contributing to global warming, these emissions can cause more short-term and localized problems, such as smog and increased respiratory problems in the metropolis due to poor air quality (Olaseni, 2011)
.
Drivers who encounter traffic hold-up may be late for work or other appointments, causing a loss in productivity and efficiency for businesses and loss in productive output in the driver’s personal lives. Valuable hours are wasted in traffic jams by the road users, leading to lost profits. Also, there is increase in the operating cost for vehicle owners due to increased fuel consumption. Commercial drivers take undue advantage to increase the fares which have a cyclical effect on the economic life of the commuters.Two theories were adopted as a basis for this work; Theory of Spatial Interaction (Harris and Ullman, 1945) and Sector Theory (Hoyt, 1939). Spatial interactions covers very wide range of movements such as journeys to work, migrations, tourism, the usage of public facilities, the transmission of information or capital, market areas of retailing activities, international trade and freight distribution. Economic activities within an area generates (supply) and attracts (demand) flows which has a direct reflection on traffic flow in that area. The fact that a movement occurs between an origin and a destination underlines that the costs incurred by a spatial interaction are lower than the benefits derived from such an interaction (Harris and Ullman, 1945). As such, a commuter is willing to drive one hour because this interaction is linked to income, while international trade concepts, such as comparative advantages, underline the benefits of specialization and the ensuing generation of trade flows between distant locations
The sector theory by Hoyt (1939) is a land use planning theory that criticizes the concentric ring theory. Hoyt opined that, the internal structure of a city is conditioned by the disposition of route radiating outward from the city centre. Differences in accessibility cause marked sectorial variations in the land value surface and correspondingly an arrangement of land uses in sectors. This might be responsible for the concentration of activities in designated places like Ikeja, Lagos Island, Victoria
Island, Apapa, etc., with such areas as Ikorodu, Somolu, Kosofe etc. housing majority of the people that are attracted to these zones. This arrangement of activities causes people who cannot afford the rent in the aforementioned zones to travel outward in search of a place of abode (Olaseni, 2011). Every day, these centres of activities attracts large volume of travellers in the morning and disperse them in the evening leading to increased use of the road network in such areas, thereby, causing vehicular traffic congestion. Therefore, it implies that, the spatial arrangement and activity pattern in the metropolis has a direct implication on vehicular traffic congestion. There exists a close relationship between land use pattern and traffic congestion (Indian Road Congress, 1990). In order to establish link between the pattern of spatial features and traffic congestion, it is imperative to carry out empirical observations of the heterogeneity in the pattern of spatial features and assign some suitable index value based on the pattern of occurrence of the features. This study was designed to achieve that by determining the contribution of different land-use surrounding the Apapa-Oworoshoki Express way in Lagos, Nigeria to traffic congestion along the Express way and the relationship that exist between Land-use pattern and road traffic congestion in the area.
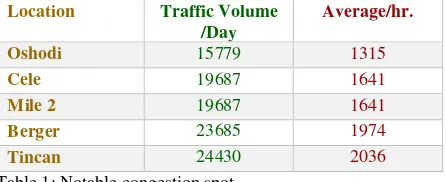
Several notable traffic congestion points as a result of land use influence on the Apapa-Oworoshoki corridor in Lagos, include Oshodi, Cele, Mile 2, Berger, and Tincan with various dominant land-use classes as; commercial, industrial, residential and recreational land-use characterizing the area, all of which produces heavy traffic volumes (see Table 1).
Location Traffic Volume Source: Lagos Metropolitan Area Transport Authority (LAMATA) (2015).
1.1 Study Area
attributed to the use of motor bikes. It is also very difficult at present to predict traffic situation in Lagos where average journey time to work is over one hour.
Apapa-Oworoshoki corridor, which is the area of study, is a major transport axis consisting of the five-lane dual carriage expressway and adjoining land uses. It is approximately 25km with a shoulder of varying width, it lies within Latitude 6024’ to 60 30’ and within Longitude 20 43’ to 20 22’ East of the Greenwich Meridian. The corridor stretches from Gbagada interchange in Kosofe Local Government area to Tincan in Apapa Local Government Area as displayed in Figure 2.
The concentration of industries such as; Afprint, Volkwasgen etc., Oshodi market, Mile 2, Apapa depot amongst others coupled with the growth and expansion of the metropolis has generated millions of trips per day because of various land uses present along the corridor. The corridor also serves as a major link to other major important trunk ‘A’ roads in the metropolis.
Most notable is the Lagos-Badagry expressway connecting Lagos to other West African countries. It is therefore evident from the survey that, the corridor stretching 25km from the Oworoshoki end of Third Mainland Bridge in Kosofe Local Government area to Liverpool end of Apapa local Government area has a lots of trip generation and attraction points which serves as pull and push factors within the area.
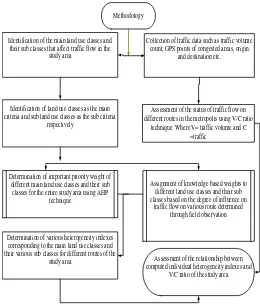
Identification of the main land use classes and their sub classes that affect traffic flow in the
study area
Identification of land use classes as the main criteria and sub land use classes as the sub criteria
respectively
Assessment of the status of traffic flow on different routes in the metropolis using V/C ratio
technique. Where V= traffic volume and C =traffic
Determination of important priority weight of different main land use classes and their sub classes for the entire study area using AHP
technique
Assignment of knowledge based weights to different land use classes and their sub classes based on the degree of influence on
traffic flow on various route determined through field observation
Determination of various heterogeneity indexes corresponding to the main land use classes and their various sub classes for different routes of the
study area Assessment of the relationship between computed individual heterogeneity indexes and
V/C ratio of the study area Collection of traffic data such as traffic volume
count, GPS points of congested areas, origin and destination etc. Methodology
Figure 2: Study Area: Apapa-Oworoshoki corridor
2. MATERIALS AND METHODS
The methodology employed in this study comprised of three different parts. The first part involved the quantification of the heterogeneity of land use based on weights computed from Analytic Hierarchy Process (AHP) and knowledge based weights. The second part consist of the computation of the volume capacity ratio (V/C) (Taylor, 1992) of the corridor (Apapa-Oworoshoki expressway) using traffic volume and traffic capacity. The final part consist of the determination of the relationship between the heterogeneity indexes and the V/C
The data used involve two sources, the primary and secondary data sources. The primary data source involved direct collection of information on the field using a Global Positioning System (GPS) and observations to obtain the geographic coordinates of the selected points for traffic volume count; observation of the nature of vehicular traffic congestion, and land use types along the corridor.
The secondary data source involved the collection and use of existing records. Such data include traffic count along the
corridor, and Lagos connectivity map from Lagos Metropolitan Area Transport Authority (LAMATA), Lagos State land use map sourced from the Lagos state Ministry of Physical Planning and Urban development.
2.1 Land Use Pattern along Apapa-Oworoshoki Expressway
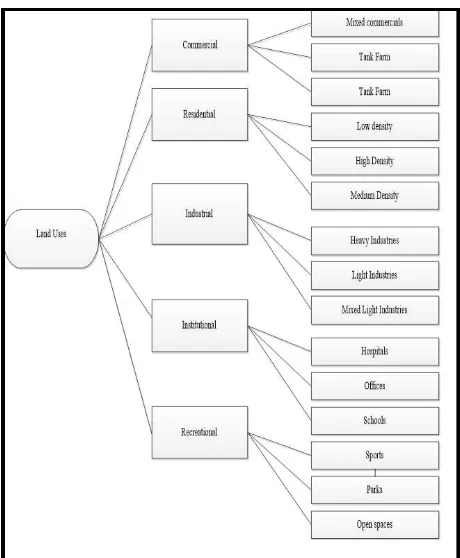
The Lagos connectivity map sourced from LAMATA was in an AutoCAD format. It was converted and stored by creating a file geo-database using the conversion toolin ArcGIS (conversion Geo-database Cad to Geo-database) and then projected. The land use pattern along the road segment extracted from the converted connectivity map was determined by overlaying the road map on the general land use map sourced from the Lagos state Ministry of Physical Planning and Urban development (Regional Master Plan Department). The road layer was inputted as an input layer to buffer the land use map by 2km to cover all local government areas connected by the road based on the Origin and Destination data, sourced from LAMATA. Five land-use classes observed in the study area were extracted from the buffered map, these include;
Residential (low density, high density and medium density),
Commercial (mixed commercials, market, tank farm),
Institutional (school, barracks, hospitals) Industrial (heavy industries, light industries and
mixed light industries) and
Recreational areas (religious, parks and open spaces) (see Figure: 3 above)
2.2 Determination of Importance Value (Priority Weight) of Different Criterial
The Land Use pattern as discussed above showed the main Land Use classes and sub classes along the corridor, selected as main criteria and sub criteria respectively. Different land use classes have different degree of influence on traffic flow condition. This is because different land uses have different structural and functional characteristics. Thus, it was important to rate relative contribution of each land-use class in influencing the flow of traffic along the corridor. This was achieved using, Analytical Hierarchical Process, to rate the relative contribution of various land use classes along the corridor i.e. (Commercial (C1), Residential (R1), Industrial (I1), Institutional (Int1), Recreational (Rec1) and their various sub-classes i.e. Mixed commercials (C11), Tank Farm (C12), Tank Farm (C13), Low density (R11), High Density (R12), Medium Density (R13) Heavy Industries (I11), Light Industries (I12), Mixed Light Industries (I13) Religious (Rec11), Parks (Rec12) and Open spaces (Rec13), School (Int11) , Barracks (Int12) , Hospitals (Int13)) in influencing the flow of traffic on the corridor on the scale of {0, 1}
Figure 4: Land-Use Classes and their sub classes
The AHP consists of three main operations, including hierarchy construction, priority analysis, and consistency verification. First of all, the general land use in the study area were broken down into component parts of which every possible attributes were arranged into multiple hierarchical levels as shown in Figure 4 above. After that, each cluster in the same level in a pairwise fashion based on knowledge from survey using scale of relative importance table according to Saaty, (1980). Since the comparisons are carried out through personal or subjective judgments, some degree of inconsistency may occur. To guarantee that the judgments are consistent, the final operation called consistency verification, which is regarded as one of the most advantages of the AHP, was incorporated in order to measure the degree of consistency among the pairwise comparisons by computing the Consistency Ratio using (CR=CI/RI)
As earlier identified, the various land use classes and sub classes represent the relevant criteria used in the pairwise comparison. To do this, a matrix of n by n elements was set up, where n is the number of criteria. In the matrix, 1 was assigned to the diagonal elements. This is because we are carrying out a pairwise comparison, thus, there will be no difference between the same elements on our matrix. Hence, if a parameter in ith row is m times more important than a parameter of jth column then value of the element aij would be m and value of the element aji would be 1/m.
the sum of all normalized Eigen vectors must be equal to 1 otherwise the results will lead to erroneous scenario(s).
The process of computing priority vectors and checking its consistency is as described below;
1. Addition of column elements of each column of the pair wise comparison matrix.
2. Dividing each element of the pair wise comparison matrix by the respective sum of their column elements.
3. Averaging of row elements across the rows of pair wise comparison matrix to determine the priority vector or normalized Eigen vector (λ) (the sum of priority vectors must not exceed one since priority vectors are normalized).
4. Principal Eigen value (λmax) is obtained by the summation of products between each element of priority vector and the sum of respective column elements.
5. After computing the principal Eigen value, the consistency index (CI) is computed using the formulae (λmax – n)/ (n-1) where n is the order of comparison matrix.
6. Finally, consistency ratio (CR) is determined using the formulae CI/ RI where RI is random consistency index (the consistency ratio should not exceed 0.1; if it exceeds, the pair wise comparisons is wrong).
To derive RI, The random index table by Saaty, 1994 was adopted for use in this study.
2.3 Assignment of Knowledge Based Weighting to Different Criteria and Sub Criteria
The use of AHP in the determination of the priority weights provides relative importance of a land use class with respect to other land use activities in the study area. It is however not necessary that the functional activities of certain land use is equal along the road segment. Therefore, it is important to normalize in functional terms, the presence of different criteria and sub criteria along the study strip. Thus, based on field observation, knowledge based weighting was provided to each criteria and sub criteria in the scale of [0, 1] in other to assess the influence of various land use classes on the road segment in the study area.
Sub-Classes Weight
TF 0.4
MKT 0.2
MC 0.1
HD 0.3
MD 0.2
LD 0.1
HI 0.2
LI 0.1
MLI 0.0
OS 0.1
PKS 0.0
SPT 0.3
SCH 0.0
MB 0.1
HOS 0.1
Table 5: Knowledge Based Weighting Table
2.4 Quantification of Heterogeneity in the Land Use Pattern
From section 2.3 above, five main land use classes, i.e. Commercial (C1), Residential (R1), Industrial (I1), Institutional (Int1), Recreational (Rec1) and their various sub-classes i.e. Mixed commercials (C11), Tank Farm (C12), Market (C13), Low density (R11), High Density (R12), Medium Density (R13) Heavy Industries (I11), Light Industries (I12), Mixed Light Industries (I13) Religious (Rec11), Parks (Rec12) and Open spaces (Rec13), School (Int11) , Barracks (Int12) , Hospitals (Int13) exist along the road segment in the study area. Therefore, the Heterogeneity of the main land use classes were quantified in terms of Commercial Heterogeneity Index (CHI), Residential Heterogeneity Index (RHI), Industrial Heterogeneity Index (IHI), Recreational Heterogeneity Index (RecHI), Institutional Heterogeneity Index (IntHI) and Cumulative Heterogeneity Index (CUHI).
The different heterogeneity Indexes computed are as presented below (after: Alok et al., 2014)
Cumulative Heterogeneity Index (CUHI): (C1*K + R1*K + I1*K + Int1*K + Rec1*K)….... (1)
Commercial Heterogeneity Index (CHI): (C11*K + C12 *K
+ C13 *K)………..……….….. (2)
Residential Heterogeneity Index (RHI): (R11 *K + R12*K +
R13 *K)………...…... (3)
Industrial Heterogeneity Index (IHI): (I11 *K + I12* K +
I13 *K)……….……... (4)
Recreational Heterogeneity Index (RecHI): (Rec11 *K + Rec12 * K + Rec13 *K)…………... (5)
Institutional Heterogeneity Index (IntHI): (Int11*K + Int12 *K + Int13 *K)……..…..…… (6)
2.5Traffic Volume and Road Capacity
Highway capacity is defined by the Highway Capacity Manual as the maximum hourly rate at which persons or vehicles can be reasonably expected to traverse a point or a uniform segment of a lane or roadway during a given time period under prevailing roadway, traffic and control conditions (Oglesby 1975). Capacity was measured as a reasonably expected value and not the maximum flow rate ever observed in the facility. This is because the measured capacity at a single location will show significant variation from day to day. In the process of measuring road capacity, traffic volume on a roadway per hour has been converted to Passenger Car Unit. (P.C.U), by multiplying the number of each class of vehicle by the appropriate weights or grades of various class of vehicles plying road as shown in table 6. The volume capacity ratio was derived by dividing the observed volume in PCU by the design capacity 2500 (Oglesby 1975)
V = Observed volume count
C = Design Capacity
Table 6: weighting conversion to P.C.U
3.0 RESULTS
3.1 Land Use Pattern
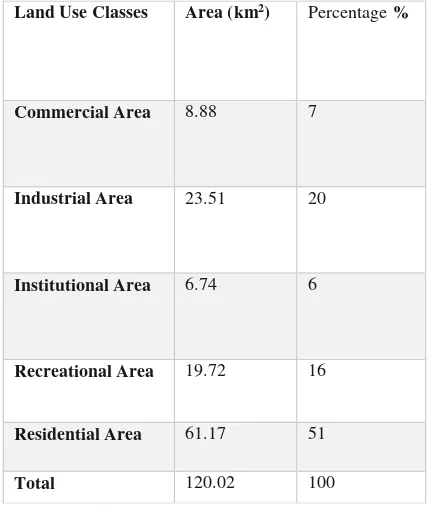
As discussed in 2.1 above, the land use within the study area were broadly classified in five categories. These are residential, commercial, institutional, industrial and recreational. Residential use is the highest land use category in the study area. It covers 51% of the total land area within the study area. Notable residential development within the study area include Jakande estate, Festac town, Aturase estate, Armed Force Resettlement area among others. Commercial land uses account for the second land use category in the study area covering 7% of the entire area. Major commercial land use include Alaba International market, Aswani market, Berger, Oshodi market and other local markets. The Industrial land use in the area was dominated by Volkwagen Assembly factory, Afprint,
Ilupeju Industrial estate and other small industrial establishments. Table 7 indicates that this land use covers 20% of the entire land. Recreational and Institutional land use constitute the fourth and fifth category of land use activity in the study area covering 16% and 6% of the entire land respectively.
Table 7: Land-Use Area Coverage
Figure 8: Land-Use Pattern Map Vehicle type Weight
Car 1.0
Buses, Coaches, Trailers
3.0
Heavy goods vehicle (HGV)
2.0
Motor cycle 0.75
Land Use Classes Area (km2) Percentage %
Commercial Area 8.88 7
Industrial Area 23.51 20
Institutional Area 6.74 6
Recreational Area 19.72 16
Residential Area 61.17 51
3.2 Development of Heterogeneity Index
Equation 1 – 6 in the previous chapter reveals the heterogeneity in the distribution of land use along different segments of the study area. The result of the various indexes area thus presented in the table 9 below. Among all the indexes, it can be inferred that, commercial land use have 33%contribution to the level of congestion in the study area representing the highest level of influence while both residential and industrial have influence with 25% and 15% contribution respectively. Recreation and institutional indexes also have the least with 9% and 4%level of influence. Overall, the five main criteria cumulatively have 86% influence on traffic congestion .
Table 9: Heterogeneity Indexes of various Land Use classes
Figure 10: Percentage Contribution of Heterogeneity Index to Traffic Congestion
Figure 11: Morning (am) level of congestion
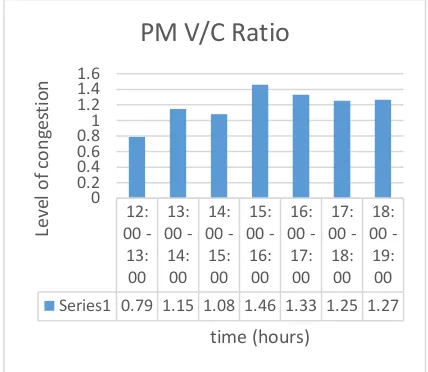
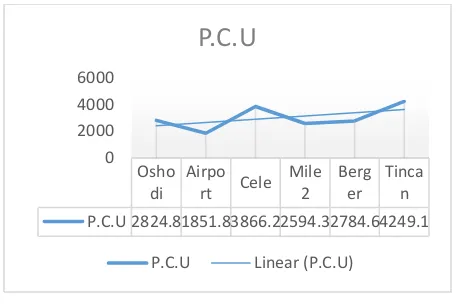
The average hourly volume expected on the corridor as earlier stated is 2500 pcu and five major point were analyzed along the corridor. These are Oshodi 15%, Airport junction 10%, Cele bus stop 21%, Mile 2 14%, Berger 15% and Tincan bus stop 33% all above the expected pcu. This translate to heavy congestion along the route with 14% increase to the expected capacity as shown in Figure 14, below.
Figure 12: Afternoon-Evening (pm) level of congestion
Figure 13: Traffic Pattern Map 0
RHI CHI IHI RecHI IntHI CUHI 33
Figure 14: Hourly PCU
3.3.2 Correlation Between Heterogeneity and Traffic Congestion (V/C Ratio)
The relationship between individual heterogeneity index and volume capacity ratio was established by calculating the coefficient of correlation for different days to determine the land use class that cause maximum and minimum influence on traffic congestion in the study area. Results showed there is high correlation between the Commercial Heterogeneity Index (CHI), the Residential Heterogeneity Index (RHI) and Volume Capacity Ratio (V/C) with correlation coefficient value of 0.74 and 0.83 respectively. On the other hand, the correlation coefficient of the Industrial Heterogeneity Index (IHI), Recreational Heterogeneity Index (RecHI), and Institutional Heterogeneity Index (IntHI) with the V/C were, 0.33, 0.28 and 0.23 respectively. These observations clearly indicate the occurrence of significantly strong relationship of CHI and RHI with V/C while the Institutional heterogeneity showed least influence in causing traffic congestion in the study area. The other two heterogeneity indexes: Industrial Heterogeneity Index (IHI) and Recreational Heterogeneity Index (RecHI) showed very low influence on the flow of traffic in the study area.
4.0 CONCLUSION
This study developed a technique, termed heterogeneity index in order to determine the distribution of land use pattern and contribution of each land-use class to traffic- congestion within the area of study. Five such heterogeneity indexes were developed based on the main land-use in the study area: Commercial Heterogeneity Index (CHI), Residential Heterogeneity Index (RHI), Industrial Heterogeneity Index (IHI) Institutional Heterogeneity Index (IntHI) and Recreational Heterogeneity Index (RecHI), these were computed based on the heterogeneity in the distribution of the various land use sub classes present within each main land use class. The five heterogeneity indexes were determined for a 2km buffer along the study strip. The outcome in this study demonstrates that heterogeneity index that represents the heterogeneity in the distribution of the various main land use classes and their sub classes serves as a significantly potential indicator for traffic congestion. These indices can be applied for effective town planning in
order to alleviate traffic congestion in the various routes and in the entire city.
REFERENCES
Alok, Bhushan, Nilanchal Patel, Akhouri Pramod. (2014). Development of Heterogeneity Index for the Assessment of Relationship between Land Use Pattern and Traffic Congestion. International Journal for Traffic and Transportation Engineering.
Cheng, J. (2003). Modelling Spatial and Temporal Urban growth. Utrecht, Netherland: Utrecht University.
Geshkov, M.V. 2010. The Effect of Land-Use Controls on Urban Sprawl. Ph.D. Thesis, the University of South Florida
Harris, C. & Ullman, E. (1945). The nature of cities. Annals of the American Academy of Political Science, 242, p. 7-17
Hoyt, H. (1939). The Structure and Growth of Residential Neighbourhoods in American Cities. Washington D.C. Federal Housing Administration.
Jaco, M. (2008). Congestion Charging Mechanism SMS for Roads. World Bank Working Paper WPS-1071, D.C.
Ojima, R & Hogan, D. (2009). Mobility, Urban Sprawl and Environmental Risk in Brazillian Urban Agglomeration. Committee for International cooperation in National Research in Demography (CICRD), (pp. pp 282-316).
Olaseni, M. (2011). Infrastructural Development and Vision 20:2020: Running with the Vision. A Paper Presented at the 2011 National Conference of the School of Environmental Studies, Federal Polytechnic, Ilaro. November 23, 2011
Osoba, S. B. (2012). A Geographic Analysis of intra-urban Traffic Congestion in some Selected Local Government Areas of Lagos Metropolis. Journal of Geography and Regional Planning, Vol.5(14), 362-368.
Saaty, T.L., 1980. “The Analytic Hierarchy Process.”
McGraw-Hill, New York.
Taylor, M.A.P. 1992. Exploring the nature of urban traffic congestion: concepts, parameters, theories and models. In Proceedings of the 16th Conference of the Australian Road Research Board. 83-104
Ullman, E. L. (1956). The role of Transportation as a basis
for interaction. Man’s role in changing the face of the Earth.
Osho di
Airpo rt Cele
Mile 2
Berg er
Tinca n
P.C.U 2824.81851.83866.22594.32784.64249.1 0
2000 4000 6000