ACADEME-LOCAL GOVERNMENT PARTNERSHIP TOWARDS EFFECTIVE
APPLICATION OF GEOSPATIAL TECHNOLOGIES FOR SMARTER FLOOD DISASTER
MANAGEMENT AT THE LOCAL LEVEL: AN EXAMPLE FROM MINDANAO,
PHILIPPINES
M. Makinano-Santillana,b∗, J. R. Santillana, E. M. O. Moralesa, L. C. S. Asubea,b, A. M. Amoraa, L. C. Cutamoraa, R. M. Makinanoa
a
CSU Phil-LiDAR 1 Project, Caraga Center for Geo-Informatics College of Engineering and Information Technology, Caraga State University Ampayon, Butuan City, Agusan del Norte, Philippines - [email protected]
b
Division of Geodetic Engineering
College of Engineering and Information Technology, Caraga State University Ampayon, Butuan City, Agusan del Norte, Philippines
Commission VIII, WG VIII/1
KEY WORDS:Geospatial technology, Flood, Disaster management, Academe-local government partnership, Mindanao, Philippines
ABSTRACT:
In this paper, we discuss how an academe-local government partnership can lead the way for the effective use of geospatial technologies for smarter and geospatially-informed decision making before, during, and after a flood disaster. In Jabonga municipality, in the province of Agusan del Norte, in Mindanao, Philippines, two significant flooding events occurred in the year 2014 which were caused by overflowing water bodies due to continuous heavy rains. These flood events inundated populated areas, caused massive evacuation, made roads un-passable, and greatly damaged sources of incomes such as croplands and other agricultural areas. The partnership between Caraga State University and the local government of Jabonga attempts to improve localized flood disaster management through the development of web-based Near-real Time Flood Event Visualization and Damage Estimations (Flood EViDEns) application. Flood EViDENs utilizes LiDAR-derived elevation and information products as well as other elevation datasets, water level records by monitoring stations, flood simulation models, flood hazard maps, and socio-economic datasets (population, household information, etc.), in order to visualize in near-real time the current and future extent of flooding, to disseminate early warnings, and to provide maps and statistics of areas and communities affected and to be affected by flooding. The development of Flood EViDEns as the main product of the partnership is an important application of geospatial technologies that will allow smarter and geospatially-informed decision making before, during, and after a flood disaster in Jabonga.
1. INTRODUCTION
Flood-related disasters in the Philippines have become more pro-nounced in recent years, majority of which have been caused by tropical storms and low pressure systems which bring along rains of varying duration, volume and intensity. In Jabonga mu-nicipality, in the province of Agusan del Norte, in Mindanao, Philippines, two significant flooding events occurred in the year 2014 (one in January, and another in December), which were mainly caused by the overflowing of several water bodies, par-ticularly Lake Mainit, due to continuous heavy rains. These flood events inundated populated areas, caused massive evacu-ation, made roads un-passable, and greatly damaged sources of incomes such as croplands and other agricultural areas. Prepa-rations and management actions exercised by the Local Govern-ment Units (LGUs) for these flood disasters b are already consid-ered standard operating procedures in accordance with the Philip-pines’ National Disaster Risk Reduction and Management Plan (NDRRMP) 2011-2028 (NDRRMC, 2011) and in the National Disaster Response Plan (DRRM-CEP, 2014). However, some in-terventions in the procedures are essential to improve localized flood disaster management. These interventions call for timely, efficient and systematic dissemination of early warnings to com-munities; for determining before-hand sets of information neces-sary for careful planning and preparation of evacuation strategies;
∗Corresponding author
for easily identifying areas that need immediate action; in identi-fying areas that should be avoided; and in estimating the severity of damage to people and infrastructure as flooding progresses.
In this paper, we discuss how these proposed interventions were made possible using geospatial technologies through a partner-ship between the academe (CSU Phil-LiDAR 1 Project of Caraga State University) and the Jabonga LGU. The objective of this partnership is to pave the way for effective use of geospatial tech-nologies for smarter and geospatially-informed decision making before, during, and after a flood disaster in the Jabonga munic-ipality through the development a web-based application called ”Near-real Time Flood Event Visualization and Damage Estima-tions (Flood EViDEns)”.
2. THE CSU PHIL-LIDAR 1 PROJECT
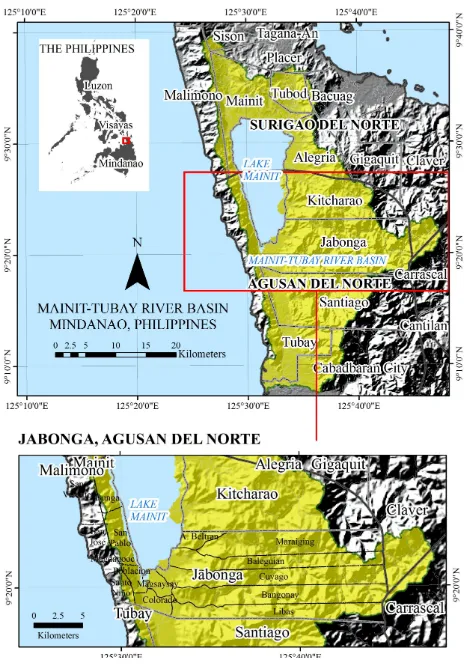
Region, Mindanao, which includes Jabonga, among many other cities and municipalities (Figure 1). Details about the project are discussed in Makinano-Santillan and Santillan (2015). However, we provide here some salient features of the project, especially on how the project generates 1-m spatial resolution hazard maps of covered river basins.
Within the CSU Phil-LIDAR 1 project, the steps involved in flood hazard map generation are streamlined into 3 major activi-ties namely, (i) field surveying, (ii) LiDAR data processing, and (iii) flood modelling. All field data collection activities of the project are being handled by the Field Survey Team (FST). Gath-ering information from the field ensures that the actual character-istics of the rivers and its floodplains are captured. Knowing how much rain falls into the watershed, how wide and deep the river is, how fast the water flows, and how much water flows along the river would allow us to determine the capacity of the river and what levels it would take for the river to overflow. To gather all this information, the FST conducts river cross-section surveys and flow measurements through installation of rain gauges, water level sensors, and velocity meters.
LiDAR datasets of the rivers systems covered by the project are being processed by the Data Processing Team (DPT) to gener-ate DTMs and DSMs. All LiDAR data used by the project are being collected by the Phil-LiDAR 1 Data Acquisition Compo-nent of the University of the Philippines Diliman. Validation and river bathymetry data gathered and provided to the project by Phil-LIDAR 1 Data Validation and Bathymetry Component of the UP Diliman are also processed by the DPT to assess accu-racy of the LiDAR products and to incorporate river bed data into the DTMs. The DPT also extracts from the DSMs features such as houses, buildings, roads and bridges that will be utilized for mapping structures at risk to flooding.
The Flood Modeling Team (FMT) uses hydrologic and hydraulic simulation models such as the Hydrologic Engineering Center Hydrologic Modeling System and River Analysis System (HEC HMS and HEC RAS) to predict flooding due to rainfall of vary-ing volume and intensity. The FMT uses the DTM and informa-tion extracted from the DSM during the flood modeling process. The main outputs of the FMT are flood models and flood hazard maps. The modeled and mapped flood hazards include historical (e.g., flooding due to Tropical StormsAgatonandSeniang) and hypothetical flood events. Hypothetical events are those flooding due to extreme rainfall events with return periods of 2-, 5-, 10-, 25-, 50-, and 25-year. The maps depict flood hazards into three levels: low (for flood depths of less than 0.50 m), medium (for depths from 0.50 m to 1.50 m), and high (for depths of greater than 1.50 m). The FMT also incorporates all the information from the field surveys to assess whether the historical flood haz-ard maps generated are realistic and accurate or not. The flow measurement datasets are being used to calibrate and validate the upstream hydrological model to ensure that its computations of flow during rainfall events are accurate within acceptable levels of accuracy. The FMT together with the FST also conducts val-idation surveys to check the accuracy of the flood hazard maps. The teams visit random locations within a river basin and inter-view the nearest household about the occurrence of flooding in their locality. Information gathered during the surveys are the geographic locations of the households, the maximum depth of flood, the estimated dates when the flooding occurred, and the causes of flooding (if it was due to overflowing of the river, or an accumulation of rainwater).
3. JABONGA AS A FLOOD-PRONE MUNICIPALITY AND CSU PHIL-LIDAR 1’S ATTEMPTS TO ASSESS
THE PERENNIAL PROBLEM
Jabonga is part of the Mainit-Tubay River Basin (Figure 1), and is one of the four municipalities located in the shores of Lake Mainit, considered as the Philippines’ deepest and fourth largest lake. In fact, the municipality lies near the outlet of the lake.
Figure 1: Series of maps showing the location of Jabonga munic-ipality within the Mainit-Tubay River Basin in Mindanao, Philip-pines.
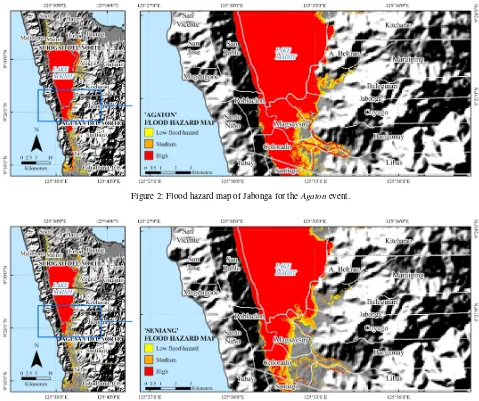
As one of CSU Phil-LiDAR 1’s project areas, flood hazard maps of Jabonga and the whole of Mainit-Tubay River Basin were pared in 2015 according to the methodology explained in the pre-vious section. These flood hazard maps depict the maximum depth and extent of flooding due to actual (or historical), e.g.,
Agaton(Figure 2) andSeniang(Figure 3) and hypothetical ex-treme rainfall events (e.g., rain return periods of 2, 5, 10, 25, 50, and 100 years). These maps have accuracies ranging from 68-72% based on validation surveys conducted throughout the river basin (Amora et al., 2015).
A preliminary flood assessment using these hazard maps show that indeed Jabonga is very prone to flooding. Of its 15 barangays, 10 appear to be directly affected by flooding regard-less of whether those flood events are actual or hypothetical ones. A simple spatial overlay analysis of the flood hazard maps with the municipal boundary would show that for theAgatonflood event, 0.5% of Jabonga’s land surface area of approx. 270 km2 are under high hazard, 1.2% in medium hazard and 6.2% in low hazard. Combining these hazard levels makes 7.9% of Jabonga to be flooded. Although these statistics appears to be insignificant because the flooded areas are small compared to the total land sur-face area of Jabonga, it is still important considering that it is in these flooded areas where majority of the people are living. Two barangays, namely Magsaysay and Colorado, are the most af-fected by flooding, an important finding fully supported by news accounts (e.g., Mascarinas, 2012; NDRRMC, 2014; Crismundo, 2014). On the other hand, the hypothetical flood hazard maps re-veals an increase in flood affected areas as the rain return period increase (i.e., as rainfall events becoming more extreme).
These flood hazard maps that the project generated for Jabonga municipality resulted from a river-basin wide flood modelling ap-proach utilizing recent and detailed geospatial datasets and nu-merical models. Due to its fine detail, the maps allow deeper as-sessment of flooding such as identification of infrastructures (e.g., buildings/residences, roads and bridges) at risk of being flooded under various scenarios, finding areas that can be used as evacua-tion centers, identificaevacua-tion and improvement of evacuaevacua-tion routes, and building flood defenses (specifically in areas where overflow-ing occurs), among many others . These hazard maps can also be used as vital input for localized land-use planning integrating flood hazard information.
4. FORGING THE PARTNERSHIP WITH THE JABONGA LGU
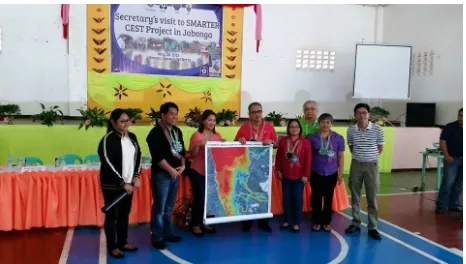
The opportunity for the hazard maps to be distributed and made useful to the Jabonga LGU came in May 28, 2015 when the Caraga Regional Office of the Philippines’ Department of Sci-ence and Technology (DOST Caraga Region) invited the CSU Phil-LiDAR 1 project to participate in the launching of the ’Smarter Community Empowerment through Science and Tech-nology (CEST)’ project in Jabonga. It was in this launch-ing that the preliminary flood hazard maps were turned-over to the Jabonga municipal officials (Figure 4) (CSU Phil-LIDAR 1, 2015).
It was after the map turnover that communication between the CSU Phil-LiDAR 1 Project and the Jabonga LGU through its Mu-nicipal Disaster Risk Reduction and Management Office (MDR-RMO) began to materialized until it reached a stage that the two entities have engaged in a thorough discussion on what other as-pects the project can be of value to make flood disaster manage-ment in Jabonga a ’smarter’ one.
Figure 4: Flood hazard map turnover in the Jabonga municipality during the Smarter CEST Project launching which initiated the partnership between CSU Phil-LiDAR 1 Project and the Jabonga Local Government Unit.
The Jabonga MDRRMOs keen interest on having a ’smarter’ ap-proach in managing flood disasters by tapping the CSU Phil-LiDAR 1 project to provide the approach and technology ended in a partnership in the development of an automated, near-real time web-based flood monitoring and assessment tool. The ratio-nale for the partnership was anchored upon the MDRRMOs im-mediate need not only for timely and detailed flood hazard maps but also for easily-accessible geospatial tools and techniques that they can use before, during and after the occurrence of flood dis-asters. This smarter approach would mean the possibility of hav-ing timely, efficient and systematic dissemination of early warn-ings to communities; for determining before-hand sets of infor-mation necessary for careful planning and preparation of evacu-ation strategies; for easily identifying communities that need im-mediate action; in identifying areas that should be avoided; and in estimating the severity of damage to people and infrastructure as flooding progresses.
5. FLOOD EVIDENS: A WEB-BASED APPLICATION FOR SMARTER FLOOD DISASTER MANAGEMENT
IN JABONGA
CSU Phil-LiDAR 1’s response to make flood disaster manage-ment in Jabonga ’smarter’ was through the developmanage-ment of the Near-real Time Flood Event Visualization and Damage Estima-tions (Flood EViDEns) customized web application. Flood EV-iDEns is actually a generic web application developed by the project which served as a visualization and analysis platform for all hazard maps generated by the project with a basic set of func-tionalities to conduct spatial overlay analysis of flood hazards and elements-at-risk (e.g., buildings). A public version of the generic application is available in http://evidens.csulidar1.info. Its devel-opment is discussed in detail in Santillan et al. (2015).
In the case of Jabonga, the very basic functionality of Flood EV-iDENs would not suffice the LGUs requirements of ’smarter’ flood disaster management. As such, a customized version was developed utilizing LiDAR-derived elevation and information products as well as other elevation datasets, water level records by monitoring stations, flood simulation models, flood hazard maps, and socio-economic datasets (population, household information, etc.), in order to visualize in near-real time the current and future extent of flooding, to disseminate early warnings, and to provide maps and statistics of areas and communities affected and to be affected by flooding.
MDR-Figure 2: Flood hazard map of Jabonga for theAgatonevent.
Figure 3: Flood hazard map of Jabonga for theSeniangevent
RMOs hardware) and to train the Jabonga LGU on how to use the application, including capacity-building activities such as semi-nars and trainings on the use of geospatial technologies. On the other hand, the Jabonga LGU will provide household-level so-cioeconomic datasets (household information such as number of family members, sources of incomes, type of housing materials, etc.) that are crucial to generate the expected outputs of the web application.
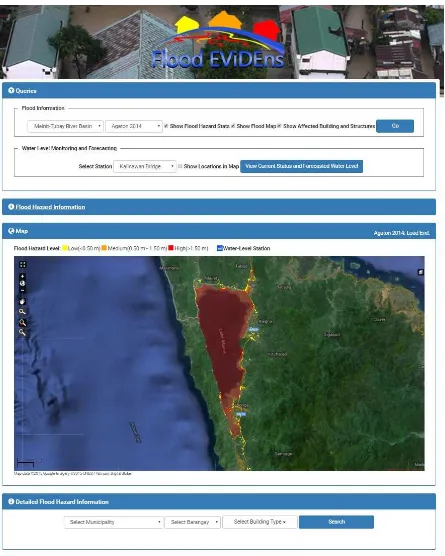
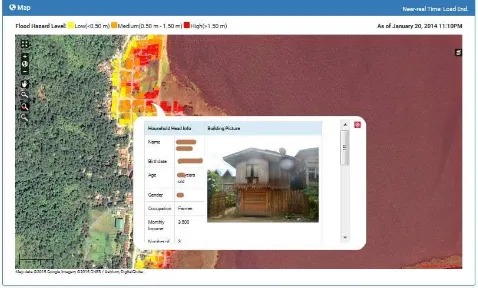
So far, we have developed a preliminary but working version of Flood EViDENs customized for Jabonga. It is considered prelim-inary since the gathering of household level information by the MDRRMO is not yet finished, and is expected to be completed before the year 2016 ends. As a web application, it was config-ured to display maps of ood hazards and affected structures as well as processed textual information (e.g., statistics of affected structures) (Figure 5). It allows the user to display a summary of the number of structures affected by a ooding event, as well as a web map showing ood hazard, structures (buildings), and other associated layers (e.g., political boundaries). In the web page, a user can display both the near-real time ood hazard map as well as location of affected structures which are color-coded according to hazard level. Clicking in an affected structure in the web map will display important attributes such as name of struc-ture (head of the family if the strucstruc-ture is a residential building),
type, location, and many others. This feature was made possi-ble using the rich dataset of household information collected by the Jabonga MDRRMO and provided to the project. The appli-cation also has a Search/Filter utility where the user can search ood affected structures according to barangay and type of struc-ture. The resulting list categorizes the structures according to ood hazard level, and if clicked, the user can see the actual location of these structures in the web map (e.g., the structures location is zoomed-in in the map). In addition to these functionalities, plots/graphs showing the actual status of the lakes water level in the last 24 hours and forecast for the next 12 hours (as computed by the water level forecasting model) are also available in Flood EViDEns. This allows the user to monitor the lakes water level, and determine whether it will reach the lakes spilling level in the next hours, including the specic date and time of spilling.
Figure 5: Graphical user interface of Flood EViDEns.
Household information can also be viewed in addition to locating those affected structures (Figure 7).
6. CONCLUDING REMARKS
The partnership between the CSU Phil-LiDAR 1 project and the Jabonga LGU discussed in this paper can be considered an at-tempt to bring geospatial technologies to the local level. The de-velopment of Flood EViDEns as the main product of the partner-ship is an important application of geospatial technologies that
will greatly improve localized flood disaster management in this municipality, e.g., by allowing smarter and geospatially-informed decision making before, during, and after a flood disaster.
ACKNOWLEDGEMENTS
Figure 6: Applying Flood EVIDEns to generate statistics and map of ooding and affected structures.Flooded areas and affected struc-tures are color-coded according to hazard level (yellow: low; orange: medium; red: high).
in this work were provided by the University of the Philippines Disaster Risk and Exposure for Mitigation (UP DREAM)/Phil-LIDAR 1 Program.
We sincerely acknowledge the unending support of the Municipal Disaster Risk Reduction and Management Office (MDRRMO) of Jabonga, Agusal del Norte as well as the DOST Caraga Regional Office for making possible the forging of the partnership. The CSU Phil-LiDAR 2 Project is also acknowledged for allowing us to host in their dataserver the public version of Flood EViDEns.
We are thankful to the DOST and the Philippine Council for In-dustry, Energy and Emerging Technology Research and Devel-opment (PCIEERD) for the financial assistance that allowed us to present this paper during the XXIII ISPRS Congress 2016.
REFERENCES
Amora, A., Santillan, J.R., Makinano-Santillan, M., Marqueso, J.T., 2015. Flood hazard mapping of Mainit-Tubay River Basin, Mindanao, Philippines. In: 36th Asian Conference on Remote Sensing 2015 (ACRS 2015): Fostering Resilient Growth in Asia, Quezon City, Metro Manila, Philippines, Vol. 1, pp. 440-450.
Crismundo, M., 2014. Flood displaces thousands in Caraga. http://www.mb.com. ph/flood-displaces-thousands-in-caraga/ (30 April 2014).
http://csulidar1.info/news-and-events/ceremonial-Figure 7: Viewing household-level information of an affected structure such as this is another feature of Flood EViDENs.
turnover-of-preliminary-flood-maps-by-dost-secretary-montejo-to-jabonga-local-government-unit/ (01 February 2016).
DRRM-CEP, 2014. National Disaster Response Plan as of June 2014. Disaster Risk Reduction and Management Capacity Enhancement Poject (DRRM-CEP) of the Japan International Cooperation Agency (JICA) for the Office of Civil Defense (OCD), Government of the Republic of the Philippines. http://www.ndrrmc.gov.ph/attachments/article/1334/NDRP
Hydro Meteorological Hazards as of 2014.pdf (05 January 2016).
LMDA, 2014. Lake Mainit Development Alliance (LMDA) Website, “Physical Features of Lake Mainit”, https://lmda.wordpress.com/about-lake-mainit/physical-feature-of-lake/ (30 April 2014).
Makinano-Santillan, M., Santillan, J.R., 2015. Flood hazard mapping of river basins in Caraga Region, Mindanao, Philippines through the CSU Phil-LiDAR 1 project. In: 36th Asian Confer-ence on Remote Sensing 2015 (ACRS 2015): Fostering Resilient Growth in Asia, Quezon City, Metro Manila, Philippines, Vol. 1, pp. 599-610.
Mascarinas, E., 2012. 2,500 families
dis-placed by floods in Agusan. MindaNews,
http://www.mindanews.com/environment/floods/2012/02/18/2500-families-displaced-by-floods-in-agusan/ (30 April 2014).
NDRMMC, 2011. National Disaster Risk Reduction and Management Plan (NDRRMP) 2011-2028. National Disas-ter Risk Reduction and Management Council (NDRRMC), http://www.ndrrmc.gov.ph/attachments/article/41/NDRRM
Plan 2011-2028.pdf (05 January 2016).
Santillan, J.R., Morales, E.M.O, Makinano-Santillan, M., 2015. Flood EViDEns: a web-based application for near-real time ood