GROUND DEFORMATION MONITORING IN QINGDAO COASTAL AREAS BY
TIME-SERIES TERRASAR-X IMAGES
A. Y. Hou *, X. Qiao, D. Li
Qingdao Geotechnical Investigation and Surveying Institute, State and Local Joint Engineering Research Center for theIntegration and Applicatioin of Sea-land Geographical Information, Shandong Road, Qingdao, China - ([email protected], [email protected], [email protected] )
Commission VII, WG VII/2
KEY WORDS: SBASI, InSAR, TerraSAR, ALOS
ABSTRACT:
As a new generation of high resolution and short revisit period of radar satellite,TerraSAR-X is not only able to meet the requirements of monitoring large scale surface subsidence, but also make it possible to monitor the small deformation of the short period. This articles takes the coastal areas of the west coast of Qingdao as the research object. With Small baselines subsets interferometry synthetic aperture radar SBASI ,this paper obtained the period the average annual rate of change from the time series analysis of TerraSAR-X data from April 2015 to October 2014.In order to enrich the historical deformation data of the study area, it analyse the time series of ALOS images from December 2010 to October 2008 with the same method.Finally,it analyse and demonstrate the experimental results.
1. INTRODUCTION
Ground subsidence has always been main geological hazards in Chinese city, with the characteristics of non-reversible and accelerative. Its influence scope and speed of development of the urban area are different in different space and time .The spatial difference of the ground subsidence can cause the unequal settlement of the man-made features on surface, which directly affects the safety of the large single building, underground rail and other large projects. Therefore, regular monitoring of deformation in the coastal areas of Qingdao is of great significance to ensure the safety of major projects and infrastructure. The traditional measuring method is high precision, but it has low coverage and inefficient and strong intensity of labour.Compared to using traditional measuring method, differential interferometric synthetic aperture radar (D-InSAR) has large monitoring range , high repeat cycle stability , high spatial resolution, and its observation accuracy can get to the centimeter level[4].However, due to the negative effect of space and time delay, the application of D-InSAR technology in the long time range is limited.In this regard, the Ferretti and other scholars in Italy propose the Scatterer Persisitent (PS) interferometric synthetic aperture radar (PSI) technique, at the end of twentieth Century, which is used to solve the problem of the time loss, the atmospheric effect and the DEM error.
However, PSI technology has its own shortcomings, first of all, the technology needs to obtain a large number of SAR image data (more than 20) .Secondly, it needs a certain number of PS points, but different PS points of the scattering characteristics of radar signals is not conducive to the phase unwrap. In 2001, Berardino and Lanari et al. propose the Small Baseline Subset interferometric synthetic aperture radar (SBASI) to improve the time series model to be extended to the study of large scale deformation. With setting the threshold of time and the vertical baselines, SBASI method will be obtained a number of SAR sets, which greatly reduce the spatial correlation phenomenon, have redundant observations, separate out the terrain of the 1 widely used in the long time monitoring of surface deformation, because it is simple theory, it does not require a large amount of SAR image data, and it can guarantee the reliability of the results.
In this paper, the high resolution TerraSAR-X data is used to study the SBASI technology,Which purpose is to monitor the surface deformation rate of the west coast of Qingdao. Due to funding and time limit, this paper only ordered 6 TerraSAR-X data. In order to guarantee the effect of TerraSAR-X data, we bought 13 historical data of ALOS in the region。The purpose of processing ALOS data by SBASI is in order to obtain the historical surfice subsidence rate of the west coast of Qingdao, which improve the efficiency of TerraSAR-X, and discuss the existing problems about the application of high resolution TerraSAR-X data is precessed by SBASI technology.
2. THE TECHNOLOGY PRINCIPLE OF SBASI
2.1 The algorithm model and principle
The SBASI method Combines all SAR images which in the same area at different phases into small baseline set according to predefined baseline threshold , Baseline between SAR image from the set is small, Baseline between SAR image between the set is large. Using conventional D-InSAR technology on the baseline set,recognition from the interferogram with a stable phase-coherent target, obtain coherent target surface deformation information in the two imaging time interval, in order to increase the number of sample observations; According to the time order combined these deformation Information of the interferometric imagery to weaken the influence of atmospheric phase distortion and random noise on phase. Every little baseline set of surface deformation time series can be obtained by least square method, however, sampling is not usually a single collection time, this makes the equation (2.2) have numerous solutions. Using singular value decomposition (SVD) method to multiple small baseline set can solve the
problem and obtain the settlement of the observation time sequence.
In (t1,..., tN) time to obtain N amplitude SAR images of the same area, select the appropriate time from the baseline and vertical baseline,deal with these images which has interference
condition,here 2/N≤M≤[N(N-1)]/2. Assuming that the j interference image obtained from SAR images in tA and tB times,here tA>tB, after remove of the ground and terrain phase, Differential interference pattern like element x at the interferometric phase are:
2.1
Where λ is the wavelength of the radar center, d(tB, x) and d(tA, x) respectively relative to the reference time t0 to the radar line of sight (LOS) direction of the accumulated strain, d(tB,x)=0;
φ(tB,x) and φ(tA,x) respectively a phase distortion caused by d(tB, x) and d(tA, x).
In equation 2.1, In order to simplify the model, Phase Δφ not consider atmospheric phase, the residual phase noise and loss of coherence. The technology of SABSI is different from that of PSI, it is the coherence Criterion extracted as a high point of coherence ,using all coherence factor graph for obtaining the average coherence map, Set the appropriate threshold coherent, choose high coherent points. Here with these high coherent point to establish the discrete equations, set φ as the point in the N moments on the direction of the radar line of sight (LOS) deformation phase, A is the coefficient matrix, the main image of coefficient is 1, Auxiliary coefficient image is -1, the other coefficients are zero, it can be estimated using the following linear model for M interferograms corresponding phase, it can be expressed as:
2.2
In equation 2.2, there were M equations and N unknowns . if M
≥ N , According to the method of least squares we can obtain:
2.3
In the SBASI method , in order to ensure that every high interferograms coherence, when the interferometric SAR images composite, we need to consider space and time the baseline from the baselinetherefore , the selection method of interferometric imagery is relevant, each equation between the observation is also relevant, In equation 2.2 ,the coefficient matrix A is a correlation matrix, if there is rank and it will be less than N, the corresponding equation coefficient matrix ATA rank deficient , and least square method is not the only solution. How to solve the problem caused by the connection equation coefficient matrix A correlation coefficient between the baseline and the different rank-deficient matrix, the solution described below Singular Value (SVD).
2.2 Singular value decomposition SVD
When the matrix A is rank-defect matrix, by measuring data processing theory, do the Singular value decomposition (SVD) to matrix A. It can be expressed as:
2.4
Where U is an M×M orthogonal matrix, the front N rows are the characteristic vector of AAT, called the left singular vectors of
A. V is a N×M monsieur beaucaire matrix, all the rows of it are the feature vector of AAT, called the right singular vectors of A. S is a M×M matrix, the elements of S are the square root of the corresponding eigenvalue of the M×M matrix AAT. Set the rank of A is R, the AAT have R nonzero eigenvalues. Then the generalized inverse of matrix A is:
∑ √ 2.5
Then, about the equation Aφ=Δφ,the estimate of least square
phase on the meaningful of minimum nom is ̂=A+Δφ.
Using the SVD method for solving phase directly, the phase of the resulting appear the phenomenon of jumping up and down in times, which show the discontinuity, obviously this does not conform to the laws of physics.In order to get the physical significance of sedimentation sequence, then, take the phase in equation (2.2) converted to the average rate of:
[ ] 2.6
Instead the phase of equation(2.1), can be obtained:
∑ 2.7 auxiliary acquisition time, otherwise B(j,k)=0. Since the matrix B and A are the singular matrix, according to the SVD method to decomposition them, then we can obtain the minimum nom solution of the velocity vector v.
For the elevation error Δq, we can establish the following linear
equations:
2.9
Where C is a M×1 matrix, associated with baseline distance. So the DEM error is obtained. Finally, on the basis of the linear model, do the appropriate filtering to residul phase in the space domain and time domin which can separate the atmospheric phase and nonlinear phase.
3. DATA EXPERIMENT AND RESULT ANALYSIS
3.1 Data preparation and processing
In order to verify the application of SBASI theory and method in Qingdao coastal area, this paper uses two kinds of radar data for ALOS and TerraSAR-X. the details are as follows:
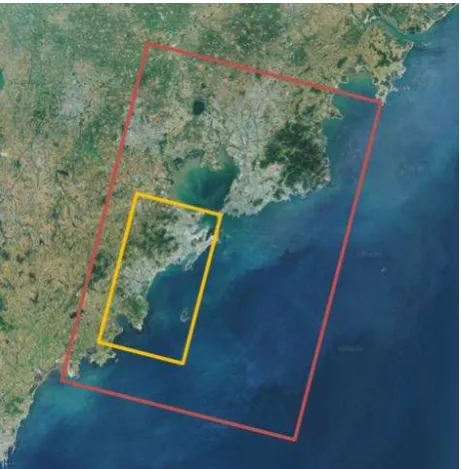
1) This paper purchased 13 historical data of ALOS satellite from October 29, 2008 to December 20, 2010,with the image mode for FBD and resolution of 10 meters. Figure 1 shows the image extent(red box range).The historical subsidence rate in the research area is obtained from processing ALOS data with the method of SBASI, which can enrich the historical ground subsidence data and assist the high rate TerraSAR-X data to monitor the ground subsidence in the study area. In addition, the results verify the reliability of the results of TerraSAR-X
data ,compared with the monitoring result from TerraSAR-X data
2) This paper purchased 6 scene programming data 0f TerraSAR-X satellite from October 2, 2014 to April 14, 2015, with the image mode for StripMap and resolution of 3 meters. Figure 1 shows the image extent(yellow box range).
Differential interferometric processing requires DEM data to simulate the terrain phase as well as a reference to the geocoding, which this paper used is 90 m resolution SRTM DEM data.
Figure 1. The extent of ALOS and TerraSAR-X
Considering that the resolution of SAR images has been significantly improved, the single pixel is still the coherent synthesis of the multiple scattering bodies, and there is always a stable dispersion in each resolution cell, which is the high coherent points in the time series method research. It is more stable and significant than other scatterers. According to the characteristics of the high resolution data, the selection of high coherence points can realize estimation of surfice settlement under the condition of a few sequence data.
The ALOS and TerraSAR-X data was processed by time series data inversion, according to the method of SBASI has been introduced above . It estimate more reasonable combinations of baseline set, according the principle of a small set of baseline to calculate the division of the small baseline set .But it easily generate isolated images in this process, which need manually select the smallest perpendicular baseline image to make a paire.The process of SBASI need select an super master image, so this paper select the suitable super master image for ALOS and TerraSAR-X data according to the time and space baseline for each data set as follows:ALOS super master image acquisition date is August 1 2009, and generate 44 interferometric pairs. ALOS temporal baseline diagram shown in Figure 2; TerraSAR-X super master image acquisition date is October 2, 2014, and generate 15 interferometric pairs. TerraSAR-X temporal baseline diagram shown in Figure 2.
Figure 2. Time and space baselines of the interferogram of ALOS
Figure 3. Time and space baselines of the interferogram of TerraSAR
After processing interference completed,phase unwrapped for all the relative orbit refining and flatting again.At last we got the series displacement by SBASI inverting.From figure5 and figure6 the average settlement rate for the West Coast District was obtained between October 2008 and December 2012 , October 2014 and April 2015.
3.2 Result analysis
3.2.1 Spatial distribution of settlement areas
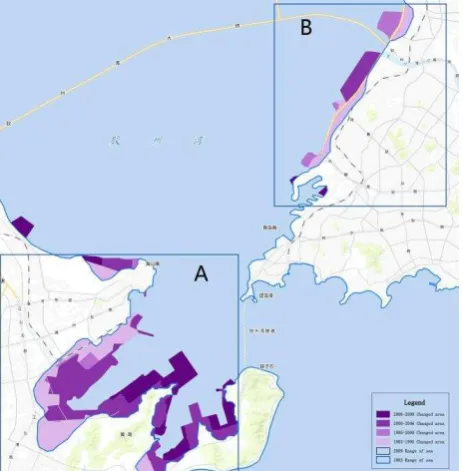
With object-oriented multi-scale segmentation classification technology, we extracted Jiaozhou Bay coastal zones in 1983,1985,2000,2006,2009 from the LANDSAT satellite remote sensing images.Figure 4 shows the result of changed areas happened in Jiaozhou Bay sea area.
Qingdao West Coast District includes Jiaonan and Huangdao,both of them are coastal areas,especially the eastern port areas.The Purple area named A we find in Figure 4 is the construction of artificial reclamation area from 1983 to 2009 ,with the characteristic of soft soil, high moisture content,porosity ratio, low intensity and uneven soil. So, In a certain period of time, the compressed strata consolidation will bring large settlement inevitablely. In addition, with the establishment of the new district and decreasing of the ground
space available, we’ll pay more attention to the development
and utilization of underground space. The underground space development and utilization such as deep excavation, subway
tunnel construction at different and deeper depths with cause the soil compression settlement, also the factors of construction work and external load.
Figure 4. Jiaozhou Bay Coastal Zone’s evolution chart using image extraction from LANDSAT satellite
Figure 5 shows the result of the average settlement rate for the West Coast District from October 2008 to December 2010 is -31.127 ~ 19.229mm/s ,obtained by ALOS data using SBASI methods. We find that:
(1)The settlement rate of Jiaozhou Bay coastal areas is more significant than the inland areas;
(2)The most serious areas are mainly distributed in Qingdao Qianwan Port Free Trade Zone,an area named A Fig. 5.It exactly correspons to the largest land reclamation area A in figure 4;
(3)Scarcely deformed areas occur in Huangdao Town ,an area named B in figure5 and Jiaonan Town ,an area named C in figure 5 during these periods.
Figure 5. Annual average settlement rate using Alos data by SBASI methods
3.2.2 Monitoring results of important areas
Apart from the basic monitoring with Alos satellite data, we aslo focused on the important areas using TerraSAR-X satellite data, such as areas named A,B,C figured out in figure 6.
Figure 6. The annual average sedimentation rate map from TerraSAR-X using SBASI(PS points selected distribution map)
Figure 7. the time series plot of PS point as samples(total 6 PS points)
From the result of Figure 6, we find that:
(1) the average settlement rate for the West Coast District from October 2014 to April 2015 using TerraSARX satellite data is -31.127 ~ 19.229mm/a;
(2) a large settlement area was found in Sino-German eco-park (Area1 in figure 6) and the former Bay(Area6 in figure 6) ; (3)the surface of Huangdao town (Area2,3 in figure 6) and Jiaonan town (Area4,5 in figure 6) is relatively stable, almost no settlement.;
(4) in order to analyze possible settlement trends in futre,we select confirm some PS points (figure 6) and gave these points’s series curve (Figure7) varing with time in the region mentioned above;
(5)From Area1 in figure7,subsidence position continues to increase, the maximum reached 20mm;(6)Area 2,3,4,5 are no subsidence position, the amount of change is within 5mm; (6)Area 6 also continued to increase, reaching maximum 25mm. In addition to area 1 in Figure 6 is a newly discovered area, the other three areas make consistent with previous analysis using ALOS data, which concentrating in the eastern coastal reclamation area of Qingdao West Coast District.
Different sensor data processing results look the same, but in fact there are characteristic differences. Sensors working in different bands are different in the degree of deformation. TerraSAR-X with short wavelength reflect subtle deformation better.When presenting details of contour points, the relationship between points with highly coherent and ground resolution cell corresponding shows more clearly, which can improve the accuracy of the selected point.By comparing SBAS of TerraSAR-X data analysis results with ALOS data, we Coast District;(3)according to comparing to the monitoring results of ALOS radar image, results of both analyzes are basically the same, proving that TerraSAR-X monitoring results are reliable;(4) TerraSAR-X data with high resolution, shows details of the surface features better, subtle settlement more
accurate than Alos data;(5) It’s provided with unique advantage
for settlement monitoring in Qingdao coastal region by using SBASI technology and TerraSAR-X data.
In this paper, there are also some disadvantages, such as there
aren’t standard points and other settlement information to verify,
and outside verification for analyzing the reasons for larger area in settling. influences on urban security of Shanghai. Shanghai Geology, 30(1), pp.34-39.
Jiang Y N, Yang M S, Liao M S.2013a. Deformation monitoring of the Shanghai Maglev system based on the time-series analysis of InSAR data.Shanghai Land Resources, 34(4), pp.17-20.
Xu K, Lu G, Xu J. 2015a. Land Subsidence Montoring in Changzhou City Using the Interferometric Point Target Analysis Technique.Science and Technology innovation heraid, NO.11, pp.9-10.
Chen G H, Shan X J, Moon W M. 2008a. A modeling of the magma chamber beneath the Changbai mountains volcanic area constrained by InSAR and GPS derived deformation. Chinese Journal Geophysics, 51(4), pp.1085-1092.
Ferretti A, Prati C, Rocca F. 2001. Permanent scatterers in SAR interferometry. IEEE Transactions on Geoscience and Remote Sensing, 39(1), pp.8-20.
Ferretti A, Prati C, Rocca F. 2000. Nonlinear subsidence rate estimation using permanent scatterers indifferential SAR interferometry. IEEE Transactions on Geoscience and Remote Sensing, 38(4) , pp.2202-2212.
Berardino P, Fornaro G, Lanari R.2002. Anewalgorithm for surface deformation monitoring basedon small baseline differential SAR interferograms. IEEE Transactions on Geoscience and Remote Sensing, 40(10).
Mora O, Mallorqui J J, Broquetas A.2003. Linear and nonlinear terrain deformation maps from a reduced set of interferometric SAR images. IEEE Transactions on Geoscience and Remote Sensing, 41(10), pp.2243-2253.
Berardino P, Fornaro G, Lanari R. 2002. A new algorithm for surface deformation monitoring based on small baseline differential SAR interferograms. IEEE Transactions on Geoscience and Remote Sensing, 40(11), pp.2375-2383.
Lanari R, Mora O, Manunta M. 2004 . A small-baseline approach for investigating deformation on full-resolution differential SAR interferograms. IEEE Transactions on Geoscience and Remote Sensing, 42(7), PP.1377-1386.
Hooper A, Zebker H, Segall P. 2004. A new method for measuring deformation on volcanoes and other natural terrains using InSAR persistent scatterers. Geophysical Research Letters,31(23).