HYPERSPECTRAL IMAGE RESOLUTION ENHANCEMENT BASED ON SPECTRAL
UNMIXING AND INFORMATION FUSION
J. Bieniarz∗, D. Cerra, J. Avbelj, P. Reinartz and R. M ¨uller
German Aerospace Center (DLR), Remote Sensing Technology Institute (IMF), 82234 Oberpfaffenhofen, Germany
KEY WORDS:Hyperspectral remote sensing, image fusion, subpixel restoration/reconstruction, hyperspectral unmixing.
ABSTRACT:
Hyperspectral imaging sensors exibit high spectral resolution, but normally low spatial resolution. This leads to spectral signatures of pixels originating from different object types. Such pixels are called mixed pixels. Spectral unmixing methods can be employed to estimate the fractions of reflected light from the different objects within the pixel area. However, spectral unmixing does not provide any spatial information about the sources and therefore additional information is needed to precisely locate the sources. In order to restore the spatial information of hyperspectral images we propose a hyperspectral and multispectral image fusion method based on spectral unmixing. The algorithm is tested with HyMAP image data consisting of 125 spectral bands and a simulated multispectral image consisting of 8 bands.
1 INTRODUCTION
Each hyperspectral pixel consists of hundreds of contiguous and narrow spectral bands covering typically the visible to short in-frared wavelength range. The compactness of channels results in the limitation of the pixel size. Modern hyperspectral space-borne cameras have normally a ground resolution of about 30 m, which results in pixels consisting of signals from more than one material. Such pixels are called mixed pixels composed of pure spectral signatures, also called endmembers. The mixture of sig-natures prevents direct material recognition and requires further processing in order to separate the mixed signal. This problem is also known as blind source separation and has been exten-sively investigated by the signal processing and remote sensing community in the last years. Methods for hyperspectral source separation are known as spectral unmixing and recent spectral unmixing methods allow to extract endmembers with high accu-racy, however spatially not located. Unlike hyperspectral data, multispectral data have usually high spatial resolution with only several spectral channels in a relatively wide range, and accu-rate material recognition is hardly to reach. Therefore fusion of hyperspectral and multispectral images complements the advan-tages of both modalities and allows to enhance the spatial as well as the spectral resolution, which finally leads to a better under-standing e.g. within material studies. In order to localize ma-terials within the pixel area and to enhance the spatial resolu-tion of the hyperspectral image data on subpixel level, there ex-ist several fusion and non-fusion-based methods (Mianji et al., 2009). In non-fusion-based methods the spectral resolution is en-hanced using only the hyperspectral image data by analyzing its spectral mixture. Here each pixel is divided to a specified num-ber of subpixels, wich are rearranged according to the endmem-bers and its fractional abundance using e.g.: spatial regularization tehniques (Villa et al., 2010), total variation minimization (Guo et al., 2009), or Hopfield neural network optimization (Nguyen et al., 2006). The main advantage of these methods is that they do not require any other information as contained in the hyperspec-tral image itself. These methods can be used for improved data visualization and understanding of hyperspectral images, but is not reliable for detailed image studies or provision of exact spa-tially located information like for object shape reconstruction.
∗Corresponding author. Email: [email protected].
Fusion-based methods require supplementary information from other sensors, which allow a more accurate restoration of real objects in the image. Eismann and Hardie (Eismann and Hardie, 2005) propose a maximum a posteriori estimation method used to enhance the resolution of hyperspectral images utilizing panchro-matic or multispectral images, but with the restriction that the spatial enhancement is limited to several principal components of the hyperspectral image. Multisensor, multiresolution tech-niques use the spectral unmixing results for reconstructing high resolution hyperspectral image pixel by pixel. Firstly the high resolution image is classified follwed by a window-based spec-tral unmixing of the hyperspecspec-tral image data. Secondly the mean class signal of the unmixing result is assigned to the correspond-ing pixels of the classified high resolution pixels (Zhukov et al., 1999).
The objective of this paper is to describe a novel method of in-formation fusion of hyper- and multispectral images for spatial resolution enhancement based on multi-modal data fusion and unmixing techniques. This is addressed from the perspective of applicability of the method, quality assessment by pixel based cross correlation in spectral and spatial domain and easy to use of the method.
2 METHODS
2.1 Spectral unmixing
Most of the pixels in hyperspectral satellite images are mixed i.e. they consist of signals from more than one source. The linear mixing model is the most commonly used to describe the physics foundations of complex hyperspectral mixing phenomena. This model assumes that every pixelxi,j is a linear combination of endmembers organized row-wise in a matrixM, factorized by the fractional abundances of each endmember represented by a vectora, with a second vectorucontaining the error for each band:
xi,j=M ai,j+ui,j (1)
Hyperspectral
Figure 1: Schema of the proposed algorithm. In a first step, from hyperspectral image endmembers are selected and unmixed, those retrieved endmembers are resampled to the multispectral channels model. The multispectral image is unmixed using the resampled endmembers. Finally a new high resolution hyper-spectral image is retrieved using the result of multihyper-spectral un-mixing and hyperspectral unun-mixing.
end-members and also quantifies the abundance fraction for each of them. As unsupervised FCLS requires the mixing matrixMto be known, to estimate the endmembers we perform in a preced-ing step a vertex component analysis (VCA). The VCA is a fast unsupervised unmixing algorithm which assumes that the end-members are the vertices of a simplex created on a hyperspectral data cloud (Nascimento and Dias, 2005).
2.2 Data resampling
To resample the spectral responses from the hyperspectral to the multispectral sensor we calculate the spectral integration as:
R(wi) = sensitivity of the channel,R(w)is the hyperspectral sensor’s re-sponse for the wawelengthw, which is considered continuous. We assume the spectral response function to be Gaussian dis-tributed for the multispectral sensor, and we model it as (van der Meer et al., 2001):
R(w) = 1
σ·√2π
e−(w2−µ)2
σ2 (3)
wherewis the continuous spectrum, whileµandσare respec-tively the central wavelength and the standard deviation for the i-th channel of the multispectral sensor.
2.3 Proposed Methodology
Hyperspectral unmixing provides information about the materi-als contained within one pixel, but does not help in locating any of these materials at subpixel level. We propose a simple and fast method to fuse a multispectral and a hyperspectral image, in or-der to combine the high spectral resolution of the hyperspectral sensor with the high spatial resolution of the multispectral sensor. Suppose to have a hyperspectral scenehwithlbands and a mul-tispectral imagemwithnbands, acquired over the same area on
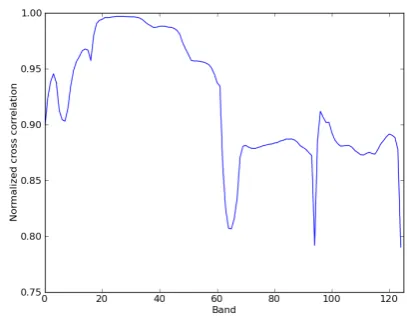
Figure 2: Plot of the normalized cross correlation computed for each band. Value 1 for normalized cross correlation means that signals are ideally correlated 0 when there is no correlation be-tween the signals.
ground and thoroughly coregistered, withn < l. In a first step we estimate the matrixMhrelated toh, composed ofkendmembers signatures, using the VCA algorithm. Subsequently, we resam-pleMhto the multispectral model using equation 2, obtaining a matrixMm. Finally, the endmembers contained inMmare used as input to compute the abundances of each endmember using FCLS. The result is an abundance vectoramof lengthk, quan-tifying the fraction of each endmember within the multispectral pixel. Similarly to 1, the model of the multispectral pixel can be written as:
xm=Mmam (4)
whereMmin ak×nresampled endmembers matrix, while the hyperspectral pixel can be represented as:
xh=Mhah (5)
whereMmin ak×nresampled endmembers matrix, while the hyperspectral pixel can be represented as:
xf =Mham (6)
To fuse the information from both images we apply once again the linear mixing model. The matrixMhis multiplied by the abundance matrix from the multispectral image, and as a result we obtain a new pixelamwithlbands. The fused image has the same spatial resolution as the multispectral scene. A sketch of the algorithm is illustrated in fig.1.
3 RESULTS AND DISCUSSION
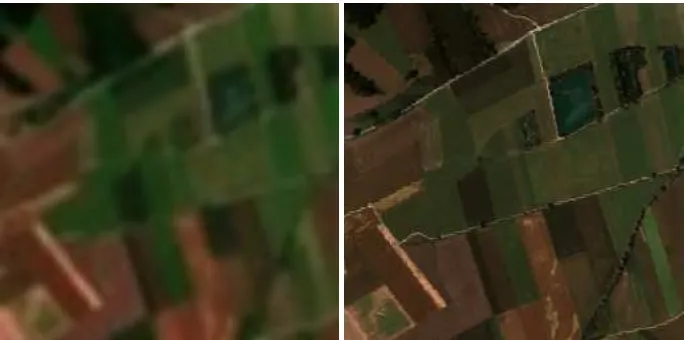
We tested the proposed algorithm using a 256×256 image ac-quired by the hyperspectral sensor HyMAP with 125 spectral channels, spanning the interval from 0.4 to 2.5µm, and a spa-tial resolution of 4 m (fig. 3. c). From the HyMAP image we generate a subsampled hyperspectral imageA(fig. 3. a) and a simulated multispectral imageB(fig. 3. b). To obtainAwe ap-plied a Gaussian lowpass filter and subseqently subsampled the HyMAP scene by a factor of 4, whileBwas obtained by resam-pling the hyperspectral image to the 8 spectral channels of the multispectral, ranging from 0.4 to 1.04µm.
Consequently we applied the algorithm described in section 2.3 to fuse the images. The area analyzed contains 7 types of vegetation, soil and water. After applying VCA to the imageAwe obtain 7
endmembers, which are then resampled to the channels of the imageB. For each resampled endmember we then computed its fractional abundance inB.
The result of the fusion algorithm is a 256×256 hyperspectral image with 125 spectral channels (fig. 3. d, f).
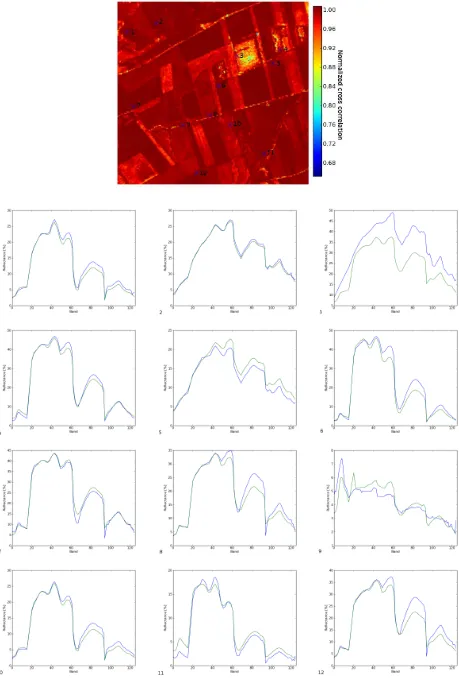
To asses the results we compute the normalized cross correlation between each pixel in the original hyperspectral image and in the fused image as:
wheremis an original pixel,kis a restored pixel,nis the num-ber of measurements inmandk,m¯and¯kare the mean values of
mandk, andσm,σktheir standard deviation. The normalized cross correlation was calculated the in spectral domain, i.e. the spectrum of each pixel in the restored image was compared to the spectrum of each pixel in the original image. Figure 4. a). shows the normalized cross correlation for all the pixels, which assumes a satisfactory average value of 0.96. We can observe a very good correlation for regions consisting of vegetation (fig. 4. [1, 2, 4, 6, 7, 10, 11, 12]). The restoration of spectra belonging to soil and roads (fig. 4.9.) was not that exact and some features, especially for bands>60, were not correctly restored. In order to measure the similarity between the images for each band, we computed a normalized cross correlation in the spatial domain. A single band from the restored image was compared to the same band from the original image using equation 7. The cross correlation in the spatial domain has a mean value of 0.89 in the spatial domain, where 0 and 1 represent respectively uncorrelated measurements and total correlation. The values are plotted in figure 2. The cross correlation is above 0.9 for bands from 0 to 47, which correspond to a spectral range from 0.4 to 1.1µmand cover the whole spec-tral range of the multispecspec-tral sensor. The correlation for bands 48 - 124 is over 0.85, even if these bands are not in the spectral range of the multispectral sensor, with the exception of several noisy bands. The plots from 1 to 9 of figure 4. show the original and restored spectra for selected pixels. From this spectra we can observe that, even when the cross correlation is lower, the main absorption features are preserved and remain clearly distinguish-able.
4 CONCLUSION
In this work a novel method for image fusion of hyperspectral and multispectral data based on spectral unmixing has been pro-posed. An image exhibiting high spatial (4m) and spectral (125 channels) resolution has been restored from a 16m resolution hy-perspectral image with 125 channels and a 4m resolution multi-spectral image with 8 channels. High values of cross correlation between the images show that both the spectral and the spatial information are well preserved. The proposed algorithm is easy to use and could be employed to increase the spectral informa-tion of a multispectral scene, given a thoroughly co-registered hyperspectral image. In the future the proposed algorithm should be tested with real images acquired by different sensors, and an optimal unmixing algorithm should be employed to enhance the endmember restoration in the multispectral image.
REFERENCES
Eismann, M. and Hardie, R., 2005. Hyperspectral resolution en-hancement using high-resolution multispectral imagery with arbi-trary response functions. Geoscience and Remote Sensing, IEEE Transactions on 43(3), pp. 455 – 465.
Guo, Z., Wittman, T. and Osher, S., 2009. L1 unmixing and its application to hyperspectral image enhancement. In: Society of Photo-Optical Instrumentation Engineers (SPIE) Conference Series, Presented at the Society of Photo-Optical Instrumentation Engineers (SPIE) Conference, Vol. 7334.
Heinz, D. and Chein-I-Chang, 2001. Fully constrained least squares linear spectral mixture analysis method for material quantification in hyperspectral imagery. Geoscience and Remote Sensing, IEEE Transactions on 39(3), pp. 529 –545.
Keshava, N., 2003. A survey of spectral unmixing algorithms a survey of spectral unmixing. Lincoln Laboratory Jurnal 14, pp. 55–78.
Mianji, F., Zhang, Y. and Babakhani, A., 2009. Optimum method selection for resolution enhancement of hyperspectral imagery. Information Technology Journal 8, pp. 263.
Nascimento, J. and Dias, J., 2005. Vertex component analysis: a fast algorithm to unmix hyperspectral data. Geoscience and Remote Sensing, IEEE Transactions on 43(4), pp. 898 – 910. Nguyen, M., Atkinson, P. and Lewis, H., 2006. Superresolu-tion mapping using a hopfield neural network with fused images. Geoscience and Remote Sensing, IEEE Transactions on 44(3), pp. 736 – 749.
van der Meer, F., Jong, S. D. and Bakker, W., 2001. Imaging spec-trometry: basic principles and prospective applications. Kluwer Academic Publishers.
(a) 64 × 64 pixels HyMAP hyperspectral input
image. Image resampled from original image
c).RGB composition, channels: 15, 7, 3.
(b) Simulated, 256×256 pixel Multispectral input image. Image resampled from original hyperspectral image c). RGB composition, channels: 5, 3, 2.
(c) Oryginal (template) 256 ×256, 125 channels, HyMAP hyperspectral image. RGB composition, channels: 15, 7, 3.
(d) Restored 256×256, 125 channels hyperspectral image, RGB composition, channels: 15, 7, 3.
(e) Original 256×256 hyperspectral image, chan-nel 80.
(f) Restored 256×256 hyperspectral image, chan-nel 80.
Figure 3: Input images used for experiment (a,b,c,e) and result images(d,f).