DESIGN AND IMPLEMENTATION OF SURROUNDING TRANSACTION PLOTTING
AND MANAGEMENT SYSTEM BASED ON GOOGLE MAP API
Yibing Cao a, Yixin Hua a, Junxi Zhao a, Shaomeng Guo b
a
Institute of Geo-Spatial Information, Information Engineering University, KeXue Street NO.62, Zhengzhou, China –
[email protected]
b
Huanghe Hydrographic Surveying and Mapping Agency, Dongming Street NO.206, Zhengzhou, China -
[email protected]
KEY WORDS: Architecture, Borderlands, Database, Decision Support, GIS, Internet/Web, Mapping, Real-time
ABSTRACT:
With China’s rapid economic development and comprehensive national strength growing, Border work has become a long-term and important task in China’s diplomatic work. How to implement rapid plotting, real-time sharing and mapping surrounding affairs has taken great significance for government policy makers and diplomatic staff. However, at present the already exists Boundary information system are mainly have problems of Geospatial data update is heavily workload, plotting tools are in a state of serious lack of, Geographic events are difficult to share, this phenomenon has seriously hampered the smooth development of the border task. The development and progress of Geographic information system technology especially the development of Web GIS offers the possibility to solve the above problems, this paper adopts four layers of B/S architecture, with the support of Google maps service, uses the free API which is offered by Google maps and its features of openness, ease of use, sharing characteristics, high-resolution images to design and implement the surrounding transaction plotting and management system based on the web development technology of ASP.NET, C#, Ajax. The system can provide decision support for government policy makers as well as diplomatic staff’s real-time plotting and sharing of surrounding information. The practice has proved that the system has good usability and strong real-time.
1. INTRODUCTION
As rapidly development of China's economic and society, diplomatic activities needs one kind of information system that can have the functions not only positioning but also show the changing of geographic information .The improvement of computer technology promotes the development of geography information services’ theory, technology and method, which can be used to make cartographic drawing possible. geographic information service is no longer just maps, it is a new mode based on computer technology, network technology, space technology, communication technology and geographic information technologies[1].
The traditional Boundary information system is due to the use of C/S architecture, not only used for a small range, but also need to consider both data and platform issues. GIS developers not only need to buy the company's GIS platform products but also need to buy the map products, the cost is expensive, however, there is such problem as too much data to update, lack of real-time plotting tools, and difficult to share multi-user geographic events which greatly restricted the border work. Web map services can address these issues and provides a new way to solve these problems, at present, the major online map service supplier offer free data and platform, publish the relevant data interface API, it is easy to use, simply need some development and integration, enabling developers to quickly embed a map to their web sites, and with the map data to provide users with location-based services. While allowing developers to take advantage of JavaScript scripting language for application, development and extend to add the user's specific needs. Of course, these data and platforms are free for any non-profit website[2] .
Current common electronic map services are:
(1) Google Map: It provides a complete electronic maps, remote sensing images, application programming interface and other services, is currently the best and most complete online electronic map services, Google released a full range of open-source development framework, this flag Google Map will become the basis for a common application of geographic information service platform[3].
(2)Yahoo! Map: It provides maps, remote sensing images, hybrid maps, however, it’s map service do better only in the United States, the clarity of remote sensing images cannot be compared with Google. It is also an open API, provide secondary development.
(3)Microsoft Virtual Earth: Microsoft's mapping service, also vying for market share with Google Maps products, including map services and a virtual 3D image. Also open API, provide secondary development.
(4)Baidu map: it is the country's map service for the general Internet users, the data only cover the Chinese territory. Also open API, provide secondary development.
(5)Tian map: China's independent Internet map service website, has just started, the richness of the information, the data update rate, web services functionality and performance need to be further improved. Also open API for secondary development[4], but the secondary development platform is not yet complete. This paper analyzes the common electronic map service platform based on taking into account the surrounding Affairs plotting aid management system with special needs, using Google map service based on ASP.NET and C# web development technologies, Ajax technology to achieve the spatial information surrounding Affairs plotting and expression; hotspot information management and maintenance; multi-user plotting information sharing and other functions. Ultimately
The International Archives of the Photogrammetry, Remote Sensing and Spatial Information Sciences, Volume XL-4/W3, 2013 ISPRS/IGU/ICA Joint Workshop on Borderlands Modelling and Understanding for Global Sustainability 2013,
provide the efficient real-time online map plotting and sharing tools for border workers to use.
2. RELEATED WEB TECHNOLOGIES
2.1 Google Map API
Google Map is Google's mapping service which provided to global, it includes GMaker, GPolyline, GPolygon, and other information. It has three forms which are traditional maps, satellite maps and hybrid maps. The traditional maps can provide guidelines for the users when they are moving and help them to find the direction directly. The Satellite maps can allow users to get the real shot aerial view of the current location and let users have immersive feeling. Combing with the use of traditional maps, it can let the users obtain more accurate sense of direction, which is the unreachable result by the traditional GIS technology. It was first lunched by Google in 2005 on its blog, and gradually expanded its coverage to global[5]. It is a free online mapping tool based on network browsers, which has had great impact on the whole Internet and GIS fields.
Google Map API is a Secondary Development Interface which is updated to V3 version. This API provides lots of practical tools used to deal with map, and add content to the map through a variety of services. Meanwhile it is a free service and can be used on all non-profit web sites. The developers are able to embed the Google map data into their sites to achieve personalized applications without creating map servers by themselves, it allow users to develop applications to add markers, polylines and other overlays, or respond clicks event to display the information windows.
Currently Google map has launched several API service like Maps JavaScript API, Maps API for Flash, Maps Data API, Earth API, Google Static Maps API. This platform is developed based on the version of Maps JavaScript API V2.
It can be divided into two parts by the features of the Google Maps API. Displaying is a part of the features, such as GMap2, GPoint, GIcon and GLatLng; and the other part is the extra features of Google Maps API, including GControl, GMapPane, GMaptype and GOverlay. Users and developers can use them to create their own controls, makers and map types. Here are some objects of the Google Map API[6]:
(1)GMap2. It is the core object of Google Map API, used to create and control the most basic feature of maps. It contains lots of class method, such as setCenter(), panTo(), setMapType() and so on.
(2)GControl. It is the general term for a group of objects, including GLargeMapControl, GSmallMapControl, GMaptypeControl and GScaleControl. It can manipulate a map.
(3)GMaker. Besides the GMap2 object, it is another important object of the Google Map API. It has many basic features, such as indicating the position, displaying the information and marking the address on the map.
(4)GInfoWindow. It is an object to provide information windows using the simple text or HTML.
(5)GPolyline and GPolygon. GPolyline is used to mark routes on the map, while GPolygon is to mark areas. Their class attributes and methods are very similar, and the direction of their application is the same.
2.2 ASP.NET
ASP.NET is a server-side Web application framework designed for Web development to produce dynamic Web pages. It was developed by Microsoft to allow programmers to build dynamic
web sites, web applications and web services. It was first released in January 2002 with version 1.0 of the .NET Framework, and is the successor to Microsoft's Active Server Pages (ASP) technology. ASP.NET is built on the Common Language Runtime (CLR), allowing programmers to write ASP.NET code using any supported .NET language. The ASP.NET SOAP extension framework allows ASP.NET components to process SOAP messages. It can be easily used to transfer data between the client and server side. It is a common technique to build Web-GIS.
2.3 AJAX
AJAX is the abbreviation of Asynchronous JavaScript and XML, it is a combination of several browser side web development technologies.
The traditional Web applications allow clients to fill out the form, when the form is submitted, it sends a request to the web server. The server receives and processes the form, and then returned to a new page, but this approach wasted a lot of web bandwidth, because in the majority of around the HTML code of two pages is often the same. Since each application is required to communicate the request to the server, the application response time depends on the server’s response time. This causes the user interface to respond much slower than the native application.
Unlike this, AJAX can only send and retrieve the necessary data, it uses SOAP or other XML-based page service interface, and the client using JavaScript to treat the data retrieve from the server’s response. Therefore, the data exchanged between the server and the browser has a significant reduction. The responsiveness of the server is improved, meanwhile, a lot of processing request can be done on the client machine, the web server load is reduced. It can make the web application smaller, faster and more friendly.
3. THE DESIGN OF SYSTEM ARCHITECTURE
The system architecture is shown in figure 1.The system use four-layer B/S architecture, and each floor of the architecture is independent from others. Any changes will not affect other layers. That means the architecture improves scalability of system greatly. The system divide into four layers from bottom to roof: data storage layer, data access layer, business logic layer and presentation layer.
Data Storage Layer (DSL): The function of data storage layer is managing data, and inquiring, modifying, updating the data from users, as well as map service. Including of the user’s plotting data that stored in SQL Server, news data and users data (they are called surrounding transaction data) and basic geography data which are stored in Google map server.
Data Access Layer (DAL): Data access layer is lay between data storage layer and business logic layer, which can provide an access to surrounding transaction data and server data from Google map.
Business Logic Layer (BLL): On the basis of data access layer, the business logic layer provides four kinds of services. They are plotting service, news service, user managing service and map service. It has a response to request from browse, and then send the query to the data access layer. By means of unified data access Interface, business logic layer can transfer the form of data which database can receive.(eg.SQL) Afterwards it will transform the backing data into HTML or other script form via logic dispose for client-side. For the spatial data operation (display, zoom etc), mainly use Google Map API to visit the image tiles from Google map servers.
The International Archives of the Photogrammetry, Remote Sensing and Spatial Information Sciences, Volume XL-4/W3, 2013 ISPRS/IGU/ICA Joint Workshop on Borderlands Modelling and Understanding for Global Sustainability 2013,
The Presentation Layer (PL): The presentation layer is located to client-side browser, customer can use the browser response and interaction with the system, sending data request to the server and displaying returned data in the surrounding transaction plotting and management system platform.
Figure 1. The System Architecture
4. SYSTEM DETAILED DESIGN AND IMPLEMENTATION
Detailed design of system mainly includes database design and design for major modules. In order to make the research to realize, we need some technical design, and analyzing the issue during the process as well as the key technical methods to conquer them.
4.1 Database Design and Implementation
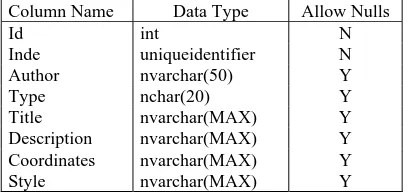
The system adopt SQL server database, which mainly used to storing user data, plotting data, news data and other surrounding transaction data. When the user mark a maker, polyline or polygon plot, the system gain coordinate message (one or more coordinate point) of plotting object via the Google map server. After that system could add the plotting title, description which the user put in, and the additive news message, plotting style that the customer set up into tb_plots table; Storage news headline, context into tb_news table, plotting and news can have a relevance by means of unique GUID; When one user want to view the plotting message of others, they can pay attention to other user. In this way, we can realize real time-share for geography events. Users’ basic information is stored in tb_users table, tb_users and tb_plots have a relevance via user’s name. When we set up the system, surrounding transaction data in database can have a relevance with Google map’s spatial data through longitude and latitude. Here are parts of tables in database:
Column Name Data Type Allow Nulls Id int Table 1. Definition of tb_plots
Column Name Data Type Allow Nulls Id int Table 2. Definition of tb_users
Column Name Data Type Allow Nulls Id int
Table 3. Definition of tb_news
4.2 Design and Implementation of Functional Modules
The system separates into two modules based on the function: The foreground surrounding transaction plotting module and the background auxiliary management module. Every module includes several sub-modules, and the functional module of the system is shown in the Figure 2.
Figure 2. The System Major Functional Modules (1) The login and register module
When you resgister a new customer, a record will be written on the tb_users. At this time, there is no attention message on the table and the attention field is blank; also there is no plotting on the tb_plots; there is now no news relate to the plotting. (2) The plots dispaly module
The user’s plots display as a layer. Every user is a layer. When the user add some plots and pay attention to other users, the
news management module
user login and register module
plots management module
News Service User Service Plotting Service
DAL
PL Surrounding Transaction Plotting and Management S
HTTP HTTP
Map Service
The International Archives of the Photogrammetry, Remote Sensing and Spatial Information Sciences, Volume XL-4/W3, 2013 ISPRS/IGU/ICA Joint Workshop on Borderlands Modelling and Understanding for Global Sustainability 2013,
plots of other user’s will be display on your plotting list. The user can handle the state of a layer or a single plot in the list. When the user click on the plot in the left list, the map will locate the plot and display the description and the news link. When click on the news link, the news relate to plot will open.
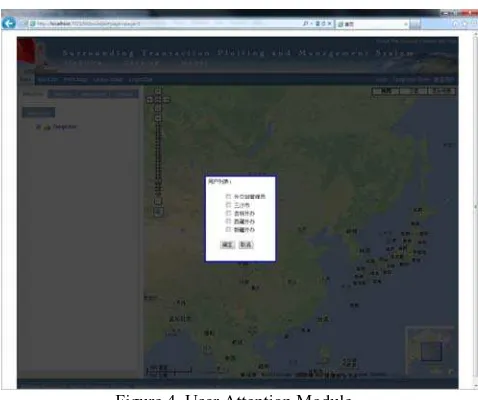
Figure 3. Plots Display Module (3) The user attention module
The user can display the plots of another user’s in the friend list by adding other user’s attention. And then the user can share the present plotting information on the internet.
Figure 4. User Attention Module (4) The plots searching module
The system offers three searching mode, such as site searching, Google map searching and all. The site searching can search all the plots in the database by keyword matching. The Google map searching can search the plots in the Google map server. The all mode can search all the plots.
(5) The user plot module
First, choose the type of the plotting (maker, polyline, polygon). Then mark on the map. And last set the headline, description and style of the plotting and add news relate to the geographic location.
(6)The back module
This module is used to manage users, news and plotting. This module also can delete, change, search the information and
handle the business logic. For example, when you delete a user, you need to delete the plots and the news relate to the plots at the same time.
Figure 5. Plots Searching Module
Figure 6. User Plot Module
5. CONCLUSION
The design and use of surrounding transaction plotting and management system have changed the traditional type that The boundary information system organise and manage data. Because using the Google Map API, the developers do not need to consider the data updating and the cost of system development and maintenance has reduced. The system offers many plotting tools to mark different geographic events based on the requirement. And changing the plotting into layer is helpful for many people to share the present geographic information. The system satisfies the government policy makers and the Border workers. The fact has proved that the system is useful and real-time.
References
[1] Yuefeng Liu. Overview of Geographic Information Services[J]. Geographic Information. 2004, 2(6).
The International Archives of the Photogrammetry, Remote Sensing and Spatial Information Sciences, Volume XL-4/W3, 2013 ISPRS/IGU/ICA Joint Workshop on Borderlands Modelling and Understanding for Global Sustainability 2013,
[2] Yi Ding, Hong Peng. Google Maps API in WebGIS Positioning Research[J]. Electronic Science and Technology of Hangzhou University. 2012, 32(5).
[3] DigitalGloble Inc. WorldView-1[EB/OL]. [2008-4-16]. http://www.digitalgloble.com/.
[4] Tian Map[EB/OL]. http://baike.baidu.com/view/ 4559007.htm.
[5] Maurizio Gibin, Alex Singleton, Richard Milton, Pablo Mateos, Paul Longley. Collaborative Mapping of London Using Google Maps:The London Profiler, UCL WORKING PAPERS SERIES, Paper 132-Mar 08.
[6] Google Map API[EB/OL], http://code.google.com/intl/. [7] Rongliang Luo, Yunru Shen. The Design and Implementation of Public Bike Information System Based on Google Map[J].2009 International Conference on Environmental Science and Information Application Technology.
The International Archives of the Photogrammetry, Remote Sensing and Spatial Information Sciences, Volume XL-4/W3, 2013 ISPRS/IGU/ICA Joint Workshop on Borderlands Modelling and Understanding for Global Sustainability 2013,
![KANTOR PERWAKILAN PROV. SULBAR DI JAKARTA [Paket Penyedia].](data:image/gif;base64,R0lGODlhAQABAIAAAP///wAAACH5BAEAAAAALAAAAAABAAEAAAICRAEAOw==)