ACCURACY EVALUATION OF TWO GLOBAL LAND COVER DATA SETS OVER
WETLANDS OF CHINA
Z. G. Niu
a*, Y. X. Shan
a, P. Gong
a,b aState Key Laboratory of Remote Sensing Science, Institute of Remote Sensing Applications, Chinese Academy
of Sciences, Beijing, 100101, [email protected]
b
Institute for Global Change Studies Tsinghua University, Beijing, 100084
Theme or Special Session: VII/4: Methods for Land Cover
KEY WORDS:
GLC2000, MODIS, China, Wetland, Remote sensing, Accuracy Evaluation
ABSTRACT:
Although wetlands are well known as one of the most important ecosystems in the world, there are still few global wetland mapping efforts at present. To evaluate the wetland-related types of data accurately for both the Global Land Cover 2000 (GLC2000) data set and MODIS land cover data set (MOD12Q1), we used the China wetland map of 2000, which was interpreted manually based on Landsat TM images, to examine the precision of these global land cover data sets from two aspects (class area accuracy, and spatial agreement) across China. The results show that the area consistency coefficients of wetland-related types between the two global data sets and the reference data are 77.27% and 56.85%, respectively. However, the overall accuracy of relevant wetland types from GLC2000 is only 19.81% based on results of confusion matrix of spatial consistency, and similarly, MOD12Q1 is merely 18.91%. Furthermore, the accuracy of the peatlands is much lower than that of the water bodies according to the results of per-pixel comparison. The categories where errors occurred frequently mainly include grasslands, croplands, bare lands and part of woodland (deciduous coniferous forest, deciduous broadleaf forest and open shrubland). The possible reasons for the low precision of wetland-related land cover types include (1)the different aims of various products and therefore the inconsistent wetland definitions in their systems; (2) the coarse spatial resolution of satellite images used in global data; (3) Discrepancies in dates when images were acquired between the global data set and the reference data. Overall, the unsatisfactory results highlight that more attention should be paid to the application of these two global data products, especially in wetland-relevant types across China.
1.
INTRODUCTION
Wetlands are among the most valuable ecosystems in the world and supply highly valuable services for human welfare (Costanza, 1997). Accurate information on global wetland areas and their spatial distribution is therefore important for wetland management and research. However, there are few global wetland mapping efforts at present. The Ramsar Sites Database includes 1757 internationally important wetland sites covering 158 countries. [http://ramsar.wetlands.org/Database /AbouttheRamsarSitesDatabase/tabid/812/language/en-US/Def ault.aspx]. The Global Lakes and Wetlands Database (GLWD), which has been developed jointly by the World Wide Fund for Nature (WWF) and the Center for Environmental Systems Research, University of Kassel, Germany, provide the current generation of a variety of existing maps, data and information on the global wetlands together with the application of Geographic Information System. (Lehner et al., 2004) . However, the application of the GLWD faces challenges because the information cannot be updated in time. Though GlobWetlandⅡ project, launched by the European Space Agency (ESA) in collaboration with the Ramsar Secretariat in 2009, aimed principally to develop a Global Wetlands Observing System information system, only over 200 wetland sites in the Mediterranean basin were included in the system. Until now there has been no global wetland data products based on identical satellite remote data. Therefore, the global land cover data sets, though which were not designed for the extraction of wetland, are the only available data sets at global scale.
China, with the unique Tibetan wetlands, has extensive rich wetland types and the total wetland area (except for rice paddies) is about 3.595*105km2 (Niu,et al., 2009). China
wetlands, therefore, are representative of the world’s wetlands both in amount and wetland types, and can be used to evaluate the precision of the wetland-related types in global land cover datasets.
Since the 1990s, a series of improvements have been made in Land Use/Cover mapping based on the remote sensing data source at global scale. So far, there are four global land cover data sets available with 1 km spatial resolution, which include IGBP DISCover, UMD land cover products, the MODIS land cover products and Global Land Cover 2000 GLC2000 , in which the AVHRR, MODIS, VEGETATION images are used respectively. Another new data set - Globcover Land Cover (2005 and 2009) with 300m spatial resolution - has been produced recently by ESA through an international partnership at global scale.
not only very low, but also greatly different due to the various samples they used in validation.
Until now, traditional manual interpretation is still the most effective method to assess the precision of the classification and it is also regarded as the highest precision classification method. In addition, there is no precedent comparison of global data set with the thematic products among all the research. Due to the wetland category’s complexity, the wetland is usually treated as other different types in different land cover classification schemes, and this is the reason why there is such a low accuracy for wetlands in all the above comparison research among the global land cover data sets. Based on the Landsat TM images across China, Niu et al. (Niu et al., 2009)had completed the wetland mapping by manual interpretation. The two global land cover data sets-GLC2000 and MOD12Q1 were evaluated based on China wetland mapping products in this study, and the results of evaluation are discussed.
2. DATA SOURCES AND PROCESSING
2.1 Data preparation
GLC2000 global land cover data have been produced by an international partnership of 30 research groups coordinated by the European Commission’s Joint Research Centre, based primarily on SPOT 4-VEGETATION daily 1-km data from November 1999 to December 2000(Loveland et al., 2000). The global classification scheme is assigned to a LCCS land cover legend (Herold et al., 2008) . The MODIS land cover product (MOD12Q1) is based on the spectral information supplied by the MODIS sensor on-board Terra. All monthly inputs have been produced from MODIS Levels 2 and 3 data between November 2000 and December 2001 and include seven spectral bands, the enhanced vegetation index (EVI), spatial texture, land surface temperature, snow cover, elevation and a water mask (Strahler et al., 1999). The classification combines prior and posterior probabilities to assign the most probable class for
each location on the globe based on the IGBP classification scheme with 17 classes (Loveland et al., 2000). The classification uses a universal supervised approach with a multi-temporal decision tree algorithm and selects the training region from the high resolution image together with the ancillary data sets (Friedl et al., 2002).
The wetland map of China was produced by IRSA (Institute of Remote Sensing Application Chinese Academy of Sciences) based on completely manual interpretation with the minimum cartographic unit area of 9 hectares (Niu et al., 2009). The wetland classification system is based on the Ramsar Convention and the classification of China National Forest Bureau during the first wetland survey between 1995 and 2001(Gong et al., 2010).
2.2 The crosswalk between different classification systems for the wetland
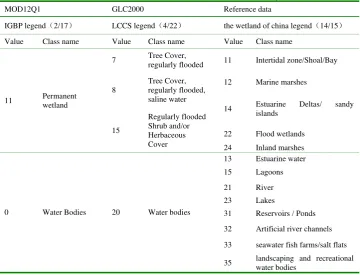
The wetlands contain different land types in each global land cover data set because the global data sets and the reference data adopt different classification systems. But we cannot divide the available wetland types into more detailed classes so as to make the wetland class one-to-one correspondence among these different classification systems. Therefore the IGBP classification system that contained the least wetland-related types was chosen as the standard one. Then wetland types in the reference data set and wetland-related landcover types in the LCCS were converted to the IGBP system (table 1). There are two wetland-related types in the MOD12Q1 including permanent wetland and water. Permanent wetland can be considered as peatland to a very great extent (Pflugmacher et al., 2007). In order to be distinguished from other wetland terms, permanent wetland was named as “peatland” and water was named as “wetland water” in our research. In addition, the paddyfields which were not included in the reference data sets were not assessed.
Table 1 the crossover between different classification systems
MOD12Q1 GLC2000 Reference data
IGBP legend 2/17 LCCS legend 4/22 the wetland of china legend 14/15
Value Class name Value Class name Value Class name
11 Permanent
wetland
7 Tree Cover,
regularly flooded 11 Intertidal zone/Shoal/Bay
8
Tree Cover, regularly flooded, saline water
12 Marine marshes
14 Estuarine Deltas/ sandy
islands
15
Regularly flooded Shrub and/or Herbaceous Cover
22 Flood wetlands
24 Inland marshes
0 Water Bodies 20 Water bodies
13 Estuarine water
15 Lagoons
21 River
23 Lakes
31 Reservoirs / Ponds
32 Artificial river channels
33 seawater fish farms/salt flats
35 landscaping and recreational
36 Others
The two global landcover data layers were clipped based on the Chinese administrative boundary in a scale of 1:1,000,000, and were transformed to the same projection as the reference data. The reference data was then rasterized with 1-km resolution and finally these 3 data sets were transformed according to the crossover of them (table1). After that, these data were overlapped and the corresponding results were analyzed by GIS tools.
2.3 Comparison and evaluation methods
2.3.1 Class area consistency: Class validation checks were made to see whether the wetlands class characters (e.g. area) of the global land cover data sets was in accord with that of the reference data. We calculate the area consistency coefficients between the wetland-related landcover types from the two global data sets and the reference data using the following equation:
Where CC isthe area consistency coefficient; Ki is the area of the number i categories wetlands in the calculated global land cover data set; and Ni is the area of the corresponding categories in reference data. The bigger the consistency coefficients, the better the consistency between the calculated data we have, and vice versa.
2.3.2 Spatial consistency: The confusion matrix, namely error matrix, is a standard format of the precision validation (Zhao, 2003). Generally, the confusion matrix of classified remote data was calculated to get the Kappa coefficients to validate spatial agreement between the classification data and the reference data (Li et al., 2009). The confusion matrix of wetlands between the MOD12Q1/GLC2000 and the reference data were built, and the kappa coefficients were calculated.
Another approach to validate the global data sets is the pixel-to-pixel comparison between different data sets. We adopt this approach to assess the spatial precision of the two global land cover products. Specifically, the reference rasterized data and the global landcover product were firstly overlapped spatially. The pixels with the same value between the global landcover data set and the reference data was retained, while pixels with different values were labeled as areas of disagreement with new value. So there are nine classes in combination in the results. Because the non-wetland part belongs to no data in results, only eight combinations were summarized. These results describe the spatial location consistency between the landcover data and the reference data.
Afterwards, the following equations (Wu et al., 2009)were used to calculate the spatial consistency:
100%
Where O is the spatial consistency coefficient; A is the pixel account of agreement class, e.g. peatlands/peatlands, waters/waters; B is the pixel account of disagreement, e.g. waters/peatlands, non-wetlands/peatlands and so on.
3 Results and discussion
3.1 Class area accuracy
Table 2 shows that the wetland area of these two global data sets are both less than the area of the reference data as a whole. However, the GLC2000 data has higher consistency than MOD12Q1 data with the reference data in area consistency (77.27%>56.85%). At the same time the area consistency of wetland water is much better than that of peatlands in both the global landcover data sets.
Table 2 the results of the class accuracy comparison
Product Wetland
GLC2000 196065 84.29 60272 37.13 256337 77.27
MOD12Q1 171886 98.56 16712 10.30 188598 56.85
Reference data 169444 162315 331759
Table 3 the confusion matrix between two global landcover data sets and the reference data
Referencedata
Peatland Wetland
water
unclassified 91.90 59.81
0.0886 19.81%
Peatland 3.32 3.78 3.32 46.92
Wetland water 4.78 36.41 36.41 88.33
MOD12Q1
unclassified 95.12 61.62
0.0913 18.91%
Peatland 0.10 0.55 0.10 14.83
Wetland water 4.79 37.83 37.83 88.71
The higher consistency of wetland water implies that automatic extraction of this wetland type can meet requirements in most circumstances. The inconsistency occurring in the peatlands is in accord with the results of existed research, which means that there are still a great many uncertainties in the extraction of
peatlands by automatic computer classification.
3.2 Spatial consistency
reference data (table 3). The peatlands’ precision of the GLC2000 is obviously higher than the one in MOD12Q1 (3.32%>0.10%). In both data sets, the wetland waters’ accuracy is also better than that of peatlands, which are close at 36.41%
and 37.83%, respectively. Both the user precision and the producer precision of the GLC2000 and MOD12Q1 show that the wetland waters’ precision is better than the peatlands’. This is same as that of the area comparison above.
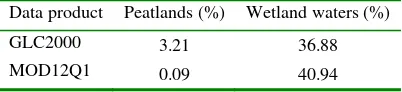
3.2.2 Pixel-to-pixel comparison: Table 4 is the result of consistent coefficients based on equation 2. From table 6 we can obviously conclude that the wetland water agreement of the two data sets is similar, in which the agreement proportion of the GLC2000 and MOD12Q1 is 36.88% and 40.94%, respectively. But the agreement of peatlands of both data sets is much lower, in which the GLC2000’s coefficient is larger than MOD12Q1’s (3.21%>0.09%). In general, the comparison of these two data sets with reference data is not satisfied.
Table 4 the results of the spatial agreement Data product Peatlands (%) Wetland waters (%)
GLC2000 3.21 36.88
MOD12Q1 0.09 40.94
3.3 Discussions
3.3.1 Errors distribution among the global landcover types
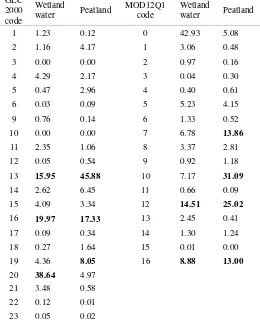
In order to find out which landcover types are easily confused with wetlands, the global land cover data sets were overlapped spatially with reference data and the results were summarized into table 5. The landcover types that are not wetland-related in global data sets, but are wetland types in the reference wetland data, were considered as omissions.
Regarding to Peatlands, the maximum omission of the GLC2000 data set occurred in Herbaceous Cover (closed-open) (13). And then Cultivated and managed areas (16), Bare Areas (19), Sparse herbaceous or sparse shrub cover (14). Moreover, the omission proportion with waters (20), closed deciduous broadleaved tree Cover (2) and deciduous needle-leaved tree Cover (5) are also great.
The reason that omission occurred mostly in herbaceous cover (45.88%) is partly because of the different definition of wetland. The meadow was regarded as wetland in reference data sets. Whereas, the regularly flooded shrub and/or herbaceous cover is considered as the herbaceous cover in the GLC2000, in which the definition of the Herbaceous cover is “herbaceous cover, closed to open (>15%)”, therefore, the overlapping definition between the regularly flooded shrub and/or herbaceous cover and herbaceous cover exists. Due to the absence of a special peatlands class here in the GLC2000, we transformed the regularly flooded shrub and/or herbaceous cover (15) into the peatlands class according to their definition. Another reason is the unsupervised classification approaches used in the GLC2000 data set, which has low classification precision of grassland and marshes so that the producer precision of the Herbaceous Cover is only 49.8%, and the user precision is also just 40.5% (Herold et al., 2008) . In addition, There exists similar spectrum responses of the cropland and Herbaceous Cover. Another reason is the mixed pixel. As the scattered distribution of the cropland around the wetlands and the coarse (1km) resolution of the GLC2000, the inevitable existence of the mixed pixel leads to confusion between the peatlands and cropland. Although cropland could represent a clear texture feature, the texture feature is not available on the images at 1km resolution, while it reflects very clearly on the TM images which the reference data is based on. A typical example is the flooded wetland in a river valley where lots of
croplands and flooded wetlands merge indiscriminately with each other.
According to the definition of the Intertidal zone/Shoal/Bay class in the reference data that is “the coastal beach with vegetation cover<30% and the bottom substrates that consist of rocks, gravel, mixed sand and stones or the mucky”, this wetland type could be partly considered as bare area in the GLC2000 data set. A similar situation may also occur in the wetland type of the Delta at estuary/alluvial/ sand island in the reference data set. In view of the overlapping definition of class between these two data sets, we extracted the classes of the flooded wetlands, the Intertidal zone/Shoal/Bay and the Delta at estuary/alluvial/ sand island from peatlands, merged them as new one class “flooded area”, and compared them spatially with GLC2000. The results show that area of the peatlands’ omission decrease from 13059 km2 to 5193 km2. The omission proportions of the flooded area in the Herbaceous Cover(closed-open)(13), bare areas(19), croplands(16), Sparse herbaceous or sparse shrub cover (14), waters (20) and closed deciduous broadleaved Tree Cover (2) are 38.26%, 16.51%, 14.21%, 10.35%, 9.98% and 1.95%, respectively.
The mixing up of peatlands and water largely arises from the various acquisition dates of satellite images and the different spatial resolutions between these two data sets. This phenomenon is especially obvious in arid and semi-arid regions where the change of wetland water area would be twice or even more in a year. Compared to a relatively high spatial resolution of reference data source, the mixed pixel in the GLC2000 data sources also contribute to a large extent to the omission of peatlands.
The confusion between the peatlands and forest cover classes (such as closed deciduous broadleaved Tree Cover (2) and deciduous needle-leaved Tree Cover (5)) is possibly relevant in the forest swamps in most areas of North-eastern China. Patches of forest swamps are distributed in the alpine areas forest belt of China, especially the coniferous tree cover and mixed forest tree cover in the cool temperate zone (Niu & Ma, 1985). Forest swamp classes were included in the reference data and this may lead to the confusion between peatlands and forests, which can be validated in the following analysis of the omission’s regional distribution.
The landcover class omission of the MOD12Q1 data set is greatly similar with that of GLC2000, in which the main landcover types include: Grasslands (10), Croplands(12), Open Shrublands (7), Barren or Sparsely Vegetated (16), Water Bodies (0)and Mixed Forest(5). The reason is also same as those of GLC2000, though they are based on different images data. At the same time, the MODIS IGBP product may overestimate woody cover proportions (Pflugmacher et al., 2007). This phenomenon can be well explained by the confusion of the peatlands and mixed forest.
types are in sequence Croplands (12), Barren or Sparsely Vegetated (16), Grasslands (10), Open Shrublands (7), Mixed Forest (5), Woody Savannas (8) and Evergreen Coniferous Forest (1).
Croplands, grasslands and bare areas in both global data sets are the landcover types where wetland water omission is most likely to occur because of the coarse spatial resolution of global data sources. The inherent limitation of coarse spatial resolution during landcover classification mapping is well known (Latifovica et al., 2004), and the mixed pixels (the heterogeneity landscape of the landcover categories) contribute largely to product error. The second reason is the difference of the acquired date of data sources. Usually wetland water changes dynamically along with the seasons and the changes are huge due to the distinct seasonal precipitation pattern across China. An example is the confusion between established water bodies in the reference data and the regularly flooded shrub and/or herbaceous cover data obtained by GLC2000.
The reason for wetland water being mistakenly classified as snow and ice is the different acquisition date of satellite images between the global data set and the reference data. For example, the great omissions of wetland water in area of north Tibet, southwestern of Qinghai, the Boston lake region and the Sayram lake area was caused possibly by using winter images of GLC2000. In addition, the crystallization of a salt lake is similar to a water lake in the satellite images, and this will also cause some errors in the classification results (Hong et al., 2006).
Table 5 the omission proportion (%) between the global
land cover products and reference data
GLC 2000 code
Wetland
water Peatland
MOD12Q1 code
Wetland
water Peatland
1 1.23 0.12 0 42.93 5.08
2 1.16 4.17 1 3.06 0.48
3 0.00 0.00 2 0.97 0.16
4 4.29 2.17 3 0.04 0.30
5 0.47 2.96 4 0.40 0.61
6 0.03 0.09 5 5.23 4.15
9 0.76 0.14 6 1.33 0.52
10 0.00 0.00 7 6.78 13.86
11 2.35 1.06 8 3.37 2.81
12 0.05 0.54 9 0.92 1.18
13 15.95 45.88 10 7.17 31.09
14 2.62 6.45 11 0.66 0.09
15 4.09 3.34 12 14.51 25.02
16 19.97 17.33 13 2.45 0.41
17 0.09 0.34 14 1.30 1.24
18 0.27 1.64 15 0.01 0.00
19 4.36 8.05 16 8.88 13.00
20 38.64 4.97
21 3.48 0.58
22 0.12 0.01
23 0.05 0.02
**Note:Fresh water regularly flooded Tree Cover (7) and saline water regularly flooded Tree Cover (8) was not included
in GLC2000 data over parts of China.
3.3.2 Spatial distribution of omission of wetland: Though the omission of wetland in both global landcover data sets distributed widely and sparsely across China, it mainly happened in the Northeast China region, Northwest China region, the Tibetan Plateau, the low reaches of the Yangtze River and parts of the coastline.
In Northeast China, apart from mixed forest (5) and open shrubland (7) in the MOD12Q1 data set, herbaceous cover (closed-open) (13) and cropland (16) are the most likely landcover types to be confused with wetland in both global data sets. The omission of wetland is most occurred spatially in Sanjiang Plain, part of Song-Nen Plain, areas along the banks the Hai La Er upriver, the Hulun buir Grassland, the foot of
Greater Higgnan Mountains and Lesser Khingan Range. Errors in the MOD12Q1 data set were also found around Liaohe estuary in Liaoning province. Apart from the distribution of marshland in Northeast China, one of the great commodity grain bases and Three Forests Zones in China are also distributed alternately in this region, which may account for the mistakes between wetland types and cropland, forests and grass landcover types.
In the northwest China, the omissions of wetlands are very serious and are mainly distributed in Xinjiang, Qinghai and parts of Inner Mongolia. The bare area (19), herbaceous cover (closed-open) (13), sparse herbaceous or sparse shrub cover (14) in the GLC2000 data set and barren or sparsely vegetated(16), grass land (10) and open shrubland (7) in the MOD12Q1 data set are the most confused landcover types, respectively. The confusion with the Herbaceous Cover(closed-open) (13) and Sparse herbaceous or sparse shrub cover (14) largely show the mosaic distribution of the river plains of the Tarim River and the Yili River,Boston Lake, and Aydingkol lake. At the same time, wetland types distributed along rivers in North Qinghai, central and west Xinjiang and parts of the Alxa regions of Inner Mongolia, are mistakenly classified as bare areas (19) in global land cover data sets.
Except for barren or sparsely vegetated(16) and open shrubland (7) in MOD12Q1 data set, the herbaceous cover(closed-open) (13) in both global data sets is the most mistakenly interpreted landcover type confused with wetland in the Tibetan Plateau and Zoige regions in Sichuan province, where the known Zoige swamp and all kinds of meadows are distributed widely. In comparison, the confusion of wetland with farmland occurs mostly around inland water bodies and shorelines in East China, such as Poyang Lake in Jiangxi province.
Overall, the spatial distribution of the confusion between MOD12Q1 data set and the reference data is similar to that of GLC2000 data set, which is possibly controlled by the spatial patterns of wetland in China.
4 CONCLUSIONS
To assess the suitability of existed global land cover products for global wetland research, the precision of wetland-related landcover types in two global land cover data sets, GLC2000 and MOD12Q1, was calculated and analyzed by referencing China wetland maps. Some conclusions or suggestions are as follows:
peatland in both global land cover data sets. It may, therefore, suggest that the precision wetland water based on computer automatic extraction methods could meet the demands of research at the global scale. However, the very low precision of identification of peatland means that there are still substantial uncertainties in these wetland-related landcover types data when used directly as wetland type data; on the other hand, improvements in the classification algorithms related to peatland extraction should be made in the future.
( ) The agreement between the GLC2000 data and reference data is higher than that of MODIS data and reference data from both the class area and the spatial location. This is possibly because of the different classification algorithms between the global data sets. Since the GLC2000 is developed by the coordination of the more than 30 groups, utilizing different classification algorithms, different evaluation methods and various regional schemes from region to region, the precision of GLC2000 is available at regional scale. In comparison, the MODIS global landcover data set is generated at global scales aiming at various global research areas including climate change, biodiversity conservation, ecosystem assessment, and environmental modeling and they adopt the uniform classification algorithm for the convenience of periodic updating. Therefore, the MODIS data set is more practical for research at global scale.
The class-specific accuracies of 38.1% and 45.9% in the MOD12Q1 and GLC2000’ peatlands by Herold et. al(Herold et al., 2008) have been calculated from the original samples using documented theory for stratified random sampling and considering the map area proportions for each class. Given the different samples and validation frameworks, it is inappropriate to compare the absolute numbers of accurate directly.
( ) The main reasons for low precision in these two global land cover products include (a)the different aims of various products and therefore the inconsistent wetland definitions in their systems; (b) the coarse spatial resolution of satellite images used in global data, which leads to the existence of substantial mixed pixels that could greatly, reduce the classification precision of global data sets especially for fragmentized and heterogeneous landscapes; (c) Discrepancies among the image data used in global data sets and reference data. Because of the highly dynamic characteristics of wetlands, the difference in image acquisition date usually leads to discrepancies among data sets, especially in areas with distinct seasonal variation.
Much more attention must be paid during the application of existing global land cover products in global /wetland-related research due to their low precisions. At the same time, it is necessary to develop wetland-specific landcover classification schemes and image classification methods by using multi-sources and multi-classifiers in future.
Acknowledgement:
We are greatly thankful for careful revision by Arthur Cracknell. This work was funded by the National High-tech R&D Program of China (863 Program 2009AA122003-7).
References:
Costanza R.A., Groot R., et al., 1997, the value of the world's ecosystem services and natural capital. Nature, 386, 253-260.
Friedl M.A., McIver D.K., Hodges J. C. F., et al., 2002, Global land cover mapping from MODIS: algorithms and early results. Remote Sensing of Environment, 83, 287-302.
Giria C., Zhu Z.L. and Reed B., 2005, A comparative analysis of the Global Land Cover 2000 and MODIS land cover data sets. Remote Sensing of Environment, 94, 123-132.
Gong P., 2009, Accuracy evaluation of the global land cover based on the global flux observation sites. Progress in Natural Science, 19, 754-759. (In Chinese)
Gong P., Niu Z.G., Cheng X., et al., 2010, China's wetland change (1990-2000) determined by remote sensing. Scince china earth sciences, 53(7), 1036-1042.
Herold M., Mayaux P., Woodcock C.E., et al., 2008, Some challenges in global land cover mapping: An assessment of agreement and accuracy in existing 1 km datasets. Remote Sensing of Environment, 112, 2538–2556.
Hong Z.G., Dai E.F., Lin Z.J., et al., 2006, The method on image recognizing and interpreting surface hydrologic features with remote sensing on qinghai tibetan plateau. Science of Surveying and Mapping, 3, 82-84.
Li G.L., Du P.J., Wang X.M., et al., 2009, Consistency Evaluation and Integration Application of Land Cover Classification Results from Multi-source Remotely Sensed Images. Geography and Geo-Information Science, 25, 68-71. Lehner B. and Petra, 2004, Development and validation of a global database of lakes, reservoirs and wetlands. Journal of hydrology, 296, 1-22.
Loveland T.R., Reed B.C., Brown J.F., et al., 2000, Development of a global land cover characteristics database and IGBP DISCover from 1 km AVHRR data. International Journal of Remote Sensing, 21, 1303-1330.
Niu H.G.&Ma X.H., 1985, The swamp wetland in china. The Commercial Publishing Service, Beijing, china
Niu Z.G., Gong P., et al., 2009, The preliminary mapping of remote sensing over china and corresponding geography analysis. Scince china earth sciences, 39, 188-203.
Pflugmacher D., Krankina O., Cohen W. B., 2007, Satellite-based peatland mapping: Potential of the MODIS sensor. Global and Planetary Change, 56, 248-257.
Latifovica R., Olthof I., et al., 2004, Accuracy assessment using sub-pixel fractional error matrices of global land cover products derived from satellite data. Remote Sensing of Environment, 90, 153-165.
Ran Y.H., Li X., Lu L., 2010, Evaluation of four remote sensing based land cover products over China. International Journal of Remote Sensing, 31, 391-401.