TOMOGRAPHIC SAR INVERSION FROM MIXED REPEAT- AND SINGLE-PASS DATA
STACKS – THE TERRASAR-X/TANDEM-X CASE
Xiao Xiang Zhu a, b,Richard Bamler a, b a
German Aerospace Center (DLR), Remote Sensing Technology Institute (IMF), Oberpfaffenhofen, 82234 Wessling,
Germany. (xiao.zhu, richard.bamler)@dlr.de
b
Technische Universität München, Lehrstuhl für Methodik der Fernerkundung, Arcisstraße 21, 80333
Munich, Germany
Commission VII/2: SAR Interferometry
KEY WORDS: Tomographic SAR Inversion, TanDEM-X data, SL1MMER
ABSTRACT:
This paper presents the first demonstration of high precision very high resolution tomographic SAR inversion with the assistance of TanDEM-X data. The data quality of TerraSAR-X and TanDEM-X is investigated. TomoSAR algorithms such as SVD-Wiener, Nonlinear Least Squares and SL1MMER are extended for mixed repeat- and single-pass data stacks. A systematic approach is proposed for the fusion of TerraSAR-X and TanDEM-X data in which the different data quality provided by the TerraSAR-X and TanDEM-X data are taken into account by introducing a weighting according to the noise covariance matrix. The proposed approach is evaluated with simulated data. The simulation result shows that the reconstruction accuracy of tomographic SAR inversion can be improved significantly by using jointly fused TerraSAR-X and TanDEM-X data.
1. INTRODUCTION
Tomographic SAR Inversion (Lombardini, 2003; Fornaro et al., 2009; Zhu and Bamler, 2010a), including SAR tomography (TomoSAR) and differential SAR tomography (D-TomoSAR), aims at real and unambiguous 3D, 4D (space-time) or even higher dimensional SAR imaging and is one of the most advanced SAR techniques.
TomoSAR uses typically 20~100 multi-pass SAR interferometric data sets of the same area taken from approximately the same, but slightly different, orbits to establish a synthetic aperture in the elevation direction. It aims at deriving the full scattering density, i.e. the reflectivity profile, in elevation by spectral analysis with special consideration of the difficulties caused by sparse and irregular sampling of the aperture. From this reconstructed profile in elevation multiple scatterers in any azimuth-range pixel are separated, and hence the full 3D (azimuth, range and elevation) reflectivity distribution is obtained. Therefore, TomoSAR is the strictest way of 3D SAR imaging while classical InSAR can be regarded as the limiting case of parametric TomoSAR. D-TomoSAR uses the fact that the different acquisitions are taken at different times and introduces new dimensions to the TomoSAR system model attributing to the possible motion of the scatterers, linear and nonlinear, single component or multi-component. By means of higher dimensional spectral analysis, D-TomoSAR is capable of retrieving elevation and deformation information even of multiple scatterers inside a single SAR pixel. Persistent Scatterer Interferometry (PSI) is a special case of D-TomoSAR where only a single scatterer inside a pixel is assumed.
The new generation of SAR sensors, such as TerraSAR-X and Cosmo-Skymed, have proven to open up new opportunities for tomographic SAR inversion. Among all other advantages, such as high absolute geometric accuracy, precise orbit determination and short revisit time, this new class of SAR sensors deliver SAR data with a very high spatial resolution of up to 1 m compared to the medium (10~30 m)- and high (3~10 m)-resolution SAR systems available so far. For the first time, the 3D shape and complex motion of single buildings can be reconstructed and enables tomographic SAR inversion to
monitor urban infrastructure from space (Zhu and Bamler, 2010; Zhu and Bamler, 2012b).
The estimation accuracy of the 3D position and motion parameters depends on the signal-to-noise ratio (SNR), number of images used (typically 20~100), motion model assumption and the coupling effect between the spatial baseline and temporal base functions (Zhu and Bamler, 2012a; Zhu and Bamler, 2011). The state-of-the-art reconstruction accuracy of tomographic SAR inversion is limited, since:
− The SNR of many pixels is very low, typically 0~10dB;
− Although the underlying motion is complex, the motion model order is limited and assumed to be up to 2, e.g. a geodynamically induced linear motion and a thermal dilation induced seasonal motion, which must be estimated, although it is often regarded as a nuisance parameter.
− The coupling effect between the phases attributed to the underlying topography and motion cannot be neglected using repeat-pass data stack acquired by a single antenna SAR sensor.
Fig.1 presents a 3D view of the scatterers reconstructed by TomoSAR of city blocks in downtown Las Vegas, using a stack of 30 images acquired by TerraSAR-X. This limited accuracy can be obviously observed from the outliers and noisy building surfaces.
Along with the launch of TanDEM-X in 2010, for the first time (after SRTM) there is a real multi-antenna system in space, even though only with a single baseline. It enables us to acquire data pairs simultaneously and repeatedly in time. The TanDEM-X data pairs are free of motion, atmosphere and temporal decorrelation, and hence possess much higher data quality. The fusion of TerraSAR-X and TanDEM-X data, i.e. adding a couple of TanDEM-X acquisition pairs to the TerraSAR-X data stacks, can be used to improve the result of tomographic SAR inversion from the above mentioned three aspects on the one hand, and to explore the limits of tomographic reconstruction on the other hand.
This paper presents the first demonstration of high precision very high resolution tomographic SAR inversion with the assistance of TanDEM-X data. The data quality of TerraSAR-X and TanDEM-X is investigated (Section II). TomoSAR algorithms such as SVD-Wiener, Nonlinear Least Squares and International Archives of the Photogrammetry, Remote Sensing and Spatial Information Sciences, Volume XXXIX-B7, 2012
SL1MMER are extended for mixed repeat- and single-pass data stacks in Section III. A systematic approach is proposed for the fusion of TerraSAR-X and TanDEM-X data in which the different data quality provided by the TerraSAR-X and TanDEM-X data are taken into account by introducing a weighting according to the noise covariance matrix. The proposed approach is evaluated with simulated data in Section IV. The simulation result shows that the reconstruction accuracy of tomographic SAR inversion can be improved significantly by using jointly fused TerraSAR-X and TanDEM-X data.
2. DATA QUALITY ANALYSIS
2.1 TanDEM-X Data
Due to the simultaneous data acquisition of the TanDEM-X image pairs, the TanDEM interferograms possess much higher data quality. For instance, Fig.2 shows the example building, the Fashion Show Mall in Las Vegas. The right image is the mean intensity map from a stack of high resolution TerraSAR-X images. The left image is the corresponding optic image in Google-earth. From the optic image, it is evident that the roofs of the building blocks are flat. Fig.3 compares the TanDEM-X interferogram and TerraSAR-X interferogram generated from two images with a time lag of 33 days. Severe phase variation on the flat surfaces can be only observed in the right image (i.e. repeat-pass TerraSAR-X inteferogram) that indicates the phase distortion caused by temperature change induced motion, atmosphere and temporal decorrelation.
2.2 Noise Model Analysis
In VHR X-band data, the common noise sources of repeat-pass and single pass data are:
- The calibration errors in amplitude: The radiometric stability of TerraSAR-X/TanDEM-X, i.e. the amplitude variations within one stack, is 0.14 dB and is therefore negligible compared to the typical SNR of a SAR system. - Thermal noise: It can be estimated from background
pixels and is typically in the order of -20dB.
Besides, the repeat-pass data have the following additional noise sources:
- Temporal decorrelation: The corresponding noise covariance increases exponentially with the temporal baseline. E.g. Fig.4 compares the coherence histogram estimated by means of non-local means filter (Deledalle et al., 2011) over the whole scene (10km × 5km) of the aforementioned single-pass TanDEM-X interferogram and repeat-pass TerraSAR-X interferogram. It is obvious that the single-pass TanDEM-X interferogram is much coherent than the repeat-pass TerraSAR-X interferogram. - Phase errors caused by atmospheric delay and unmodeled motion: The distribution of such an error is unknown. Among them the phase error caused by atomospheric delay is normally roughly corrected through the Atmospheric Phase Screen (APS) estimates from the PSI processing.
Although the above mentioned noise resources cannot be fully modeled as circular Gaussian noise, yet as the best asymptotical one the Gaussian model is still favoured for conveniences in the estimation (i.e. only the covariance is needed). As a consequence, the different data quality possessed by repeat- and single-pass data can be therefore characterized by different noise variance. A key issue is to approperiately estimate the noise covariance matrix Cεε. This will be addressed in a separate study.
3. TOMOGRAPHIC SAR INVERSION FROM MIXED REPEAT- AND SINGLE-PASS DATA STACKS
3.1 System Model
In presence of noise ε, the discrete-TomoSAR system model can be written as:
g Rγ ε (1)
where g is the measurement vector with N elements, γ is the reflectivity function uniformly sampled in elevation at
l
s (l1,,L). R is an NL (NL) irregularly sampled discrete Fourier transform mapping matrix and the sampling position n is a function of the elevation aperture position bn, i.e. n 2bn
r , where is the wavelength and r is the range distance.In the space-borne case, the multi-pass acquisitions are taken over a time of from several weeks to years (depending on the revisiting time of the satellite and the number of stacked images). Therefore, the long-term motion of the scattering object during the acquisition period must be considered by adding a motion-induced phase term to the system model, also refered to as D-TomoSAR system model. This renders tomographic SAR inversion to higher dimensional spectral estimation problem. Of course, its system model can also be approximated by a discrete version sharing the same expression as eq. (1).
Tomographic SAR inversion aims at resolving the coherent targets γ. According to the scattering mechanism, the coherent targets, i.e. the signal, to be resolved can be categorized as discrete scatterers and volumetric scatterers. The reflected power of discrete scatterers can be characterized by several δ -functions, i.e. the signal can be described by a deterministic model with a few parameters. Volumetric scatterers have a continuous backscatter profile associated with completely random scattering phases, i.e. the signal can only be described by stochastic models. Our target application is urban infrastructure monitoring, i.e. to resolve discrete scatterers with motion.
There are numerous tomographic SAR inversion methods, including the conventional beamforming (BF), singular value decomposition (SVD), adaptive beamforming, multiple signal classification (MUSIC), nonlinear least squares (NLS) and algorithms exploiting the sparsity of the signal such as M-RELAX and the newly developed sparse reconstruction based SL1MMER algorithm. Since spatial resolution is essential for urban applications, to maintain the full range and azimuth resolution, we focus on single-looking methods that are based on the stacked measurements of single azimuth-range pixels and do not explore the correlation between the surrounding pixels. In this section, we will introduce the standard maximum a posteriori (MAP) estimator, NLS and the SL1MMER algorithm with Gaussian white noise and extend those estimators to the colored noise case. The description of the methods is based on single polarization TomoSAR.
3.2 Tomographic SAR Reconstruction with White Noise
3.2.1 MAP Estimator
For Gaussian stationary white measurement noise, i.e. 2
In general, MAP estimator is computationally efficient and is not sensitive to irregular sampling. However, it obeys the Rayleigh resolution limit, i.e. it has almost no super-resolution capability.
3.2.2 Nonlinear Least Squares (NLS)
Assuming the presence of K scatterers inside a pixel with elevations of s
s1 s2, ,sK
, the under-determined system model (1) reduces to the following over-determined problem:
H
1 H
ˆNLS
γ R s R s R s g (3)
For Gaussian white noise, NLS is identical to the maximum likelihood estimator (MLE). It is therefore theoretically the best estimator for our application if and only if the data closely agree with the assumed model. Due to the large computational effort to the multi-dimensional search, the NP-hard NLS is not recommended for practical data processing.
3.2.3 SL1MMER
The "Scale-down by L1 norm Minimization, Model selection, and Estimation Reconstruction" (SL1MMER, pronounced "slimmer") algorithm is a spectral estimator firstly proposed in (Zhu and Bamler, 2010b). It consists of three main steps: 1) a dimensionality scale-down by L1 norm minimization, 2) model selection and 3) linear parameter estimation. In case there is no prior knowledge about the number of scatterers inside the pixel and in the presence of measurement noise, the sparse reconstruction of (1) is give by the following L1- L2 norm minimization:
2
SL1MMER 2 1
ˆ arg minγ K
γ g Rγ γ (4)
The L1-L2 norm minimization step shrinks R dramatically and
gives a first sparse estimate of γ. Due to the fact the following two effects (Zhu, 2011): 1) for our application, RIP and incoherence are violated for several reasons 2) - The L1 norm approximation of the NP-hard L0 norm regularization introduces amplitude bias, This estimate may still contain the outliers. Therefore, a further model order selection and parameter estimation step are followed to refine the sparse estimates obtained from (5).
SL1MMER offers an aesthetic non-parametric realization of the NP-hard NLS estimator. As an efficient estimator, it is demonstrated to provide a super-resolution capability reaches the fundamental bounds of all spectral estimators.
3.3 Tomographic SAR Reconstruction with Colored Noise
Based on the discussion in Section 2.2, i.e. the different data quality possessed by repeat- and single-pass data can be therefore characterized by the noise variance matrix Cεε, the aforementioned estimators are extended to the colored noise case as following:
MAP Estimator
H 1
1 H 1 ˆMAP εε εεγ R C R I R C g (5)
Nonlinear Least Squares (NLS)
3.4 Cramér-Rao Lower Bound of the Elevation Estimates
Under colored noise, the Cramér-Rao Lower Bound (CRLB) of the elevation estimates in presence of only a single scatterer is given by:
where SNRn stands for the signal-to-noise ratio (SNR) of the nth acquisition (n1,,N). b is the re-weighted standard deviation of the baseline distribution:
2
Compared to the CRLB under Gaussian white noise 0 (i.e. all data possesses the sameSNR), the N SNR dependent factor is replaced by n
n SNR
to account for variant data quality and the standard deviation of the baseline distribution b is accordingly replaced by the b depends on the sampling position bn re-weighted according to the data quality SNRn. It tells that, in case of adding several high quality TanDEM-X data to an existing TerraSAR-X stack, the elevation estimation accuracy improvement depends not only on the number of TanDEM-X images, but also the corresponding baseline distribution. I.e. widely spread baselines are preferred.Considering a mixed stack consisting of N1 images with a higher SNR of SNR1 and N2 images with a lower SNR of
2
SNR , let’s assume the standard deviation of the baseline distribution for each sub-stack are b,1and b,2, eq. (8) can be
A reasonable data quality assumption for a mixed repeat- and single-pass data stack is that we have a mixed stack consisting of N1 images with a higher SNR of SNR1 and N2 images with a lower SNR of SNR2.
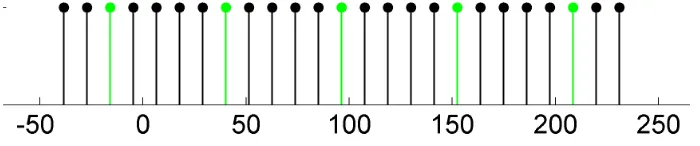
The data is simulated using the regularly distributed elevation aperture shown in Fig.5 (25 images, elevation resolution
40.5
s m
) with the following two cases:
TSX: multi-pass data stack case, i.e. 25 images with SNR=5dB;
TDX: mixed stack, 20 images with SNR of 5dB (elevation aperture positions marked as black) and 5 images with SNR=20dB (marked as green).
Fig.6 shows comparison of the reflectivity profiles along elevation direction reconstructed by MAP (blue) and SL1MMER (red) using the data stack of TSX and TDX cases (right). The true elevations of the two scatterers are 10 and 25 meter, respectively, an i.e. elevation distance is 0.4 times of the Rayleigh resolution limit. It is obvious to see the better sidelobe suppression for the non-parametric estimator and better super-International Archives of the Photogrammetry, Remote Sensing and Spatial Information Sciences, Volume XXXIX-B7, 2012
resolution for the sparse reconstruction based SL1MMER algorithm while using TDX data stack.
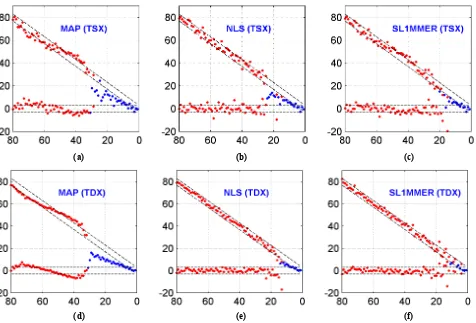
As multiple scatterers inside one resolution cell most likely occur in high rise urban areas, the situation that two scatterers inside one resolution cell (one from the building façade and another from the ground) is simulated as an another example to evaluate the performance of the spectral estimation methods. The building is assumed to have an elevation of 80 m where ground is at zero elevation.
Fig.7 shows the estimated elevation values of the two scatterers with MAP (left), NLS (middle) and SL1MMER in TSX (upper) and TDX (lower) cases. The x-axis refers to the true elevation of scatterers on the building facade. The y-axis shows their estimated elevations. The ideal image would be two straight lines (one horizontal and another one diagonal). The better estimation accuracy shown in the lower plots confirms the fact that reconstruction accuracy of tomographic SAR inversion can be improved significantly by using jointly fused TerraSAR-X and TanDEM-X data.
5. CONCLUSION & OUTLOOK
This paper presents the first demonstration of high precision very high resolution tomographic SAR inversion with the assistance of TanDEM-X data. The data quality of TerraSAR-X and TanDEM-X is investigated. TomoSAR algorithms such as SVD-Wiener, Nonlinear Least Squares and SL1MMER are extended for mixed repeat- and single-pass data stacks. A systematic approach is proposed for the fusion of TerraSAR-X and TanDEM-X data in which the different data quality provided by the TerraSAR-X and TanDEM-X data are taken into account by introducing a weighting according to the noise covariance matrix. The proposed approach is evaluated with simulated data. The simulation result shows that the reconstruction accuracy of tomographic SAR inversion can be improved significantly by using jointly fused TerraSAR-X and TanDEM-X data.
Future work will concentrate on real data demonstration: the system approach for measurement noise matrix estimation of
mixed TerraSAR-X/TanDEM-X data stacks will be investigated; real data processing examples of mixed TerraSAR-X/TanDEM-X data stacks will be presented, the estimation accuracy increment will be quantitatively studied. REFERENCE
Deledalle C., Denis L., & Tupin F., “NL-InSAR: Nonlocal interferogram estimation”, IEEE TGRS 49 (4), pp.1441-1452, 2011.
Fornaro G., Reale D., and Serafino F., “Four-dimensional SAR imaging for height estimation and monitoring of single and double scatterers,” IEEE TGRS 47 (1), pp. 224–237, 2009. Lombardini F., Differential Tomography: A New Framework for SAR Interferometry, in Proc. IGARSS, pp.1206–1208,2003. Zhu X. and Bamler R., “Very high resolution spaceborne SAR tomography in urban environment,” IEEE Trans. Geosci. Remote Sens., vol. 48, no. 12, pp. 4296–4308, Dec. 2010. Zhu X. and Bamler R., “Demonstration of Super-Resolution for Tomographic SAR Imaging in Urban Environment,” IEEE TGRS, in press.
Zhu X. and Bamler R., “Super-resolution power and robustness of compressive sensing for spectral estimation with application to spaceborne tomographic SAR,” IEEE TGRS, vol. 50, no. 1, pp. 247–258, 2012.
Zhu X., Very High Resolution Tomographic SAR Inversion for Urban Infrastructure Monitoring — A Sparse and Nonlinear Tour.,Deutsche Geodätische Kommission, Reihe C, Nr. 666, Verlag der Bayerischen Akademie der Wissenschaften, ISBN 978-3-7696-5078-5, 2011
Zhu X. and Bamler R., “Let’s do the time warp: Multi-component nonlinear motion estimation in differential SAR tomography,” IEEE GRSL, vol. 8, no. 4, pp. 735–739, 2011. Zhu X. and Bamler R., “Tomographic SAR inversion by L1-norm regularization—The compressive sensing approach,” IEEE TGRS vol. 48, no. 10, pp. 3839–3846, 2010.
Figure.1. 3-D view of the scatterers reconstructed by TomoSAR reconstruction of city blocks in downtown Las Vegas, using a stack of 30 images acquired by TerraSAR-X. Height is color-coded.
Figure 3. Comparison of single-pass TanDEM-X interferogram (left) and repeat-pass TerraSAR-X interferogram generated from two images with a time lag of 33 days (right).
Figure 2. Example building: the Fashion Show Mall. Left: optic image in Google-earth; right: Mean intensity map from a stack of high resolution TerraSAR-X images
Figure 4. Coherence histogram comparison of single-pass TanDEM-X interferogram and repeat-pass TerraSAR-X interferogram generated from two images with a time lag of 33 days.
Figure 5. Elevation aperture positions [m]
Figure 6. Comparison of the reflectivity profiles along elevation direction reconstructed by
MAP
(blue) and SL1MMER (red)usingthe data stack of TSX (left) and TDX cases
(right). The true elevations
of the two scatterers are 10 and 25meter, respectively,
an i.e. elevation distance is
0.4 times of the Rayleigh resolution limit.(a) (b) (c)
(d) (e) (f)
Figure 7. Estimated elevations [m] of two scatterers of equal reflectivity of increasing elevation distance. Shown are the results of MAP, (a), (d), NLS estimation (b), (e), and SL1MMER (c), (f). Upper plots: TSX case; lower plots: TDX case. The true
positions are a horizontal line referring to the ground and a diagonal line referring to the scatterer at variable elevation. (Blue: detected single scatterer; red: detected two scatterers)