VEGETATION DISTURBANCE AND RECOVERY FOLLOWING A RARE
WINDTHROW EVENT IN THE GREAT SMOKY MOUNTAINS NATIONAL PARK
S. Bernardes a,b, M. Madden a
a Center for Geospatial Research (CGR), Department of Geography, University of Georgia, Athens, Georgia, 30602, United States -
(sbernard, mmadden)@uga.edu b
Biospheric Sciences Laboratory, Goddard Space Flight Center, NASA, Greenbelt, Maryland, United States
Commission VIII, WG VIII/7
KEY WORDS: tornado, Landsat, Enhanced Vegetation Index, EVI, time-series, Southeastern United States
ABSTRACT:
The tornado outbreak of April 2011 in the Southeastern United States caused major damage to property and natural ecosystems. During the outbreak, the Great Smoky Mountains National Park (GRSM) was hit by an EF4 tornado, resulting in a long strip of broken branches and toppled old-growth forest trees. Little is known of the consequences of extreme windthrow events, partly due to limitations in characterizing and monitoring wind-driven vegetation disturbance and recovery over large areas and over time. This work analyzed vegetation damage in the GRSM resulting from the 2011 tornado outbreak and monitored vegetation recovery in the region over a four-year period. Anomalies of the Enhanced Vegetation Index (EVI) calculated using Landsat scenes showed that the 2011 tornado affected 21.38 km2 of forest, including submesic to mesic oak/hardwoods, Southern Appalachian cove hardwood forests and montane alluvial forests. Tornado damage severity was mapped and investigated by using anomalies of EVI over space and time and showed track discontinuity and significant variation in damage intensity along the tornado track, suggesting vortex-topography interactions. Temporal profiles and spatial representations of EVI anomalies for the period 2011-2015 indicated that EVI in 2015 was above pre-event values, indicating homogeneous canopy and lack of vertical structure during regrowth.
1. INTRODUCTION
In April 2011, a strong low pressure system moved through the Central Plains of the United States, spawning record-breaking 343 tornadoes over four days in the Southeastern part of the country. The tornado outbreak took multiple lives and caused major damage to property and natural ecosystems. In one event, on April 27, an EF4 tornado left a strip of damaged vegetation on the west side of the Great Smoky Mountains National Park (GRSM). Winds associated with the GRSM tornado topped 200 miles per hour breaking branches and toppling thousands of old-growth forest trees, dramatically transforming the landscape. Disturbances of such magnitude often profoundly affect the abiotic and biotic components of ecosystems, contributing to significant changes in energy balance/flow and in the availability of resources to biota (e.g., light/shade and water). In particular, extreme windthrow events may partially or completely eliminate vegetation cover, resulting in new environmental conditions that contribute to changes in species dominance and to the establishment of invasive species, potentially modifying the structure and composition of vegetation communities. In some instances, ecosystem services may also be heavily impacted.
Advancing our understanding of vegetation disturbance due to tornadoes in the Southeastern United States is critical to the understanding of changes in energy and mass flow within important ecosystems occurring in the region and is particularly relevant in light of future changes in climate and the expected increase in frequency of severe weather events (Trapp et al., 2007; Min et al., 2011). Little is known of the ecological consequences of extreme windthrow events, partly due to challenges in characterizing and monitoring wind-driven vegetation disturbance and recovery over large areas and over
time. Tornado damage assessment based on orbital remote sensing has been proposed in the literature, mainly associated with the analysis of color composites, spectral indices, or the computation of change in vegetation index values (Wagner et al., 2012, Yuan et al., 2002). These approaches have been shown to represent disturbance extent, damage severity and vegetation recovery. This investigation uses remote sensing tools and techniques to characterize and evaluate the extent and degree of tornado-derived vegetation disturbance in the GRSM and vicinity by employing a spatiotemporal analysis of indices of vegetation greenness and photosynthetic potential.
2. STUDY AREA
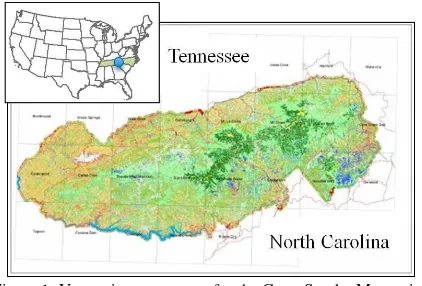
The spatial domain of this investigation is the interior and vicinity of the Great Smoky Mountains National Park (GRSM) in the Southeastern United States (Figure 1). The park straddles the Appalachian Mountains between the states of Tennessee and North Carolina and covers an area of over 2110 square kilometers. Physiographically, the area links the south and the north regions of eastern United States. Elevation variations in the GRSM are analogous to latitudinal changes in the country, resulting in high diversity in flora and fauna. Elevation (ranging from 240 meters to over 2000 meters) and slope play critical roles in the distribution of habitats and vegetation in the region, which includes large areas of old growth forests. Cove hardwood forests can be found over valleys and lower mountain slopes, while northern hardwood forests occur at higher mountain slopes. Higher elevations are home to spruce-fir associations and boreal forest. The park plays a significant role in tourism and environmental education in the United States and is one of the most visited parks in the country, receiving an estimated ten million visitors per year. Extreme windthrow events are rare in the park and can affect not only fauna and
flora, but also impact park usability and management, including maintenance of trails and fuel availability/fire control.
Figure 1: Vegetation cover map for the Great Smoky Mountains National Park. Inset map shows the location of the park (blue
circle) between the states of Tennessee and North Carolina (shaded).
3. DATA
Georectified Landsat images (path: 19; row: 35) for the period 2010-2015 were downloaded from the United States Geological Survey (USGS) using EarthExplorer (earthexplorer.usgf.gov). Criteria used for image selection included temporal proximity to the tornado event and full foliation of deciduous species, thus minimizing differences in phenological stages between scenes. In addition, image selection aimed to reduce the influence of seasonal variations in illumination conditions and cloud cover. Six images were selected for the months of May and June for each year following the tornado, from 2011 to 2015 (Table 1). Conditions prior to the tornado were represented by Landsat images acquired on May 27, 2010. An image acquired on August 31, 2010 was an exception to the rules above and was used for visual confirmation of vegetation removal occurring in 2010. In addition to Landsat scenes, very high resolution panchromatic and multispectral images acquired by WorldView-1 and WorldView-2 before and after the tornado event were used to investigate the extent of the affected area and to support the analysis of damage severity.
Scene ID Date of Table 1. Landsat images used in this study
The selection of the image associated with baseline conditions used also an analysis of departures from normal water availability based on climate data spanning the period 1980-2014. For that, we used DAYMET data (Thorton et al., 2014, https://daymet.ornl.gov), which included daily climatological surfaces for precipitation, temperature and downwelling radiation. A map of the vegetation cover of the Great Smoky Mountains National Park produced by the Center for Geospatial Research (Madden et al., 2012) was used to identify the main vegetation types affected by the tornado.
4. METHODS
We assume that strong winds modified the spectral properties of tornado-affected pixels by changing the composition, quantity and spatial arrangement of pixel components, including leaves, needles, tree branches, crowns, stems and understory vegetation. Vegetation indices have been widely used to identify and represent changes in vegetation cover over forested areas and were used for damage extent and severity assessment. Differences between pre-event and post-event vegetation index values were used to characterize areas damaged by strong winds. An increase in post-event vegetation index values was considered an indicative of vegetation recovery.
Image pre-processing included the conversion of Landsat scenes listed by Table 1 to radiance values using sensor-specific metadata provided by USGS. The output radiance images were then atmospherically corrected using the Fast Line-of-Sight Atmospheric Analysis of Hypercubes (FLAASH) a first-principles atmospheric correction tool (Felde et al. 2003). Image pre-processing resulted in one complete set of surface reflectance bands for each year considered by this study (2010-2015).
Reflectance images were then used as input to a vegetation cover change detection and damage severity assessment based on vegetation index anomalies. An image representing the spatial distribution of the Enhanced Vegetation Index (EVI, Huete et al., 1999) was computed for each year analyzed. EVI has increased sensitivity to high biomass content, and is less affected by the contributions of background soil and residual effects of the atmosphere. The index is based on the blue, red and near infrared spectral bands and is defined as:
1
where EVI = Enhanced Vegetation Index NIR = near infrared spectral band RED = red spectral band BLUE = blue spectral band
Vegetation index anomalies were calculated by subtracting EVI values for a reference (“normal”) year from EVI values for years following the tornado. The selection of the reference year for anomaly computation considered the possibility that changes in water availability for the area of study affected spectral responses of vegetation and resulted in lower EVI values for that year. Thus, reference year selection included an investigation of potential departures from normal water balance conditions occurring in the region in 2010. Water balance analysis used DAYMET data (precipitation, temperature and downwelling radiation) to compile monthly averages and then to compute time series of the standardized precipitation evapotranspiration index (SPEI, Vicente-Serrano et al., 2010). SPEI was calculated for the area of study considering multiple time scales (1 month, 3 months, and 6 months). The analysis of SPEI showed no significant reduction in water availability for the region in 2010. As a result, 2010 was selected as reference year for vegetation index anomaly computations.
5. RESULTS AND DISCUSSION
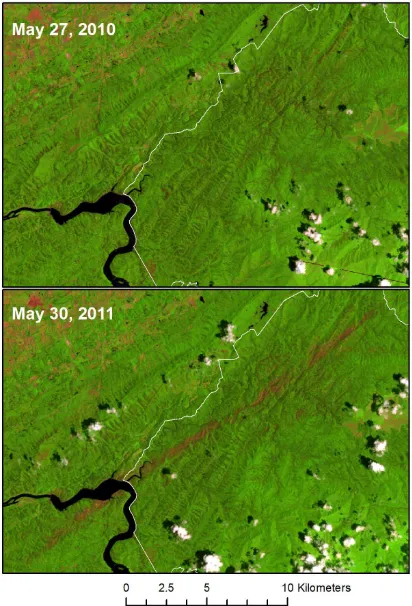
Figure 2 shows Landsat color composites of the area of study for May 2010 (top) and May 2011 (bottom). The same figure
depicts the boundary of the western portion of the Great Smoky Mountains National Park as a white line and shows that most of the area affected by the tornado occurred inside the park. Tornado damage can be seen on the 2011 image, starting southwest of Chilhowee Lake and extending northeast for approximately 28.7 km. In total, the length of wind-related damage was 37.4 km, including two non-reported tornado tracks occurring to the east of the main windthrow area. Non-reported tracks were significantly shorter than the main track and measured 4.1 km (less organized track parallel to the main track and located at approximately 2 km from it) and 4.6 km (track oblique to the main track). The width of the area affected by the tornado varied spatially, although a relatively well organized main track reaching over 1 km could be identified. Substantial variation in the tornado track suggests changes in vortex dimensions and/or the proximity of the vortex to the ground. The total area affected by extreme winds amounted to 21.38 km2, with 16.05 km2 being inside the park.
Figure 2: Landsat 5 TM color composites showing the area affected by the April 27, 2011 tornado in the Great Smoky Mountains National Park: image acquired on May 27, 2010 showing no extreme wind damage (top) and image acquired on
May 30, 2011 showing a southwest-northeast tornado track (bottom). Western park boundary is shown as a white line.
The spatial distribution of disturbance intensity due to extreme winds was investigated by using anomalies of the Enhanced Vegetation Index (ΔEVI = EVI2011-EVI2010) (Figure 3). Negative anomalies indicate the removal of green vegetation by the 2011 tornado and anomaly magnitude (i.e., the departure from zero EVI value) was used to indicate disturbance severity. EVI anomalies for the areas affected by the tornado ranged from -0.035 to -0.28 (from lowest to highest degree of damage) and tornado damage severity varied considerably along the tracks.
Lower severity (Figure 3, blue color) can be observed for areas at the beginning and at the end of tracks, possibly associated with reduced wind speeds during the formation and weakening of the tornado vortex. Lower anomaly values can also be seen along the track, surrounding areas of increased severity. The lower end of the severity scale represents removal of green vegetation, but not necessarily tree toppling. In some cases, reduced severity was observed to derive from the 30 m resolution of Landsat images, when a mixture of high severity area and the surrounding forest was represented within the same Landsat pixel. Highest damage (red color) occurred just before the tornado crossed the Chilhowee Lake (Figure 3, A) and at multiple points along the track, as depicted by Figure 3, B and C. Vortex-topography interactions seemed to have played a significant role in defining the degree of wind-related damage during the event, as indicated by EVI anomalies and the very high resolution images.
Figure 3: Damage severity over the areas affected by the April 27, 2011 tornado in the Great Smoky Mountains National Park,
represented by anomalies of the Enhanced Vegetation Index (ΔEVI). Lower anomaly values (red color) indicate higher
damage.
The damage severity layer and the vegetation map for GRSM were used to identify vegetation communities most affected by the 2011 tornado. Low and mid elevation forests were the most damaged by the strong winds and included multiple associations of submesic to mesic oak/hardwoods, Southern Appalachian cove hardwood forests (including those with hemlock) and montane alluvial forests. The distribution of disturbance intensity values in relation to affected area (km2) is presented in Figure 4 (n = 256 bins). Vertical blue lines partition the total area affected by extreme winds into four equal-area groups. Most of the affected area is represented by low anomaly values and low damage (total area for ΔEVI above -0.1 amounted to 15.01 km2). In the other end of the damage spectrum, approximately 0.38 km2 presented ΔEVI below -0.2.
Figure 4: Areal distribution of anomalies of the Enhanced Vegetation Index for the May 27, 2011 tornado in the Great Smoky Mountains National Park. Blue vertical lines divide the
affected area into four equal-area groups.
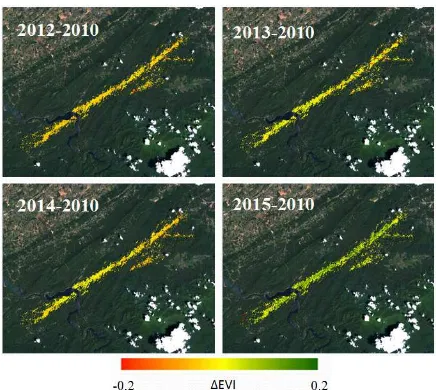
Figure 5 shows temporal changes of EVI anomalies for four years following the tornado, from 2012 to 2015. In general, we observed a transition from negative anomaly values to positive anomalies, indicative of increase in vegetation cover in the areas affected by the tornado. Although instances of positive anomalies can be observed for 2013 and 2014, significant positive anomalies were observed particularly for 2015. Positive anomalies (i.e., EVI values following disturbance are higher than those values shown by the forest before the tornado) can be observed during initial stages of vegetation recovery/regrowth and often result from more homogeneous canopies and lack of vertical stratification, when compared to old growth forests.
Figure 5: Anomalies of the Enhanced Vegetation Index for multiple years following the April 27, 2011 tornado.
An example of changes in EVI during the recovery process can be seen for a selected area shown by Figure 6. The image on the left represents severity damage for area B from Figure 3. Points representative of high severity damage (red color) were averaged and used to generate a temporal profile of EVI. In 2010, EVI for the samples approached 0.457. A significant reduction in the index can be seen for 2011, corresponding to vegetation removal by the tornado. Following 2011, EVI showed increase for every year analyzed (averaged increase = 0.077/year) and maximum values for the index were observed for 2015 (0.524). It is noteworthy that EVI for 2011 was just above 0.2, indicating the occurrence of vegetation in the area.
Figure 6: Temporal profile of average Enhanced Vegetation Index for high severity areas (red color) indicating increase of vegetation index over time during recovery (diagonal texture =
pre-tornado; solid bar = post-tornado).
6. CONCLUSIONS
The April 27, 2011 tornado drastically altered the landscape in the western side of the Great Smoky Mountains National Park (GRSM), in the United States. Areas affected by such extreme windthrow events offer key opportunities to further our understanding of vegetation disturbance and recovery, as well as to develop and test methodologies for wind-related damage assessment. This work provided an assessment of tornado-related damage and vegetation recovery in the GRSM and included the spatial distribution of damage, a disturbance severity analysis, the identification of the communities affected by the tornado, as well as a temporal analysis of vegetation cover following the extreme event.
Damage to vegetation caused by strong winds varied along the tornado track, ranging from small reductions in the availability of green material to total removal of trees. The Enhanced Vegetation Index (EVI) was sensitive to this variability and showed areas of significant damage due to extreme winds. In addition, temporal analysis of EVI demonstrated changes in the affected area associated with the recovery process. EVI values in 2015 were higher than pre-event values for most of the area, which is indicative of ongoing regrowth. Finally, this study establishes a baseline for a remote-sensing based analysis of the recovery process associated with an extreme windthrow event in the GRSM. Future investigations will build upon these results and will continue monitoring changes in vegetation descriptors in the region.
ACKNOWLEDGEMENTS
DigitalGlobe data were provided by NASA's NGA Commercial Archive Data (cad4nasa.gsfc.nasa.gov) under the National Geospatial-Intelligence Agency's NextView license agreement.
REFERENCES
Felde, G.W., Anderson, G.P., Adler-Golden, S.M., Matthew, M. W. and Berk, A., 2003. Analysis of Hyperion data with the FLAASH atmospheric correction algorithm. Algorithms and Technologies for Multispectral, Hyperspectral, and Ultraspectral Imagery In: IX. SPIE Aerosense Conference, Orlando. USA, Vol. I, pp 90-92.
Huete, A.R., Justice, C.O., and van Leeuwen, W., 1999. MODIS vegetation index (MOD 13) algorithm theoretical basis document, version 3: USGS Land Process Distributed Active Archive Center. USA.
Madden, M., Welch, R., Jordan, T., Jackson, P., Seavey, R. and Seavey, J., 2004. Digital Vegetation maps for the Great Smoky Mountains National Park, Final Report to the U.S. Dept. of
Interior, National Park Service, Cooperative Agreement Number 1443-CA-5460-98-019, Center for Remote Sensing and Mapping Science, The University of Georgia, Athens, Georgia, USA. 112 p.
Thornton, P.E., Thornton, M.M., Mayer, B.W., Wilhelmi, N., Wei, Y., Devarakonda, R. and Cook. R.B., 2014. Daymet: Daily surface weather data on a 1-km grid for North America, Version 2. ORNL DAAC, Oak Ridge, Tennessee, USA.
Trapp, R.J., Diffenbaugh, N.S., Brooks, H.E., Baldwin, M.E., Robinson, E.D., and Pal, J.S., 2007. Changes in severe thunderstorm environment frequency during the 21st century caused by anthropogenically enhanced global radiative forcing. Proceedings of the National Academy of Sciences, 104(50), pp. 19719-19723.
Wagner, M.A., Myint, S.W. and Cerveny, R.S., 2012. Geospatial assessment of recovery rates following a tornado disaster. IEEE Transactions on Geoscience and Remote Sensing, 50(11), pp. 4313-4322.
Yuan, M., Dickens-Micozzi, M., and Magsig, M.A., 2002. Analysis of tornado damage tracks from the 3 May tornado outbreak using multispectral satellite imagery. Weather and Forecasting, 17(3), pp. 382-398.