Full Terms & Conditions of access and use can be found at
http://www.tandfonline.com/action/journalInformation?journalCode=cbie20
Download by: [Universitas Maritim Raja Ali Haji] Date: 18 January 2016, At: 19:31
Bulletin of Indonesian Economic Studies
ISSN: 0007-4918 (Print) 1472-7234 (Online) Journal homepage: http://www.tandfonline.com/loi/cbie20
Indonesia's stock market: evolving role, growing
efficiency
James J. Kung , Andrew P. Carverhill & Ross H. McLeod
To cite this article: James J. Kung , Andrew P. Carverhill & Ross H. McLeod (2010) Indonesia's stock market: evolving role, growing efficiency, Bulletin of Indonesian Economic Studies, 46:3, 329-346, DOI: 10.1080/00074918.2010.522503
To link to this article: http://dx.doi.org/10.1080/00074918.2010.522503
Published online: 24 Nov 2010.
Submit your article to this journal
Article views: 322
Bulletin of Indonesian Economic Studies, Vol. 46, No. 3, 2010: 329–46
ISSN 0007-4918 print/ISSN 1472-7234 online/10/030329-18 © 2010 Indonesia Project ANU DOI: 10.1080/00074918.2010.522503
INDONESIA’S STOCK MARKET:
EVOLVING ROLE, GROWING EFFICIENCY
James J. Kung Andrew P. Carverhill
Ming Chuan University, Taipei University of Hong Kong
Ross H. McLeod
Australian National University
!"## two decades of inactivity, the stock exchange made little contribution to Indonesia’s development until a series of reform and deregulation measures were implemented from December 1987. This study examines the evolving role of the stock market in $% stock market activity grew markedly in importance relative to banking after the reforms began to take effect, gaining the ascendancy in 2004 and moving well ahead &'"$( two simple technical trading rules, we demonstrate that the stock exchange $
INTRODUCTION
Financial systems provide various means of channelling savings to investments, of which perhaps the two most obvious are banks and stock markets. The princi-"&) $!" we could say that banks mainly collect short-term deposits and use them to make !* "&* "$&"$!$-+;$<$=>?@BE1 Both the providers and the users
of funds choose between these and other intermediation channels on the basis of considerations such as pricing, risk and convenience.2 The ability of each
chan-nel to compete with the others depends on both the nature and the condition of the economy and the regulatory environment. Compared with banking, equity $ Q $
" > % Bank (2006).
2 Other channels include trade credit, supplier credit and direct (non-intermediated) loans &
numbers of large funding institutions (such as life insurers and pension funds) able to mobilise savings from the general public.
From very early in its existence the Soeharto government came to see the lack $ economy too dependent on the banking sector. From 1968, ‘efforts were initiated to develop ... capital markets’ (Cole and Slade 1996: 148), although it was not until 1977 that the Jakarta Stock Exchange (JSX) was re-opened, following the issue of a supporting presidential decree (No. 52/1976) in December 1976.3 At
least some foreign advisers argued that it was premature to re-open the stock exchange at this time (Dickie 1981, cited in Cole and Slade 1996: 153–4). There * $ * * $!!*& contributions from the Indonesian public. Moreover, per capita incomes and sav-ings were still very low, so there was little private sector demand for the services provided by savings mobilising institutions such as life insurance companies and pension funds. Thus the re-activation of the JSX in 1977 was not a market-driven process, and as a result very little was achieved. Only 24 stocks were listed on the JSX between 1977 and 1984, and none at all in the next four years.
$ ["$ be relied upon to ensure that the demand is met (assuming a benign regulatory $E Q " $ "$ -vices. By contrast, virtually all of the activity generated on this newly revived [ * \ * " so mainly in response to government pressure and certain tax advantages. The demand for equities came mainly from government-owned institutions rather than from the general public. The stock exchange itself was government-owned and was operated by the Capital Market Supervisory Agency (Bapepam) under the bureaucratic mindset of the Ministry of Finance. It is hardly surprising that $ long-term business investment. At that time, the mainly state-owned banks were $!"*$" of their funds from abundant government oil revenue and foreign aid rather than from self-interested depositors.
By the mid-1980s the desirability of having an active stock market was becom-ing more apparent. World oil prices had fallen sharply from their peak in the early 1980s, greatly reducing the government’s revenue and constraining the extent *!* the business community. The government deregulated the interest rates of state banks to encourage them to mobilise deposits from the general public, while vari-ous regulatory constraints on the expansion of privately owned domestic and for-eign banks were greatly relaxed, and in some cases removed (McLeod 1999). On the one hand, all of this led to a quite rapid expansion of the banking sector rela-$>$
3 This ended two decades of inactivity, beginning in the 1950s under former President Soekarno (http://www.idx.co.id/). For an account of the Jakarta Stock Exchange in the early 1980s, see McLeod (1984).
^$$* __
to become more expensive than previously, creating an opportunity for the stock market to play a bigger role.
However, this could not happen under the existing set of regulations, and "! [ Accordingly, over the next several years the government embarked on a process of deregulation and privatisation of the capital market. This began in December 1987 with the introduction of an important policy package that came to be known as Pakdes I (December Package I). This and many of the other policy reforms introduced between 1987 and 2007 are listed in appendix 1.4 They are too
numer->*""$ had the greatest impact.
First, recognising the lack of domestic demand on the savings side for a stock market (that is, demand for equities), the government overturned in Pakdes I a previous outright prohibition on share purchases in listed companies by foreign $*"**""`z " `z*"! company shares was eventually lifted in 1997, and the prohibition on foreign ownership of bank shares in 1998.
{ " $ * " $ stock market development, the government gave the private sector and market mechanisms a much greater role relative to the public sector and bureaucratic ) "$`z was removed. A ‘Parallel Bourse’ or ‘over-the-counter market’ was established, owned by private sector brokers and dealers, and with greatly relaxed listing &+$ raise long-term funding). A private stock exchange was also set up in Surabaya. More important was the decision to narrow Bapepam’s role from one of both operator and regulator of the capital market to one of regulator alone. Ownership of the JSX was transferred to a large group of securities companies (clearly with a $["$E[-missioners and directors were appointed in December 1991.
Private sector ownership led to a continuing range of initiatives intended to improve the functioning of the stock exchange. These included the introduction > "$ >5 the establishment of a Clearing and Guarantee
Cor-"}{~">" settlement system, with the settlement date soon shortened from 4 to 3 business days after each transaction.
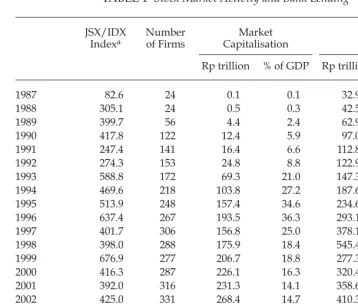
In the wake of these early reforms the stock market came to life. The Jakarta Composite Index (the benchmark indicator of stock prices) shot up from around 80 in 1987 to 305 in late 1988 and to 637 by 31 December 1996. A large number of new issues led market capitalisation to rise by a vastly greater proportion, from
4 For detailed discussions of stock market developments in the late 1980s and early 1990s, see Noerhadi (1994) and Cole and Slade (1996).
""$ > example, Amihud and Mendelson (1988) and Naidu and Rozeff (1994).
around Rp 0.1 trillion in 1987 to Rp 0.5 trillion at the end of 1988 and to Rp 194 trillion by end-1996 (table 1).
%* [" " )
THE CHANGING RELATIVE IMPORTANCE OF BANKS AND THE STOCK MARKET
)#= +1). In 1987, for example, total bank loans outstanding were "__+&$@z?~E "* "+z?~E>#*"_#=+Bz?~E *"#+@z?~E$* bank loans following massive write-downs in 1999, bank loans outstanding still [ "
The 1990s crisis brought home painfully to Indonesia the need to diversify its " "-panies went bankrupt, the banking sector tottered and the economy contracted. A 2006 World Bank report correctly observed that ‘banks were at the heart of Indonesia’s economic crisis in 1997/98 …’ (World Bank 2006).6 In a famous 1999
speech, the then US Federal Reserve Chairman, Alan Greenspan, pointed out ""$*!$+?" 1999):
[How] severe [would] East Asia’s problems … have been during the past eight-ow] severe [would] East Asia’s problems … have been during the past eight-] severe [would] East Asia’s problems … have been during the past eight- severe [would] East Asia’s problems … have been during the past eight-[would] East Asia’s problems … have been during the past eight-would] East Asia’s problems … have been during the past eight-] East Asia’s problems … have been during the past eight- East Asia’s problems … have been during the past eight-… have been during the past eight-have been during the past eight-een months had those economies not relied so heavily on banks as their means of " [ ![?] … Had a functioning capital market existed, the out- … Had a functioning capital market existed, the out-… Had a functioning capital market existed, the out-Had a functioning capital market existed, the out-come might well have been far more benign. … Before the crisis broke, there was little reason to question the three decades of phenomenally solid East Asian eco-* " expanding economies and bank credit kept the ratio of non-performing loans to total bank assets low. The failure to have backup forms of intermediation was of & " … East Asia had no spare tyres.
$$*!$Q ! growth, Indonesian policy makers implemented further reform and deregulation ) included improving its liquidity and collaborating with other ASEAN countries >7 developing derivative markets
B >+@`E
7 See, for example, De Brouwer (1999) and Wang (2004). In principle, integration can en-hance market liquidity and exert competitive pressure on individual markets, thus reduc-ing transaction costs and increasreduc-ing the incentives for innovation.
^$$* ___
>8 and revising rules on corporate governance,
$" of capital market laws (appendix 1).
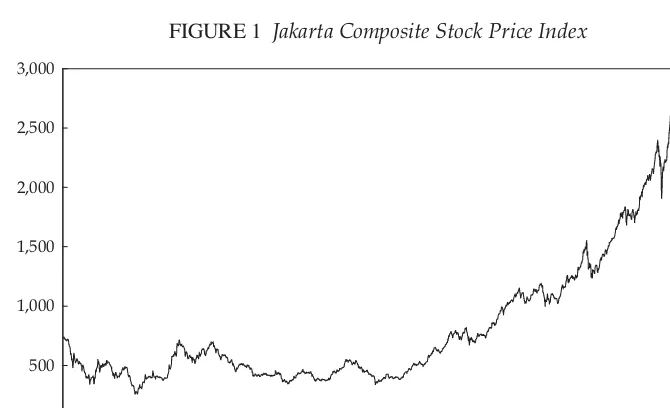
Although the Jakarta Composite Index had recovered most of its crisis losses by mid-1999, this recovery could not be sustained. By September 2000 the index had $$=+E* 2003 that a sustained and rapid upward trend emerged – a trend that would last " @# As a consequence of the boom, market capitalisation increased from less than Rp 200 trillion at end-1998 to nearly Rp 2,000 trillion at end-2007 (table 1). Annual trading value rose from less than Rp 100 trillion to Rp 1,050 trillion during the
8 Derivative and spot markets are closely linked. Because derivative markets are very ef-fective at re-allocating risk, more investors are willing to invest in the underlying assets (such as stocks) and, as a result, more companies are able to raise needed capital.
TABLE 1 Stock Market Activity and Bank Lending
JSX/IDX
Indexa Number of Firms CapitalisationMarket LoansBank
Rp trillion z?~ Rp trillion z?~
1987 82.6 24 0.1 0.1 32.9 28.7
1988 305.1 24 0.5 0.3 42.5 28.4
1989 399.7 56 4.4 2.4 62.9 35.0
1990 417.8 122 12.4 5.9 97.0 46.0
1991 247.4 141 16.4 6.6 112.8 45.1
1992 274.3 153 24.8 8.8 122.9 43.5
1993 588.8 172 69.3 21.0 147.3 44.7
1994 469.6 218 103.8 27.2 187.6 49.1
1995 513.9 248 157.4 34.6 234.6 51.6
1996 637.4 267 193.5 36.3 293.1 55.0
1997 401.7 306 156.8 25.0 378.1 60.2
1998 398.0 288 175.9 18.4 545.4 57.1
1999 676.9 277 206.7 18.8 277.3 25.2
2000 416.3 287 226.1 16.3 320.4 23.1
2001 392.0 316 231.3 14.1 358.6 21.8
2002 425.0 331 268.4 14.7 410.3 22.5
2003 691.9 333 460.4 22.9 477.2 23.7
2004 1,000.2 331 679.9 29.6 595.1 25.9
2005 1,162.6 336 801.3 28.9 730.2 26.3
2006 1,805.5 344 1,249.1 37.4 832.9 24.9
2007 2,745.8 383 1,988.3 50.2 1,045.7 26.4
a The Jakarta and Surabaya Stock Exchanges (JSX and SSX, respectively) were merged to form the
Indonesia Stock Exchange (IDX) in 2007.
Sources: ~>"""";>
same period (not shown in table 1), and the number of listed companies increased from 288 to 383. With stock prices increasing rapidly from 2003, Indonesia’s stock market capitalisation rose to surpass its total bank loans outstanding during 2004. @# ""==+z?~E [ "`B+@Bz?~E+E
" " $ and removing regulatory impediments allowed the stock market’s contribution to Indonesia’s economic progress to increase dramatically relative to that of the banking sector. In addition, changes in the nature of the Indonesian and global "^ *$>"*""> * target for large-scale foreign portfolio investment. It is not feasible to assess the $ " * * ""* for allocating savings to investments.
EFFICIENCY OF THE STOCK MARKET
"$ -mal returns (other than by chance) using any publicly known investment strat-egies. There are innumerable technical strategies (or rules) available for stock trading purposes. In the analysis that follows, two simple but popular technical trading rules – moving average and trading range breakout – are employed to " market. Many researchers (for example, Brock, Lakonishok and LeBaron 1992> Hudson, Dempsey and Keasey 1996> and Bessembinder and Chan 1998) have [
FIGURE 1 Jakarta Composite Stock Price Index
Source: Datastream database.
Jul-1997 Nov-1998 Apr-2000 Aug-2001 Jan-2003 May-2004 Oct-2005 Feb-20070 Jul-2008 500
1,000 1,500 2,000 2,500 3,000
^$$* __
"" *" for investors to make abnormally high returns using such rules.
Data
' [ " }" [ == last trading day in 2007, but excluding the period 1997–98. The data for 1997–98 and for 2008 and beyond are excluded in order to remove the effect of the Asian >$ of 4,693 observations. Thus the entire sample period is divided into two equal !" ) +==BE nine years after it (1999–2007). Analysing these sub-periods separately enables us [*"$ market over time.
'+E than on that of the primary market (where the stock market serves as a channel for allocating savings to investments). The underlying presumption is that if the & * "" " because it enables savers to hold easily liquidated assets on a short-term basis, *"$*!
Methodology
In the following sections, a brief description of the moving average and trading range breakout rules is given, and one-tailed hypothesis tests are set up to assess "
Moving average rules
The n-day moving average (MA) of the Jakarta Composite Index is given by
M
A buy signal indicates an expectation, based on the relevant trading rule, that the value of a stock will rise in the future, and a sell signal the reverse. Accord-ing to the MA rules, buy and sell signals are generated by comparAccord-ing a ‘short’ (small n) MA and a ‘long’ (large n) MA. Buy (sell) signals are generated when the )$+*E)"!""+ ‘band’). A band is used to reduce the number of times the investor would have to alternate between taking a long position in (buying) the index and taking a short position in (selling) the index.9 When a buy signal is generated, the investor takes
a long position in the index and stays in the market until the short MA falls below the long MA. When a sell signal is generated, the investor takes a short position in the index and maintains this position until the short MA rises above the long
9 For example, Brock, Lakonishok and LeBaron (1992), Bessembinder and Chan (1998) and {+@@Ez
MA.10 A popular MA rule is 1–100, where the short MA is 1 day and the long MA
is 100 days. This study uses the following MA rules: 1–50, 5–50, 1–100 and 5–100. $*zz ) for each of the two sub-periods.
Trading range breakout rules
According to the trading range breakout (TRB) rule, a buy signal is emitted when the current price rises above the local maximum (that is, the maximum price $ " " E * current price falls below the local minimum (that is, the minimum price over the ""E)m-day local maximum on day t
(Lmax[m,t]) and an m-day local minimum (Lmin[m,t]) on day t
"-tion in the index the next day and holds the posi"-tion for 5 days, after which it is liquidated.11 Similarly, when a sell signal is emitted, the investor takes a short
position in the index the next day and liquidates the position after 5 days. In either case, when the 5-day holding period is over the investor again waits for a buy or a sell signal. This study uses local maxima and minima over the preceding 20, 50 )$*zz total of six TRB rules for each of the two sub-periods.
One-tailed hypothesis tests
! " market.12 For either buys or sells, the null hypothesis H
0 is that the mean j-day
return is equal to the unconditional mean j-day return (that is, the mean return from holding stock for j days, without reference to any trading rule), and the alter-native hypothesis H1 is that the former is greater than the latter, where j = 1 or 5.
The test statistics for buys and sells, respectively, are as follows:
Z j r j j
10 In practice, there is no such thing as literally investing in a market index. However, an index fund can be used as a proxy for the market index. An index fund is a mutual fund that holds shares in proportion to their representation in a market index.
11 In addition to a holding period of 5 days, we also used holding periods of 10 and 20 days. The results are not reported here, but are similar to those for 5 days.
12 A two-tailed test is not used because it is not relevant, for either buys or sells, to test an alternative hypothesis stating that the mean j-day return is less than the unconditional mean j-day return.
^$$* __#
Given the large sample size, the above two test statistics are distributed as N(0,1) if their null hypotheses are true. Accordingly, given a critical normal value z( ), if the test statistic in equation (4) is greater than z( ), we reject the null hypothesis and conclude that the mean j-day return for buys is greater than the unconditional mean j-day return at the $ { equation (5) is greater than z( ), we reject the null hypothesis and conclude that the mean j-day return for sells is greater than the unconditional mean j-day return
at the $*!$
is set at 0.05 and 0.01. From the standard normal table, z(0.05) = 1.64 and z(0.01) = 2.33.
Summary statistics
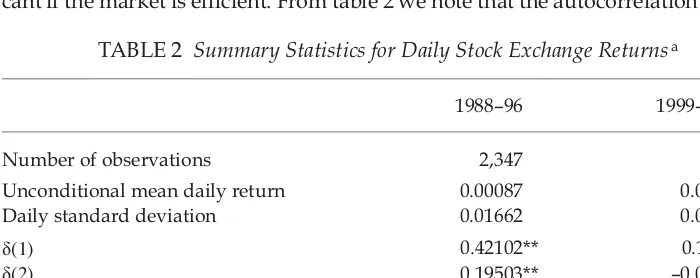
Table 2 presents summary statistics for daily returns on the index for the two sub-periods 1988–96 and 1999–2007. Let Pt and Pt+1 be the closing prices of the index on day t and day t+1, and let Rt+1 be the return from day t to day t+1. We calculate the return as the log difference of the index level> that is,
Rt+1=log(Pt+1) log( )− Pt (6)
"$ because new information comes to the market in a random and unpredictable man-ner, and security prices respond instantly and accurately to this new information. Hence, the magnitude of the autocorrelation in security returns can offer some clue @*
TABLE 2 Summary Statistics for Daily Stock Exchange Returnsa
1988–96 1999–2007
Number of observations 2,347 2,346
Unconditional mean daily return 0.00087 0.00082
Daily standard deviation 0.01662 0.01449
į(1) 0.42102** 0.11721**
returns is quite large for the 1988–96 sub-period at lags 1 and 2, and moderately large for the 1999–2007 sub-period at lag 1. In particular, the daily autocorrelation ==Bz$@`* @#z$ words, for the earlier sub-period, the return on day t is likely to depend on returns on days t–1, t–2, t–4 and t>*!"
t is likely to depend only on the return on day t–1. Hence, the autocorrelations in table 2 provide a rough indication that Indonesia’s stock market displayed rela-$
We use the unconditional mean returns from a buy-and-hold (BH) strategy as a benchmark to assess the mean returns for the two technical rules. If the market is j-day returns from either buy or sell signals for each rule should not greatly exceed their corresponding unconditional mean j-day returns from a BH strategy. Tables 3a–4b present the results for the two technical rules. In these four "+ positions and the percentage band of the difference between them), the next two
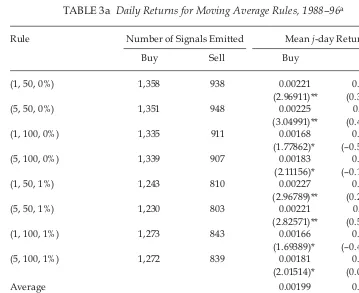
TABLE 3a Daily Returns for Moving Average Rules, 1988–96a
Rule Number of Signals Emitted Mean j-day Returns
Buy Sell Buy Sell
+zE 1,358 938 0.00221 0.00108
(2.96911)** (0.38516)
+zE 1,351 948 0.00225 0.00114
(3.04991)** (0.49837)
+zE 1,335 911 0.00168 0.00056
(1.77862)* (–0.56483)
+zE 1,339 907 0.00183 0.00080
(2.11156)* (–0.12866)
+zE 1,243 810 0.00227 0.00102
(2.96789)** (0.25517)
+zE 1,230 803 0.00221 0.00118
(2.82571)** (0.52688)
+zE 1,273 843 0.00166 0.00063
(1.69389)* (–0.42104)
+zE 1,272 839 0.00181 0.00088
(2.01514)* (0.01569)
Average 0.00199 0.00091
Memo
Unconditional mean daily return 0.00087
Daily standard deviation 0.01662
a +E*+E
the short and long moving averages, and the ‘band’ is the percentage difference between them that is required to generate a buy or sell signal. Figures in parentheses are standard z values testing the differ-ence between the mean buy 1-day return (or the mean sell 1-day return) and the unconditional mean ! +Ez+zE$!
^$$* __
columns report the number of buy and sell signals generated by these rules, and the last two columns show the mean j-day returns from the buy and sell signals.
Results
For all of the technical rules in both sub-periods there are more buy signals than sell signals, which suggests that the market tended to drift upward over the entire period covered.
Moving average rules
Table 3a reports the results for the eight MA rules in the 1988–96 sub-period. The mean daily returns for buys are all large, with an average of 0.00199, and much higher than the unconditional mean daily return of 0.00087 from a BH strategy. All of the eight rules reject the null hypothesis H01that the mean daily return for &zz$ $$ 0.00091, very close to the unconditional mean daily return. In this case, none of the rules rejects the null hypothesis H02 that the mean daily return for sells equals the zz$
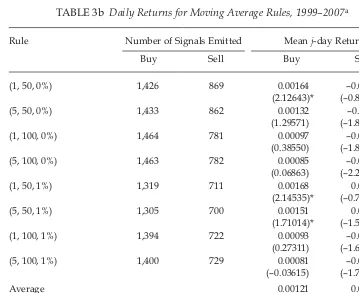
Table 3b shows the results for the 1999–2007 sub-period, which are quite dif-ferent from those for 1988–96. The mean daily return for buys, at 0.00121, exceeds
TABLE 3b Daily Returns for Moving Average Rules, 1999–2007a
Rule Number of Signals Emitted Mean j-day Returns
Buy Sell Buy Sell
+zE 1,426 869 0.00164 –0.00041
(2.12643)* (–0.84219)
+zE 1,433 862 0.00132 –0.00011
(1.29571) (–1.89235)
+zE 1,464 781 0.00097 –0.00015
(0.38550) (–1.87839)
+zE 1,463 782 0.00085 –0.00036
(0.06863) (–2.28484)
+zE 1,319 711 0.00168 0.00044
(2.14535)* (–0.70659)
+zE 1,305 700 0.00151 0.00000
(1.71014)* (–1.50445)
+zE 1,394 722 0.00093 –0.00005
(0.27311) (–1.62062)
+zE 1,400 729 0.00081 –0.00009
(–0.03615) (–1.70299)
Average 0.00121 0.00001
Memo
Unconditional mean daily return 0.00082
Daily standard deviation 0.01449
a As for table 3a.
the unconditional mean daily return of 0.00082 from a BH strategy by a relatively small margin. Only three of the rules reject the null hypothesis H01+z z$E& unconditional mean daily return from a BH strategy. As in the results for 1988–96, none of the rules rejects the null hypothesis H02 that the mean daily return for sells &z z$} sells are generally small, averaging only 0.00001 – much lower than the uncondi-tional mean daily return.
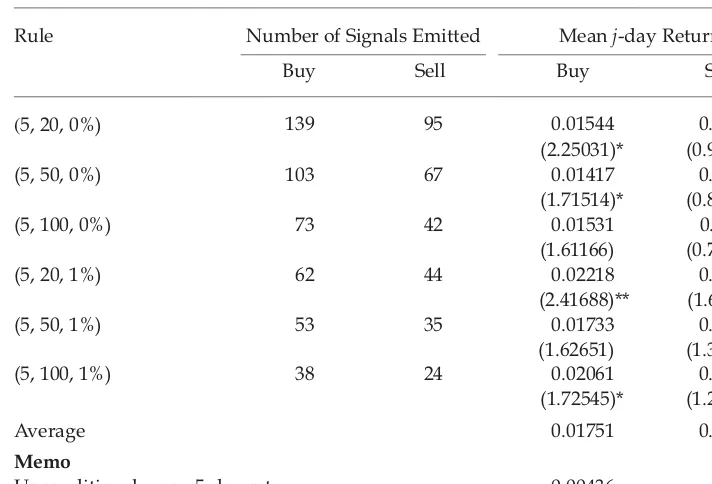
Trading range breakout rules
Table 4a shows the 1988–96 results for the six TRB rules, which can be seen to be similar to the 1988–96 results for the MA rules. The mean 5-day returns for buys are all large, with an average of 0.01751, by comparison with the unconditional mean 5-day return of 0.00436. Four of the six rules reject the null hypothesis H01
that the mean 5-day return for buys equals the unconditional mean 5-day return zz$! sells is also large relative to the unconditional mean 5-day return, with an average `B$[Qz$
TABLE 4a Five-Day Returns for Trading Range Breakout Rules, 1988–96a
Rule Number of Signals Emitted Mean j-day Returns
Buy Sell Buy Sell
(@zE 139 95 0.01544 0.01007
(2.25031)* (0.95897)
+zE 103 67 0.01417 0.01059
(1.71514)* (0.87864)
+zE 73 42 0.01531 0.01135
(1.61166) (0.78049)
+@zE 62 44 0.02218 0.01887
(2.41688)** (1.65791)*
+zE 53 35 0.01733 0.01802
(1.62651) (1.39206)
+zE 38 24 0.02061 0.01922
(1.72545)* (1.25398)
Average 0.01751 0.01469
Memo
Unconditional mean 5-day return 0.00436
5-day standard deviation 0.05807
a + E *
period, the ‘signal’ is the number of past days used to generate a maximum or minimum price, and the ‘band’ is the percentage difference needed to generate a signal. Figures in parentheses are stand-ard z values testing the difference between the mean buy 5-day return (or the mean sell 5-day return) ! +Ez+zE$ one-tailed test.
^$$* _`
hypothesis H02 that the mean 5-day return for sells equals the unconditional mean 5-day return from a BH strategy.
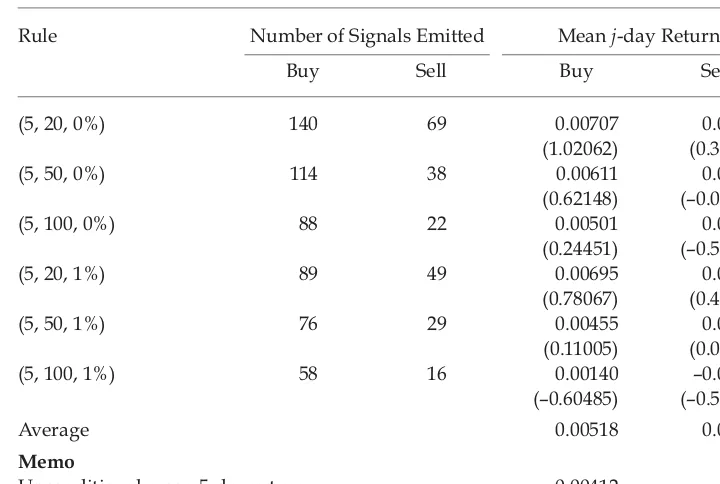
Table 4b shows the TRB results for 1999–2007, which, like those for the MA rules, are in sharp contrast to the results for 1988–96. The mean 5-day return for buys, at 0.00518, is in the neighbourhood of the unconditional mean 5-day return of 0.00412 from a BH strategy, and none of the six rules rejects the null hypothesis
H01 that the mean 5-day return for buys equals the unconditional mean 5-day z$))! sells, at 0.00327, is lower than the unconditional mean 5-day return from a BH strategy. Again, none of the six rules rejects the null hypothesis H02 that the mean !&!z$
In short, with a single exception, neither of the trading rules for sells performed well (that is, generated high and statistically returns) in either of the sub-periods, while the MA rules performed somewhat better than the TRB rules for buys. More importantly for present purposes, the results suggest that there are obvious differences in returns for buys between the two sub-periods. In relation to "+E in the earlier sub-period than would have been obtained from a BH strategy. By contrast, there were few cases of the rules generating such returns in the later sub-period. Mean returns in 1999–2007 were much closer to those from a BH strategy. In only three cases – all relying on MA trading rules – were the mean returns sig-n only three cases – all relying on MA trading rules – were the mean returns sig-+z$E
TABLE 4b Five-Day Returns for Trading Range Breakout Rules, 1999–2007a
Rule Number of Signals Emitted Mean j-day Returns
Buy Sell Buy Sell
+@zE 140 69 0.00707 0.00543
(1.02062) (0.31845)
+zE 114 38 0.00611 0.00378
(0.62148) (–0.06088)
+zE 88 22 0.00501 0.00018
(0.24451) (–0.53972)
+@zE 89 49 0.00695 0.00638
(0.78067) (0.46267)
+zE 76 29 0.00455 0.00439
(0.11005) (0.04280)
+zE 58 16 0.00140 –0.00057
(–0.60485) (–0.54794)
Average 0.00518 0.00327
Memo
Unconditional mean 5-day return 0.00412
5-day standard deviation 0.03422
a As for table 4a.
CONCLUSION
The relative importance of banks and the stock market in Indonesia changed dra-"$* and the stock market was almost negligibly small. It began to grow rapidly from the late 1980s, however, such that by 2004 the value of all listed stocks had >@#** Changes in government policies have played an important part in this transfor-#"*$ to the stock market but poorly designed, presuming a much stronger demand for the services of a stock market than actually existed, and relying mainly on $ $") * possible by the channelling of oil and aid revenues of the government through the state-owned banks. The severe contraction of oil revenue in the mid-1980s "¡ stock market. Subsidised loans ceased to be available, and development of the [*""$"! oriented behaviour for bureaucratic inertia. Banking deregulation led to a rapid expansion of that sector, but the stock market grew even more rapidly, eagerly exploiting new opportunities that presented themselves as per capita incomes *" much greater demand for Indonesian equities.
The key policy changes relating to the stock exchange have harnessed pri-relating to the stock exchange have harnessed pri- to the stock exchange have harnessed pri-vate sector initiative and, somewhat grudgingly, opened the market to foreign investors. Both aspects could be expected to have created pressures for improved -" & $ other emerging markets in which to invest. Accordingly, the empirical analy-" ")* " " *[""""" ["*""$* a back seat.
* -ences in the returns generated by the stock market prior to, and following, the )*"*$ at generated relatively high returns between 1988 and 1996, but returns roughly &*@#?$ policy makers can take some comfort from the fact that the reform and deregula-tion measures implemented appear to have provided a strong basis for the stock " * $$$
^$$* _`_
REFERENCES
Amihud, Yakov and Mendelson, Haim (1988) ‘Liquidity, volatility, and exchange automa-‘Liquidity, volatility, and exchange automa-Liquidity, volatility, and exchange automa-tion’, Journal of Accounting, Auditing and Finance 3: 369–95.
} +=E ! !
-nical analysis’, Financial Management 27 (2): 5–17.
Brock, William, Lakonishok, Josef and LeBaron, Blake (1992) ‘Simple technical trading rules and the stochastic properties of stock returns’, Journal of Finance 47 (5): 1,731–64. Cole, David C. and Slade, Betty F. (1996) Building a Modern Financial System: The Indonesian
Experience, Cambridge University Press, Cambridge.
De Brouwer, Gordon J. (1999) Financial Integration in East Asia, Cambridge University Press, Cambridge.
Dickie, Robert B. (1981) ‘Development of third world securities markets: analysis of general principles and a case study of the Indonesian market’, Law and Policy in International Business 13: 177–223.
Frécaut, Olivier (2004) ‘Indonesia’s banking crisis: a new perspective on $50 billion of losses’, Bulletin of Indonesian Economic Studies 40 (1): 37–57.
Ghosh, Swati R. (2006) East Asian Finance: The Road to Robust Markets, World Bank, Wash-ington DC.
Government of the Czech Republic (2000) Joint ministerial statement of the Special ASEAN Finance Ministers Meeting, Prague, 25 September.
Government of Laos (2005) Joint ministerial statement of the Ninth ASEAN Finance Min-isters Meeting, Vientiane, 6 April.
Government of Myanmar (2002) Joint ministerial statement of the Sixth ASEAN Finance Ministers Meeting, Yangon, 5–6 April.
Government of Vietnam (1999) Joint ministerial statement of the Third ASEAN Finance Ministers Meeting, Hanoi, 20 March.
Greenspan, Alan (1999) ‘Mr Greenspan draws lessons from the global crises of 1997 and 1998’, BIS [Bank of International Settlements] Review 101/1999, 28 September, Speech delivered to the World Bank Group and the International Monetary Fund in Washing-ton DC on 27 September 1999, <http://www.bis.org/review/r990928a.pdf>.
Hudson, Robert, Dempsey, Michael and Keasey, Kevin (1996) ‘A note on the weak form " ^ "" " ( stock prices – 1935 to 1994’, Journal of Banking and Finance 20: 1,121–32.
Levine, Ross and Zervos, Sara (1998) ‘Stock markets, banks, and economic growth’, Ameri-can Economic Review 88 (3): 537–58.
McLeod, Ross H. (1984) ‘Indonesia’, in Financial Institutions and Markets in Southeast Asia, ed. Michael T. Skully, MacMillan, London and Basingstoke: 49–109.
McLeod, Ross H. (1999) ‘Control and competition: banking deregulation and re-regulation
in Indonesia’, 4 (2): 258–97.
Naidu, G.N. and Rozeff, Michael S. (1994) ‘\$& the Singapore Stock Exchange before and after automation’,
2: 23–42.
Noerhadi, D. Cyril (1994) ‘The role of the Indonesian capital market’, in Indonesia Assess-ment 1994: Finance as a Key Sector in Indonesia’s DevelopAssess-ment, ed. Ross H. McLeod, Insti-tute of Southeast Asian Studies, Singapore: 202–22.
Siegel, Jeremy J. (2002) Stocks for the Long Run, 3rd ed., McGraw-Hill, New York.
Wang, Yunjong (2004) ‘Financial cooperation and integration in East Asia’, Journal of Asian Economics 15: 939–55.
World Bank (2006) Unlocking Indonesia’s Domestic Financial Resources: The Role of Non-Bank Financial Institutions, Indonesia Country Management Unit, World Bank, Jakarta.
APPENDIX 1
MAJOR REFORM AND DEREGULATION MEASURESa
1987 The 1987 Pakdes package allowed stock prices to move according to mar-ket forces (rather than being restricted to daily movements of not more `zE>"$&+ [`z"*[" E> foreshadowed the introduction of over-the-counter trading on a ‘Parallel Bourse’(intended to provide small and medium companies with a means of raising capital, and owned and managed by the Securities and Money Trading Organization, whose members are private sector brokers and dealers).
1988 The 1988 Pakdes package was enacted to improve the effectiveness of the " !
1989 The privately owned Surabaya Stock Exchange (SSX) began to operate, with the majority of shares listed on the JSX (Jakarta Stock Exchange) also listed on the SSX.
1992 The JSX became a privately operated exchange, and the dual role of Bapepam (the Capital Market Supervisory Agency) as both regulator and operator of the capital market was reduced to that of regulator alone.b
1994 The JSX introduced a centralised settlement system for all listed securi-ties. Bapepam, together with the Indonesian Accounting Institute, set up new accounting standards to promote information disclosure, transpar-ency and fairness.
1995 The JSX replaced its manual trading system with an automated sys-tem that could process over 140,000 orders a day. Bapepam approved the trading of warrants. The largely inactive Indonesia Parallel Bourse was merged with the SSX. Capital Market Law 8/1995 was enacted. It &"! *""""* generally accepted accounting principles. New penalties for illegal trad-ing activities were also introduced.
1996 The Indonesian Clearing and Guarantee Corporation was set up in *;*="$ services and transaction settlement guarantees.
1997 The Indonesian Central Securities Depository was established to provide " $ `z *" " (with the exception of banks) was lifted.
= "** ""
and promote fair and expeditious resolution of commercial disputes. The restriction on foreign ownership of bank shares was lifted.
a ""[
{"$)>}{+BE>{ [ and joint ministerial statements from the ASEAN Finance Ministers Meetings in Vietnam (Government of Vietnam 1999), the Czech Republic (Government of the Czech Republic 2000), Myanmar (Government of Myanmar 2002) and Laos (Government of Laos 2005).
b This resulted in a name change from ‘Capital Market Supervisory Agency’ to ‘Capital
)>""*$
^$$* _`
1999 Bapepam introduced rule III.A.3 on the appointment of commissioners and directors for stock exchanges and rule V.D.4 on control and protec-tion of securities held in the custody of securities companies on behalf "$*$-oped by the National Committee for Corporate Governance. Bapepam ¥\$" ){) $$
2000 The JSX introduced a scripless settlement system for equity trading. Henceforth, trades were to be executed simply by transferring the owner-ship of the securities from seller to buyer in the registry of scripless "" \? "" statements and rule IX.A.7 on the responsibilities of under-writers with respect to subscriptions and allotments of securities in a public offering. An ASEAN working committee was set up to collaborate with the private sector in developing infrastructure, institutions and instruments that would assist in the formation of well functioning and competitive capital markets in the ASEAN countries.
2001 The SSX began trading in bonds and in derivatives such as equity index futures. Rule III.A.3 was revised with the aim of improving the integrity and quality of stock exchange management.
2002 The Jakarta Islamic Index (JII) was launched, to be used as a benchmark for measuring market activities in accordance with syariah (Islamic law). The JSX began to implement a remote trading system. The settlement date for the scripless system was shortened from 4 to 3 business days after each transaction. The ASEAN countries adopted the International Organization of Securities Commissions’ principles for securities regula-tors, in order to strengthen corporate governance and provide greater transparency and information disclosure.
2003 Bapepam stepped up enforcement efforts aimed at improving informa-tion disclosure and transparency on the part of listed companies. Bap-epam and the Indonesian Central Securities Depository implemented a system called E-Monitoring of Investment Funds, aimed at monitor-ing and overseemonitor-ing the activities of investment funds and investment managers.
2004 Bapepam imposed sanctions on 313 companies for late submission of "$" offerings, and for violations of rules on disclosure of information. The SSX began trading in stock options. Bapepam introduced new rules to * " & * Q$}" Financial Institutions Supervisory Agency (Bapepam–LK) was formed through the merger of Bapepam and the Financial Institutions Directo-rate General of the Ministry of Finance.
2005 Rule No. IV.C.4 on management of capital protected funds, capital guar-anteed funds and index funds was introduced. The JSX began trading in equity options. Two value-weighted FTSE/ASEAN equity indices were launched, with the objective of grouping the ASEAN-5 equity markets
(Indonesia, Malaysia, the Philippines, Singapore and Thailand) as an asset class.
2006 The National Committee for Corporate Governance issued a new code of good corporate governance. New regulations were introduced to encourage more listings on the stock market. New regulations on licens-ing requirements and a standardised code of ethics were introduced for mutual fund sales representatives.
2007 Companies Law 40/2007 was enacted to govern disclosure and transpar-"" Investment Law 25/2007 was enacted. The JSX and the SSX were merged to become the Indonesia Stock Exchange (IDX).