Full Terms & Conditions of access and use can be found at
http://www.tandfonline.com/action/journalInformation?journalCode=cbie20
Download by: [Universitas Maritim Raja Ali Haji] Date: 17 January 2016, At: 23:59
Bulletin of Indonesian Economic Studies
ISSN: 0007-4918 (Print) 1472-7234 (Online) Journal homepage: http://www.tandfonline.com/loi/cbie20
Effective rates of protection revisited for Indonesia
Stephen V. Marks & Sjamsu Rahardja
To cite this article: Stephen V. Marks & Sjamsu Rahardja (2012) Effective rates of protection revisited for Indonesia, Bulletin of Indonesian Economic Studies, 48:1, 57-84, DOI:
10.1080/00074918.2012.654484
To link to this article: http://dx.doi.org/10.1080/00074918.2012.654484
Published online: 14 Mar 2012.
Submit your article to this journal
Article views: 265
View related articles
ISSN 0007-4918 print/ISSN 1472-7234 online/12/010057-28 © 2012 Indonesia Project ANU http://dx.doi.org/10.1080/00074918.2012.654484
EFFECTIVE RATES OF PROTECTION REVISITED
FOR INDONESIA
Stephen V. Marks* Sjamsu Rahardja*
Pomona College, Claremont CA World Bank
This paper calculates nominal and effective rates of protection for Indonesian tradables sectors in early 2008, and compares these igures with previous calculations for 1987 and 1995. Such a review is overdue. Many non-tariff barriers to imports and exports have been abolished, though new import restraints on rice and sugar are notable ex
-ceptions to this trend. Import tariffs have been lowered, particularly through regional preferential trade arrangements. We account for such arrangements in two different ways. Export taxes persist in certain natural resources sectors, but most rates have been reduced. We ind that more than half of the effective support provided to trad
-able products sectors now comes from subsidies on fuels, fertiliser, electricity and liqueied petroleum gas, rather than from trade policies per se. Duty drawbacks and exemptions for exporters boost the effective rate of protection for tradables sectors overall by a small fraction of 1%, and for no input–output sector by more than 3%.
Keywords: ASEAN Free Trade Area, trade liberalisation, preferential trade agreements
INTRODUCTION
Indonesian trade policies have undergone signiicant reform in recent decades, but since the 1997–98 economic crisis and the related intervention by the Inter -national Monetary Fund some distortive trade policies have been introduced as well. Given the many changes in trade and related policies, a comprehensive anal -ysis of the overall structure of trade policy is overdue.
We estimate nominal and effective rates of protection for all tradables sectors in Indonesia in early 2008. Our analysis accounts for import tariffs, export taxes, selected non-tariff trade barriers, and duty drawbacks. It distinguishes between the multilateral import tariff commitments in Indonesia’s most-favoured-nation (MFN) tariff schedule and those in its preferential schedules under the ASEAN Common Effective Preferential Tariff (CEPT) program and the ASEAN–China and ASEAN–Korea trade agreements. It also accounts for central government subsidies on fuels, fertiliser, electricity and liqueied petroleum gas (LPG).
* [email protected]; [email protected]. This work was initiated in 2007 while Marks was consultant to the World Bank, Jakarta, in the Trade Research and Development Agency, Ministry of Trade, Republic of Indonesia. The views in this paper are those of the authors alone, and not necessarily those of the World Bank or the Ministry of Trade. The authors are grateful to Pomona College for research support, to George Fane and Sam Laird for helpful discussions, and to participants in an August 2007 seminar in Jakarta and an October 2007 seminar at the Australian National University for their comments.
58 Stephen V. Marks and Sjamsu Rahardja
Calculation of effective rates of protection allows assessment of the impact of the overall structure of trade and other policies on incentives to produce various tradable goods – that is, items that compete with imports or are exported. The effective rate of protection accounts for the effects of policies on the prices of both inputs and outputs. In particular, for a given sector, it measures the proportional amount by which value added per unit with distortive policies in effect exceeds value added per unit under free trade. Corden (1966) argues that effective rates of protection are associated with the resource-pull effects of the structure of trade policies across tradable goods sectors.
Although the calculation of effective rates of protection is based on the com -plete input–output (IO) table of an economy, and uses data on policies in all tradables sectors, the effective rate of protection is a partial equilibrium measure. Compared with the alternative of computable general equilibrium modelling, cal -culation of effective rates of protection offers some advantages, however. First, it allows analysis of the effects of trade policies at a relatively disaggregated level. In particular, this study uses the 175-sector IO table for the Indonesian economy in 2005, while the popular general equilibrium model GTAP (Global Trade Analysis Project)includes only 57 sectors. The more detailed analysis offers not only more information but also less risk of aggregation bias. Second, the calculation of effec -tive rates of protection can be done on a spreadsheet, in a rela-tively simple and transparent manner, and thus is accessible to many researchers in countries like Indonesia. Finally, empirical general equilibrium analysis itself makes restrictive assumptions about the production and consumption structure of the economy, and requires one to estimate or assume numerous parameter values.
One advantage of general equilibrium and even some partial equilibrium anal -yses over effective protection calculations, however, is their capacity to treat sepa -rately any blocs of countries that are subject to different tariff schedules. Effective protection calculations require a single measure of the nominal rate of protection. To allow for a reasonable range of possibilities, this paper will form two alterna -tive composite measures of the nominal rate of protection in the presence of pref -erential agreements.
We irst outline the assumptions that underlie effective protection analysis. We then consider methodological issues, notably how to handle non-tradable products and how to aggregate nominal rates of protection from individual tariff lines to IO sectors. Next we survey the Indonesian trade and related policies to be examined. We then present our calculations of nominal and effective rates of pro -tection for the various tradables sectors under alternative policy scenarios, and put them in historical context. We conclude with some thoughts on broader issues for trade and related policies.
DEFINITIONS AND ASSUMPTIONS
The nominal rate of protection (NRP) for some tradable item can be deined as the proportion by which its domestic producer price exceeds the border price.1 If
we assume, not so plausibly for Indonesia, that the country is too small to inlu
-1 For an imported item, the border price is the price of the item just before it enters cus
-toms. For an exported item, it is the price of the item just after it exits cus-toms.
ence external prices, the NRP also equals the proportion by which the domestic producer price of the item under distortive policies exceeds the level under free trade. If it is also assumed that domestic and foreign tradable items are perfect substitutes, then identical price relations between domestic and border prices will hold for domestic products and their foreign counterparts. If, in addition, per-fect competition is assumed to prevail, then a higher NRP will generally provide incentives for more domestic production of an item, all else equal, rather than allow for the increased exercise of monopoly power.
The effective rate of protection (ERP) for a tradable item can by analogy be deined as the proportion by which value added per unit of output with distor -tive policies in effect exceeds the level under free trade. Since value added can be calculated as the difference between the value of output and produced input costs, a positive ERP indicates that policies on balance raise the domestic price of output relative to intermediate inputs. The ERP can also be negative. This could indicate that on balance the inputs used by a sector are subject to higher import tariff rates than is its output, for example. Production will tend to expand in sec -tors with higher than average ERPs and contract in those with lower than average ERPs, but some sectors with higher than average ERPs may contract relative to free trade and some with lower than average ERPs may expand relative to free trade. Without a full computable general equilibrium model, which as we note above would present its own problems, one could not know which sectors, if any, are subject to such anomalies.
We will refer to the ‘effective rate of protection’ throughout this paper, even though we will include analysis of policies such as subsidies that go beyond the trade policies usually examined in effective protection calculations. In these cases, we sometimes use the more general notion of the ‘effective rate of support’ instead.
ALTERNATIVE APPROACHES TO THE CALCULATIONS
The calculation of effective rates of protection takes into account both direct and indirect effects of policies on the prices of inputs and outputs in a sector. In general, the indirect effects work through non-tradable items in their role as inputs into production. For example, a ban on exports of coal could drive down its domestic price and thus lower the costs and price of electrical power, which is not extensively traded internationally. This would provide an indirect subsidy to sectors that use electricity.
A major conceptual issue for the calculation of ERPs is how to handle non-tradable products such as electricity. The prices of non-non-tradable items are not set by international commodity arbitrage, but rather are assumed to be determined within the domestic economy along with the prices of the services of primary factors of production such as labour and capital. The imposition of import tariffs tends to drive up the prices of non-tradables, both by diverting demand from tradables to non-tradables and by adding to the costs of tradable inputs and pri -mary factors of production used to produce non-tradables.
In one of the earliest studies of effective rates of protection, Balassa (1965) assumed that the prices of non-tradable items were not affected by trade poli -cies. Though Balassa’s method was simple to implement, the assumption was widely criticised. In a later study, Balassa (1982) assumed instead that the prices of
60 Stephen V. Marks and Sjamsu Rahardja
non-tradables increased by an amount just suficient to cover the increase in their tradable-input costs caused by the trade policies. These tradable inputs could be employed directly in the production of a non-tradable item, or indirectly in the production of other non-tradable inputs used to produce the item, as revealed by the IO table. Thus this approach allows for a limited cost-push price effect on non-tradables. Implicitly it assumes that primary factors of production are offered in perfectly elastic supply in non-tradables sectors, so that the various components of value added per unit remain constant. This is awkward, because not all factors of production can be offered in perfectly elastic supply to tradables sectors: the logic of effective protection requires that value added per unit in tradables sec -tors can change, even as the ratios of quantities of inputs to quantities of outputs remain constant.
Corden (1966) proposed an alternative value added measure to calculate ERPs. He observed that an import tariff on the output of a sector protects not only the primary factors of production that contribute value added directly to that sec -tor, but also the non-tradable inputs used in it, and thus the primary factors of production that contribute value added to the production of these non-tradable inputs as well. The Corden approach traces back through the IO table until all non-tradable inputs are solved out of the system: all that remains is direct and indirect tradable-input costs and value added. The ERP is then calculated as the proportional change in both directly and indirectly contributed value added per unit of output in a tradables sector. This value added measure is calculated as the price of the output minus the total direct and indirect tradable-input costs per unit of output. Because non-tradables are solved out of the system, the question of how to calculate the difference between their prices under free trade and under distortive policies does not arise.
This paper will apply both the Balassa (1982) and the Corden (1966) approaches. The empirical literature on effective protection includes numerous applications of both. The 1982 volume edited by Balassa includes a number of studies that apply the Balassa method, while the Corden approach was applied in the country stud -ies in Krueger et al. (1981). In their stud-ies of ERPs in Indonesia, Fane and Phillips (1991) and Fane and Condon (1996) (referred to below as FPC) favoured the less commonly used Humphrey (1969) method. The Humphrey method is similar to the Balassa (1982) method, in that it allows for import tariffs to boost the prices of non-tradables by raising the prices of tradable inputs. However, it allows an addi -tional cost-push effect through a cost-of-living increase in wage rates attributable to the effects of the trade policies on the prices of tradable and non-tradable items consumed by workers. Speciically, it assumes that real wages are not affected by the trade policies. FPC also include calculations of the real ERP, equal to the per -centage increase in value added per unit delated by the average wage. In a paper about domestic resource cost in Indonesia, Warr (1992) compares ERP calculations with the Balassa and Corden methods based on the Fane–Phillips data set.
CALCULATING NOMINAL RATES OF PROTECTION
We shall refer to tradable items that compete with imports as ‘importable’, and those that are exported as ‘exportable’. We calculate the NRP for an importable item as the oficial import duty rate, or the implicit tariff rate associated with
an applicable non-tariff import restriction if one is present.2 Rates of protection
for exportable items are calculated similarly. Most exportables have a zero NRP, unless they are subject to an export tax or other export restraint. We measure all tariff and tax rates as ad valorem rates. Thus, under the assumptions described earlier, for some tradable item subject to an actual or implicit import tariff or export tax at an ad valorem rate t, the domestic price pD is locked into a relation -ship with the border price p as pD = (1 + t) p. For an import tariff, t ≥ 0, and for an export tax, t ≤ 0.3
To aggregate NRPs for individual tradable items to the level of IO sectors, it is important to take into account the impacts of policies, or the absence of poli -cies, on the prices of both importables and exportables. Moreover, to account for preferential trade policies, such as the CEPT rates within ASEAN, trade data dis -aggregated by region or country must be used. Thus, we use trade weights to aggregate NRPs.
A conceptual and practical issue is that trade weights under-estimate the dis -tortive effects of trade policies. For example, the enforcement of an import ban would lead to zero imports of an item, and presumably a high NRP, but the use of trade weights would exclude that rate of protection from the aggregate igure. Thus aggregate rates of protection, either positive or negative, tend to be biased toward zero if trade weights are used.
FPC instead used Indonesian output weights, as did we in an earlier version of this work. However, comprehensive Indonesian output data exist only for manu -facturing, not for agriculture or mining, and they are typically much less detailed than trade data, which are available at the level of tariff lines.4 Also, the output
data do not match well with the trade data needed to analyse preferential trade agreements.
Finally, given that we use oficial import tariff rates to measure nominal rates of protection, the use of trade weights offers a potential corrective effect not afforded by the use of output weights. In particular, if an import tariff is prohibitive, the oficial duty rate can over-state the actual protective effects of the tariff. The NRP in such cases is ideally measured as the lowest tariff rate that would drive imports to zero, which may be lower than the oficial duty rate. Similar considerations apply to export taxes. The most precise way to correct for this problem would be to make direct comparisons of producer prices of such items inside the economy with prices at the border, just as should be done to ind the implicit tariff rates associated with non-tariff trade barriers. However, such an approach is costly,
2 The latter calculation is based on comparison of domestic producer prices with border prices, and thus takes precedence over the oficial duty rate: if the percentage price dif
-ferential exceeds the oficial duty rate, then evidently the non-tariff measure is the binding restraint on imports; if it is less than the oficial duty rate, then evidently leakages of some sort have reduced the effectiveness of the import duty.
3 This assumes that the export tax rate is applied to an external market price rather than a domestic price of the product to calculate the amount of tax per unit. It is consistent with the Indonesian practice of setting directive export prices (harga pedoman ekspor) based on external prices.
4 Output weights are also distorted by trade and other policies, though presumably less consequentially than trade weights.
62 Stephen V. Marks and Sjamsu Rahardja
and is fraught with complications of its own.5 With trade weights, the prohibitive
import tariffs or export taxes get zero weight. Thus, trade-weighted aggregation is an imperfect approach, but at least it avoids the problem that oficial import duty or export tax rates may be more than prohibitive. Nevertheless, given the concern about a possible downward bias in rates of protection if trade weights are used, we also tried an alternative aggregation method based on global import weights. The differences in the results are relatively minor, and we conclude that the use of Indonesian trade weights is preferable.6
Import duties and export taxes are set by the government of Indonesia at a nine-digit Harmonised System (HS) level, based on the ASEAN Harmonised Tar -iff Nomenclature system. We establish a concordance between the nine-digit HS codes used to specify trade policies and the HS codes used to classify Indonesian trade data in 2004. We then use trade weights to aggregate NRPs for these product categories to the level of IO sectors: import policy price effects are weighted with import values, and export policy price effects (zero or negative) with export values. In most tariff lines there are both imports and exports, in which case we assume that the imported and exported products are differentiated from each other, such that import duties and taxes have a protective effect for the domestic products that compete with the imports but not for the domestic products that are exported.
INDONESIAN TRADE AND RELATED POLICIES
We now survey the Indonesian trade and related policies accounted for in our nominal and effective protection calculations.7
Import tariffs
Import tariffs in Indonesia are now relatively low in most sectors of the economy. Many sectors uniformly have MFN tariff rates of zero or 5%. In others, tariff rates escalate as the product moves downstream, as we discuss below. Higher import tariffs stand out in certain other sectors. MFN tariff rates are 150% on liquors and certain other alcoholic beverages; 90% or 150% on wines; 40–50% on assembled motor vehicles; 40% on assembled motorcycles and beer; 30% on ethyl alcohol and ceramic tableware and ornaments; up to 30% on certain plastic products; 25% on chicken thighs, cut lowers and certain fruits and vegetables; 20% or 25% on
5 George Fane noted in a personal communication that price comparisons such as were used in his earlier studies of Indonesia can often lead to negative implied rates of protec
-tion, even for imported items subject to import tariffs or non-tariff measures. One reason is that many prices are not posted, but must be negotiated by the buyer, and the seller un
-derstands that the researcher does not intend to buy the product. Also, small distribution margins in relatively low-wage countries like Indonesia may push down domestic prices relative to their foreign counterparts.
6 The alternative method distinguishes between import-oriented and export-oriented sec -tors, much as FPC did, except that we use global trade weights instead of output weights.
Details of the alternative calculations are available upon request from the authors.
7 For institutional details on Indonesian trade policies, World Trade Organization (2007) is a useful reference.
assembled footwear; and 20% on aluminium foil, certain metal building materi-als, ceramic tiles and certain other ceramic products.
By early 2008 Indonesia applied preferential import tariff rate schedules under the ASEAN CEPT scheme introduced in 1993, and under the more recent ASEAN– China (July 2005) and ASEAN–Korea (January 2006) comprehensive economic coop -eration agreements. Several additional regional agreements are now in effect: the Japan–Indonesia Economic Partnership Agreement (July 2008); the ASEAN–Japan Comprehensive Economic Partnership (December 2008); the ASEAN – Australia and New Zealand Free Trade Agreement (January 2010); and the ASEAN–India Comprehensive Economic Cooperation Agreement (January 2010).8
Speciic tariffs were applied to imports of sugar and rice in the MFN, ASEAN– China and ASEAN–Korea tariff schedules in 2008. The speciic rate of Rp 450/kg for rice products was equivalent in January 2008 to ad valorem rates of about 25.0% for unhusked rice, 12.5% for milled, polished rice and 9.9% for rice lour. The spe -ciic rates of Rp 550/kg for raw sugar products and Rp 790/kg for reined sugar products were equivalent to ad valorem rates of 16.6% and 22.4%, respectively. However, rice and sugar were accorded special treatment in the CEPT in August 2007, and are on Indonesia’s CEPT list of ‘highly sensitive’ products. Indonesia’s CEPT schedule in 2008 included ad valorem tariff rates of 30% on all rice products except rice lour, for which the rate was zero; the CEPT ad valorem rate was 30% for raw sugar and 40% for reined sugars. Except for rice lour, then, the CEPT ad valorem rates for rice and sugar were actually higher than the ad valorem equiva -lents of the speciic tariff rates on these commodities.
With multiple tariff schedules in use, which rate of duty should be applied in calculating the NRP for the purposes of effective protection analysis? In order to cover a range of possibilities, we use two different composites of the MFN, CEPT, ASEAN–China and ASEAN–Korea rates.
The irst is the marginal rate of protection (MRP). The rate is marginal in the sense that it is the highest tariff rate, MFN or preferential, that applies to a positive amount of imports in the product category.9 The MRP indicates the impact of the
tariff system on domestic prices under the assumption that products imported from various countries are perfectly substitutable. The logic is that it is the tariff rate that will set domestic prices, at the margin, in a policy-distorted context. If it is attractive to import a product from the country subject to the highest tariff rate with the distortive policies in effect, then under free trade it would certainly be attractive to import from that country as well, given that import prices will be lower in general, but particularly for that country.10 Countries subject to lower
rates may have lower costs per unit, but may be limited in the amounts they can supply, or may have higher costs per unit so that they would be competed out of the market under free trade. In either case, the impact of the trade policies on
8 The Asian Development Bank’s Asia Regional Integration Center has a useful database on the status of the regional trade agreements of a number of countries; see <http://aric. adb.org/FTAbyCountryAll.php>.
9 Marks (2011) uses this approach to examine multiple tariff schedules in the Lao People’s Democratic Republic in 2008.
10 This assumes away cross-price effects among products that could lead to a signiicant reduction in trade in the product.
64 Stephen V. Marks and Sjamsu Rahardja
domestic prices is best measured by the highest tariff rate that is actually applied in the distorted situation.
The second approach is to calculate an average rate of protection (ARP) – a weighted average of the tariff rates applicable to various countries, with imports from each used as the weights. The ARP makes sense if the imports from each coun -try are separate products that are not at all substitutable. Our instinct is that the MRP igures are more representative of the protective effects of the policies. Indeed, for the ARP to make sense, our earlier assumption that domestic and foreign products are perfect substitutes requires that imports from each trading partner be perfectly substitutable with a portion of domestic output, but not at all substitutable with each other. Nevertheless, used along with the MRP, the ARP provides a reasonable bound on the range of nominal rates of protection on the import side.
Table 1 summarises the various tariff schedules for broad sectoral categories of tradable products.11 We see from the table that MFN import duties overall are
highest for agriculture, but that non-oil and gas manufacturing is not far behind.
11 To obtain the broader product aggregates from IO sectors, we use the same IO-sector free-trade value added weights that we use below to aggregate ERPs, using the Balassa (1982) method to estimate value added per unit under free trade, and accounting for all the policies examined in this paper. The use of the free-trade weights reduces the weight on heavily protected sectors such as rice, and boosts it in sectors subject to export restraints. Our mixed approach, in which trade (in this case, import) weights are used to aggregate tariff lines to the level of IO sectors, but IO sectors are aggregated to broader sectors using free trade value added, seemed a reasonable way to minimise biases in our presentation, given particularly that tariff rates are more uniform within than among sectors.
TABLE 1 Import Tariff Rates under Various Tariff Rate Schedules, 2008a
(%)
Sector MFN CEPT China Korea MRP ARP
Agriculture (excluding forestry & isheries) 7.6 4.0 4.9 7.2 8.1 5.5
Forestry & isheries 4.2 0.1 0.4 3.9 4.1 2.3
Mining & quarrying (excluding oil & gas) 3.3 0.0 3.3 3.3 3.1 1.6 Oil & gas extraction & reining 1.5 0.1 1.5 1.5 0.7 0.7 Manufacturing (excluding oil & gas) 7.3 2.3 6.0 5.2 7.9 5.9
All tradables sectors 5.4 1.7 4.2 4.4 5.6 4.0
a Table abbreviations: because the size of tables 3, 4 and 6 prevents insertion of explanatory notes,
abbreviations used in all the tables in this paper are explained below.
MFN: most favoured nation (non-discriminatory import tariff rates accorded by one state to others); CEPT: ASEAN’s Common Effective Preferential Tariff program;
MRP: marginal rate of protection; ARP: average rate of protection;
d: fraction of the value of exports for which duty drawbacks and exemptions are assumed to apply; ERPB: effective rate of protection calculated by the Balassa (1982) method;
ERPC: effective rate of protection calculated by the Corden (1966) method;
ERPH: effective rate of protection calculated by the Humphrey (1969) method;
NRP: nominal rate of protection.
Source: All tables draw on calculations by the authors based on data described in the text, unless otherwise noted.
The 2008 CEPT schedule dramatically lowered tariff rates on imports from other ASEAN countries relative to the MFN schedule. CEPT rates in mining and quar -rying, forestry and isheries, and oil and gas were reduced to zero or nearly so, while those in manufacturing and agriculture were well below MFN levels. Indo -nesia’s tariff rate concessions were not nearly as large under the ASEAN–China and ASEAN–Korea trade agreements as under the CEPT program.
The table shows that most MRP import tariff rates are close to the MFN rates, relecting the fact that in most sectors the MFN rate is higher than the prefer -ential rates, and that for most imported product categories with positive tariffs there are some imports from countries other than China, Korea or other members of ASEAN. That the average tariff rate is higher for the MRP than for the MFN schedule for agriculture, manufacturing and tradables sectors overall indicates that the negotiations with China, Korea and even ASEAN over certain products led to import tariffs at higher rates than under the MFN schedule in 2008.12 Most
of the ARP import tariff rates are quite a bit lower than the MRP rates, relecting the markedly lower CEPT tariff rates as well as the importance of intra-ASEAN trade.
Duty drawbacks and exemptions
Duty drawbacks for imported intermediate inputs and raw materials are allowed for exporters in Indonesia; duty exemption for exporters is automatic in bonded customs zones (kawasan berikat) within the country.13 The policy was irst intro -duced in 1986 as part of an aggressive package of trade reform measures to sup -port ex-port-oriented industries, particularly garments and textiles.14
There is some question about how effective the duty facilities program has been, at least in the past, with anecdotal reports that drawback payments have been delayed, in some cases in order to extract commissions from applicants for the drawbacks. On the other hand, exporters are now allowed to receive draw -backs or exemptions for duties paid on inputs used not only for exports but also for domestic sales up to 25% of the value of exports.15
12 This held for 186 tariff lines for ASEAN–China trade, 67 for ASEAN–Korea trade and six for the CEPT program (the latter for rice and sugar lines only, as noted earlier). Indo
-nesia’s MFN rates were reduced for a number of products in 2008. For about 80% of the tariff lines for which Indonesia’s 2008 ASEAN–China and ASEAN–Korea tariff rate com
-mitments were above its 2008 MFN rates, those com-mitments were at or below its 2007 MFN tariff rate levels.
13 Exporters are also allowed drawbacks for value added taxes paid on imported inputs, but in this paper we will not account for value added taxes in any way. Marks (2005) ap
-plies an effective value added tax rate analysis to Indonesia based on the framework of Gottfried and Wiegard (1991). We also do not account for sales taxes on luxury goods. Most of the goods targeted are durable capital goods, and in any case these taxes would have a negligible impact on costs of production in the economy.
14 Muir (1986) provides a useful overview and evaluation of the duty drawbacks at the time of their introduction.
15 Minister of Finance Decree 129/KMK.04/2003. For only one IO sector theoretically eli
-gible for duty drawbacks, LNG (sector 105), is 125% of exports more than total output. We do not treat this constraint as binding. As table 6 below shows, however, the duty facilities provide a negligible beneit to the sector anyway.
66 Stephen V. Marks and Sjamsu Rahardja
For our analysis of duty drawbacks and exemptions, we use the method dis-cussed by Fane and Condon (1996) in their appendix;16 the method can be applied
only for IO sectors, not for individual tariff lines, since it requires consistent trade and output data. We generally use the Fane–Condon assumption that 80% of the duty facilities to which exporters are entitled is recovered, but we also do some sensitivity analysis to understand the impact of the policy better.
Export taxes
Export restraints on palm oil products go back at least to 1978. Since 1994 the pri -mary form of intervention has been export taxes, except during the early months of the 1997–98 crisis, when export quotas and even bans on exports of certain products were imposed, in an effort to hold down cooking oil prices and to sup -port palm oil reiners.17 During the height of the commodity price boom in 2007,
the government boosted export taxes on palm oil products to help stabilise the domestic price of cooking oil once again. In January 2008 the tax rate on most palm oil products was 10%, but the rate on palm fresh fruit bunches and palm kernels was 40%.18
In early 2008 export taxes on the least processed animal hides were applied at a rate of 25%, and on tanned hides at 15%.19 Export taxes were applied on unpro
-cessed rattan at 20%, and on semi-pro-cessed rattan products at 15%; wood veneer exports were taxed at 15%, and wood chips and some processed wood items at 5%.20 Finally, a tax on sand exports was applied at a rate of 15%. A tax of 5% was
applied to coal exports in 2005, but it was rescinded in 2006 because of dificulties in implementation.
Non-tariff import barriers
Although the government requires that importers of many products be regis -tered with it or be producers within certain sectors, there are now relatively few non-tariff measures that explicitly limit the quantity of imports. Some measures presumably exist to protect public health, safety, morals or the environment. Two sectors with non-tariff import restrictions that clearly have had an impact on import volumes are sugar and rice. These measures apply to trade with all
16 The appendix is available at <http://rspas.anu.edu.au/~gfane/Indon%20trade%20 policy_Appendix.PDF>.
17 Reiners gain from export taxes on crude palm oil, but are harmed by export taxes on reined products such as cooking oil.
18 Under Minister of Finance Regulation 94/PMK.011/2007, the export tax rate schedule that applied for the various palm oil products depended on the level of a palm oil reference price, which was formed as a composite of the prices of these products in international markets. In January 2008 the reference price was high enough for the highest export tax rate schedule allowed by the regulation to apply. The reference price, set on a monthly basis, was given in Minister of Trade Regulation 48/M-DAG/PER/12/2007. The export tax scheme was revised further in February 2008, with an additional higher tax rate sched
-ule for the highest reference prices. Palm oil products are included in IO sector 56. 19 Minister of Finance Regulation 92/PMK.02/2005. The hides are included in sector 81. 20 Minister of Finance Regulation 51/PMK.02/2006. Unprocessed rattan is included in sector 30, wood chips and processed wood in sector 84 and veneers in sector 85.
countries, irrespective of any preferential trade agreements in effect. Both restric -tions were enacted in 2004 to protect the two sectors from foreign competition. In the case of sugar, an import quota was imposed, and the state-owned sugar enterprises on Java were assigned the quota rights.21 For rice, the government
allowed a seasonal ban on imports around the time of the primary harvest season to be extended throughout the year to keep prices within Indonesia elevated rela -tive to the world market.22 In 2008 the government allowed imports of certain
types of rice by private importers with special licences, while reserving imports of medium-quality rice only for the national logistics agency, Bulog.23
We use detailed data on the prices and costs of importation of sugar and rice to derive NRPs in these sectors.24 We calculate the import NRP for ield rice at
41.6%, and for milled, polished rice at 36.9%, as of early 2008. These NRPs exceed the ad valorem equivalents of the speciic tariffs on these rice products, and the ad valorem rates applicable under the CEPT schedule. Rice lour is not covered by the seasonal import ban, however, so the applicable tariff rate sets the NRP in that case.
We similarly estimate the NRP from the non-tariff measures for sugar at 35.6%, which exceeds the ad valorem equivalents of the speciic tariffs on sugar products and the ad valorem rate of 30% on raw sugar, but not the 40% rate on reined sugar under the CEPT schedule. Given that our calculation of the impact of the non-tariff measures for sugar was done through a price comparison that yields a percentage difference lower than the 40% CEPT rate and, given anecdotal evi -dence of smuggling of sugar into the country, we use our price comparison igure rather than the oficial CEPT rate.
Of potential interest for future study are non-tariff restrictions on imports of salt (a seasonal ban on salt imports is used to support prices during the primary production season); cloves (imports require permission of the Director General of Foreign Trade in the Ministry of Trade); wheat lour (the application of Indonesian
21 The sugar import policy regime was established through a series of decrees of the Min
-ister of Industry and Trade between 2002 and 2004, culminating in Min-ister of Industry and Trade Decree 527/MPP/Kep/9/2004. Stapleton (2006) offers a useful analysis of sugar trade policies during this period.
22 The seasonal ban was initially established by Minister of Industry and Trade Decree 9/ MPP/Kep/1/2004. Minister of Industry and Trade Decree 357/MPP/Kep/5/2004 subse
-quently allowed the ban to be extended at the discretion of the Minister of Industry and Trade, in consultation with the Minister of Agriculture.
23 Minister of Trade Regulation 12/M-DAG/PER/4/2008. (The former Ministry of Indus
-try and Trade was split into the Minis-try of Indus-try and the Minis-try of Trade in 2004.) Imports by Bulog remained subject to a seasonal ban, and the authority for Bulog to import medium-quality rice in practice required a cabinet decision or a recommendation from the Food Stability Team in the Coordinating Ministry of Economic Affairs.
24 Sugar cost parameters come mainly from the Ministry of Trade and from sugar import
-ers. Parameters for rice were kindly provided by George Fane as part of the research for Fane and Warr (2008). The rice import barriers affect sectors 1 (ield rice), 57 (milled, pol
-ished rice) and 59 (other lour). The sugar import barriers all apply to sector 62.
68 Stephen V. Marks and Sjamsu Rahardja
national standards may add to the costs of importation); and certain iron and steel products – as well as the ban on imports of used capital equipment.25
Non-tariff export barriers
Exports of a variety of products are banned. Some of these bans have an environ-mental protection rationale, but economic motives may also be present. Despite the bans, exports were recorded in some cases and thus there is some basis for inclusion of these policies in our analysis, even with the use of trade weights.
Exports of logs and the raw materials used to make wood chips have been banned most recently since 2001.26 Our selective and rough comparison of log
prices in Indonesia and Malaysia indicates an NRP for logs of –14.9%.27 In addi
-tion, exports of unprocessed and semi-processed rattan of varieties that grow in the wild have been banned since 2004,28 but the data do not allow us to identify
these varieties and we do not have price data to estimate their NRP.
The government prohibited sea sand exports in 2003,29 and extended the ban
to all sand and a variety of soils in 2007.30 The exports had mainly been from the
Riau Islands province to nearby Singapore for use as landill. Based on the price effects of the extension of the ban, which evidently was more effective than the previous selective ban, we estimate the NRP for sand and soils to be about –84.0%.
Finally, rice and rice-lour exports were banned from 1998 to 2002 in an effort to avoid leakages from subsidised rice programs for the poor, but they were not subject to non-tariff restraints at the start of 2008.
Export restraints on our list for future study include the ban on exports of tin ore implemented in 2002;31 the ban on exports of many varieties of sawn wood
initiated in 2005;32 and domestic market obligations for the sale of coal and other
minerals that were enacted in 2009.33
25 Business owners have stated that the ban on imports of used capital equipment can raise the cost of importing spare parts and other new equipment because of corrupt be
-haviour by customs oficials. There have been a number of reforms of the policy in recent years, but the basic structure remains intact.
26 Resosudarmo and Yusuf (2006) note that log exports were irst banned in 1981. The ban was replaced by high export taxes in 1992. These export taxes were reduced sharply under the terms of the agreements with the International Monetary Fund in 1998.
27 Malaysia applies a quota on log exports from the state of Sarawak on the island of Bor
-neo, and thus the price of logs may be depressed there as well, which would imply that the actual rate of protection may be more negative than we calculate based on a comparison of log prices in Indonesia and Sarawak. Perhaps a more apt comparison would be between log prices in China and in Indonesia, adjusted for transport and other costs.
28 Minister of Industry and Trade Decree 385/MPP/KEP/6/2004. 29 Minister of Industry and Trade Decree 118/MPP/KEP/2/2003. 30 Minister of Trade Regulation 02/M-DAG/PER/1/2007.
31 Minister of Industry and Trade Decree 443/MPP/KEP/5/2002. Enforcement of the ban evidently presented problems, and this led to the enactment of Minister of Trade Regula
-tion 19/M-DAG/PER/4/2007, whose purpose was to improve regula-tion of inter-island trade so as to reduce smuggling.
32 Minister of Trade Regulation 07/M-DAG/PER/4/2005.
33 Minister of Energy and Mineral Resources Regulation 34/2009 and Government Regu
-lation 23/2010.
Subsidies
Also included in our analysis are government subsidies on fuels and fertilisers, which require domestic-trade and export restrictions on the state-owned enter -prises that supply these products.34 The fuel subsidies apply to medium-grade
gasoline, diesel fuel, and kerosene sold by the state-owned oil company, Pertamina, through its gasoline stations. The subsidies are not supposed to go to industrial users of these fuels, and we assign these subsidies to the various IO sectors based on this assumption. We estimate the fuel subsidy at 49.4% at the start of 2008.
Fertiliser subsidies are presumably targeted at small farmers. Our analysis assumes that the subsidies apply fully to all farmers in the various agricultural sectors, but not at all to industrial users of the fertiliser products. We estimate the subsidy rate at 47.1% in early 2008.
To hold down the price of urea and to avoid leakages from the subsidised dis -tribution system, there are non-tariff restrictions on exports of urea fertiliser. We estimate that these restrictions have an ad valorem export tax equivalent of 19.0% for urea sold at presumably non-subsidised prices. This is typical of the lower end of the range of estimates over several decades from Fane and Warr (2008).
Similar controls apply to exports of gasoline and other petroleum-based fuels. A rough comparison of the price of unsubsidised gasoline in Indonesia with that of gasoline in Singapore indicates no price discount in Indonesia, however, so we use an export rate of protection of zero for these fuels.35
We also account for electricity and LPG subsidies to all IO sectors. Our strategy is to obtain a measure of unit costs for both products and of the price charged for large users of these products, and then to aggregate the products based on quanti -ties used to derive an overall subsidy rate for electricity and LPG. We estimate the rate at about 32.8% for January 2008.36
Nominal rates of protection by sector
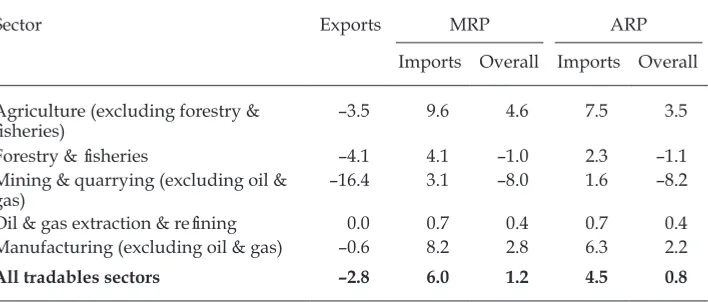
Table 2 shows nominal rates of protection for the broad categories of products given in table 1, with import tariffs, export taxes and non-tariff import and export restraints accounted for. There is a single column for nominal rates of protection on the export side. Nominal rates of protection on the import side for the MRP and ARP composites of all the import tariff schedules are shown, but with non-tariff import policies also factored in. The resultant MRP and ARP versions of the nominal rate of protection on the import side are then combined with the nominal rate of protection on the export side into two alternative measures of the overall nominal rate of protection.
34 The trade restrictions go back at least to 1998, with Minister of Industry and Trade De
-cree 558/MPP/Kep/12/1998. The most recent export policy stipulation along these lines is in Minister of Trade Regulation 01/M-DAG/PER/1/2007.
35 The price of gasoline in Indonesia, with value added tax removed, was slightly higher than the price in Singapore. Singapore price data are daily spot prices for conventional regular gasoline, from the Energy Information Administration, US Department of Energy. 36 Electricity and LPG are aggregated into IO sector 142 (electricity and gas), which we treat as non-tradable. We draw on data from a variety of sources for both products, and can provide details of the data and calculations upon request.
70 Stephen V. Marks and Sjamsu Rahardja
The overall NRPs by broad sector indicate that export restraints, leading to negative nominal rates of protection, predominate in natural resource sectors other than oil and gas. Nominal rates of protection on the import side on average are highest in agriculture. In manufacturing, with exports accounted for, overall NRPs are substantially lower than they are when only the import side is included.
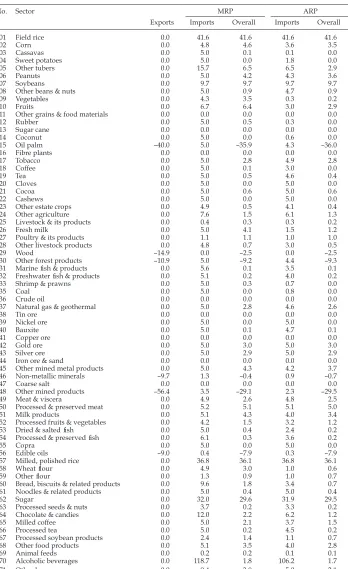
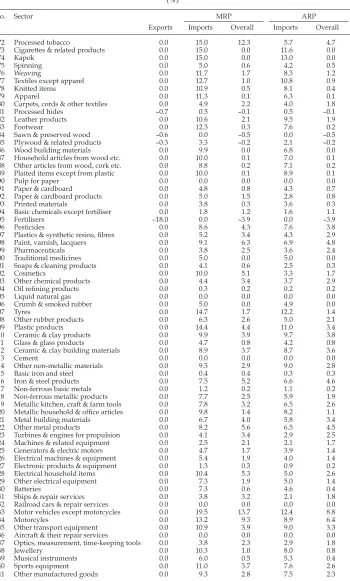
Table 3 uses the same columns as table 2, but provides a more detailed view of nominal rates of protection, by individual IO sectors.37 Certain sectors stand out,
with double-digit rates of protection overall – ield rice (sector 1); milled, polished rice (sector 57); sugar (sector 62); processed tobacco (sector 72); and motor vehi -cles (sector 133). Motorcy-cles (sector 134) are not far behind. We see fairly high rates of import protection in other sectors, such as alcoholic beverages (sector 70); other tubers (sector 5); cigarettes and related products (sector 73); kapok (sector 74); tyres (sector 107); plastic products (sector 109); chocolate and candies (sector 64); textile products (sectors 76–79); and footwear (sector 83). However, most of these sectors are export oriented, so the import tariffs or restraints do not loom so large in the rate of protection overall. Alcoholic beverages is the most prominent case in which one could be concerned that the use of trade weights would under-state the overall rate of protection because of the effect of the high tariff rates on imports.
Negative NRPs overall are evident for oil palm (sector 15); other mined prod -ucts (sector 48); edible oils (sector 56); fertilisers (sector 95); and to a lesser extent other natural-resource-oriented sectors.
Examination of import NRPs indicates tariff escalation in a number of product areas – such as from cocoa beans (sector 21) to cocoa butter and powder (included in sector 64); from wheat lour (sector 58) to bread and biscuits (sector 60); from spinning (sector 75) to various textile products (sectors 76–79); from processed hides (sector 81) to leather products (sector 82) and footwear (sector 83); from pulp (sector 90) to paper and cardboard (sectors 91 and 92); from basic metals (sectors
37 We use the sector numbers used by the government in the 175-sector IO table. Sector 34 is not included in our tables because it consists of non-tradable agricultural services.
TABLE 2 Nominal Rates of Protection, Tariff and Non-Tariff Measures, Early 2008a
(%)
Sector Exports MRP ARP
Imports Overall Imports Overall
Agriculture (excluding forestry &
isheries) –3.5 9.6 4.6 7.5 3.5
Forestry & isheries –4.1 4.1 –1.0 2.3 –1.1
Mining & quarrying (excluding oil &
gas) –16.4 3.1 –8.0 1.6 –8.2
Oil & gas extraction & reining 0.0 0.7 0.4 0.7 0.4
Manufacturing (excluding oil & gas) –0.6 8.2 2.8 6.3 2.2
All tradables sectors –2.8 6.0 1.2 4.5 0.8
a See table 1 for explanation of abbreviations.
115 and 117) to metal products (sectors 116 and 118–122); from rubber (sector 106) to tyres (sector 107); from plastics (sector 97) to plastic products (sector 109); and from basic chemicals (sector 94) to paints (sector 98), cosmetics (sector 102) and other chemical products (sector 103). This escalation is most pronounced in the MFN, ASEAN–China and ASEAN–Korea tariff schedules, but not so much in the ASEAN CEPT schedule, since CEPT rates in general are so low.
Tariff escalation is also evident within certain IO sectors (not shown in table 3). Footwear parts (included in sector 83) have an MFN import tariff rate of 5%, while the rate on most assembled footwear is 20% or 25%. Assembled generators and electric motors (sector 125) have MFN import tariff rates of up to 10%, but parts for these items are duty free. While MFN tariff rates are 40–50% on fully assem -bled motor vehicles (sector 133), rates are more typically 5% or 15% for motor vehicle parts and 15% for knocked-down kits ready for assembly.38
These differences in import tariff rates have an effect for the sector in question similar to that of an input subsidy on its own product, because the user prices for inputs that are also outputs of the sector are set artiicially lower than the supply prices of its inal outputs. Although the differences in MFN tariff rates are stark in some cases, these differences are diluted as one looks at the marginal rate of pro -tection and, especially, at the average rate of pro-tection to account for the gener -ally lower import tariff rates in the preferential tariff schedules. In addition, these differences are diluted further by the use of trade weights, because most products are exported as well as imported. We can provide details to the interested reader upon request.
FINDINGS OF THE ERP ANALYSIS
The overall nominal rates of protection for the MRP and ARP cases, as shown in table 3, feed directly into our ERP calculations. The duty drawbacks and exemp -tions, within-sector import tariff differentials, and subsidies on fuels, fertiliser, electricity and LPG are accounted for in a separate manner that allows the wedge between user prices and supplier prices for the outputs of all sectors to vary sector by sector.39
Findings with all policies included
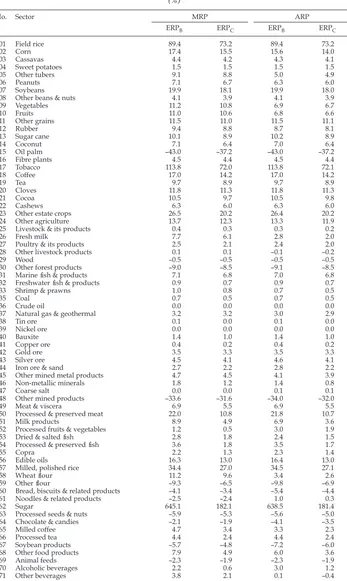
Table 4 presents the basic indings of the ERP analysis. The effects of preferential trade arrangements on rates of protection are summarised by the MRP and the ARP as described above. For each IO sector, and for each of these measures of protection, table 4 shows the effective rate of protection calculated by the Balassa (1982) method (ERPB) and the Corden (1966) method (ERPC). Duty drawbacks and exemptions are assumed to apply at a rate of 80% of the full amount that could be allowed, based on the value of exports by sector, as in Fane and Condon (1996). We assume that only manufacturing – sectors 50 through 141 – can make use of these facilities.
38 Some inished motor vehicles, such as ambulances and specialty trucks, have much lower tariff rates.
39 Details of the effective protection calculations are available from the authors upon re
-quest.
72 Stephen V. Marks and Sjamsu Rahardja
TABLE 3 Nominal Rates of Protection with MRP and ARP Tariff Schedules, Early 2008 (%)
No. Sector MRP ARP
Exports Imports Overall Imports Overall
001 Field rice 0.0 41.6 41.6 41.6 41.6
002 Corn 0.0 4.8 4.6 3.6 3.5
003 Cassavas 0.0 5.0 0.1 0.1 0.0
004 Sweet potatoes 0.0 5.0 0.0 1.8 0.0
005 Other tubers 0.0 15.7 6.5 6.5 2.9
006 Peanuts 0.0 5.0 4.2 4.3 3.6
007 Soybeans 0.0 9.7 9.7 9.7 9.7
008 Other beans & nuts 0.0 5.0 0.9 4.7 0.9
009 Vegetables 0.0 4.3 3.5 0.3 0.2
010 Fruits 0.0 6.7 6.4 3.0 2.9
011 Other grains & food materials 0.0 0.0 0.0 0.0 0.0
012 Rubber 0.0 5.0 0.5 0.3 0.0
013 Sugar cane 0.0 0.0 0.0 0.0 0.0
014 Coconut 0.0 5.0 0.0 0.6 0.0
015 Oil palm –40.0 5.0 –35.9 4.3 –36.0
016 Fibre plants 0.0 0.0 0.0 0.0 0.0
017 Tobacco 0.0 5.0 2.8 4.9 2.8
023 Other estate crops 0.0 4.9 0.5 4.1 0.4
024 Other agriculture 0.0 7.6 1.5 6.1 1.3
025 Livestock & its products 0.0 0.4 0.3 0.3 0.2
026 Fresh milk 0.0 5.0 4.1 1.5 1.2
027 Poultry & its products 0.0 1.1 1.1 1.0 1.0
028 Other livestock products 0.0 4.8 0.7 3.0 0.5
029 Wood –14.9 0.0 –2.5 0.0 –2.5
030 Other forest products –10.9 5.0 –9.2 4.4 –9.3
031 Marine ish & products 0.0 5.6 0.1 3.5 0.1
032 Freshwater ish & products 0.0 5.1 0.2 4.0 0.2
033 Shrimp & prawns 0.0 5.0 0.3 0.7 0.0
035 Coal 0.0 5.0 0.0 0.8 0.0
036 Crude oil 0.0 0.0 0.0 0.0 0.0
037 Natural gas & geothermal 0.0 5.0 2.8 4.6 2.6
038 Tin ore 0.0 0.0 0.0 0.0 0.0
045 Other mined metal products 0.0 5.0 4.3 4.2 3.7
046 Non-metallic minerals –9.7 1.3 –0.4 0.9 –0.7
047 Coarse salt 0.0 0.0 0.0 0.0 0.0
048 Other mined products –56.4 3.5 –29.1 2.3 –29.5
049 Meat & viscera 0.0 4.9 2.6 4.8 2.5
050 Processed & preserved meat 0.0 5.2 5.1 5.1 5.0
051 Milk products 0.0 5.1 4.3 4.0 3.4
052 Processed fruits & vegetables 0.0 4.2 1.5 3.2 1.2
053 Dried & salted ish 0.0 5.0 0.4 2.4 0.2
054 Processed & preserved ish 0.0 6.1 0.3 3.6 0.2
055 Copra 0.0 5.0 0.0 5.0 0.0
056 Edible oils –9.0 0.4 –7.9 0.3 –7.9
057 Milled, polished rice 0.0 36.8 36.1 36.8 36.1
058 Wheat lour 0.0 4.9 3.0 1.0 0.6
059 Other lour 0.0 1.3 0.9 1.0 0.7
060 Bread, biscuits & related products 0.0 9.6 1.8 3.4 0.7
061 Noodles & related products 0.0 5.0 0.4 5.0 0.4
062 Sugar 0.0 32.0 29.6 31.9 29.5
063 Processed seeds & nuts 0.0 3.7 0.2 3.3 0.2
064 Chocolate & candies 0.0 12.0 2.2 6.2 1.2
065 Milled coffee 0.0 5.0 2.1 3.7 1.5
066 Processed tea 0.0 5.0 0.2 4.5 0.2
067 Processed soybean products 0.0 2.4 1.4 1.1 0.7
068 Other food products 0.0 5.1 3.5 4.0 2.8
069 Animal feeds 0.0 0.2 0.2 0.1 0.1
070 Alcoholic beverages 0.0 118.7 1.8 106.2 1.7
071 Other beverages 0.0 9.4 3.8 5.0 2.1
TABLE 3 (cont.) Nominal Rates of Protection with MRP and ARP Tariff Schedules, Early 2008 (%)
No. Sector MRP ARP
Exports Imports Overall Imports Overall
072 Processed tobacco 0.0 15.0 12.3 5.7 4.7
073 Cigarettes & related products 0.0 15.0 0.0 11.6 0.0
074 Kapok 0.0 15.0 0.0 13.0 0.0
075 Spinning 0.0 5.0 0.6 4.2 0.5
076 Weaving 0.0 11.7 1.7 8.3 1.2
077 Textiles except apparel 0.0 12.7 1.0 10.8 0.9
078 Knitted items 0.0 10.9 0.5 8.1 0.4
079 Apparel 0.0 11.3 0.1 6.3 0.1
080 Carpets, cords & other textiles 0.0 4.9 2.2 4.0 1.8
081 Processed hides –0.7 0.5 –0.1 0.5 –0.1
082 Leather products 0.0 10.6 2.1 9.5 1.9
083 Footwear 0.0 12.3 0.3 7.6 0.2
084 Sawn & preserved wood –0.6 0.0 –0.5 0.0 –0.5
085 Plywood & related products –0.3 3.3 –0.2 2.1 –0.2
086 Wood building materials 0.0 9.9 0.0 6.8 0.0
087 Household articles from wood etc. 0.0 10.0 0.1 7.0 0.1
088 Other articles from wood, cork etc. 0.0 8.8 0.2 7.1 0.2
089 Plaited items except from plastic 0.0 10.0 0.1 8.9 0.1
090 Pulp for paper 0.0 0.0 0.0 0.0 0.0
091 Paper & cardboard 0.0 4.8 0.8 4.3 0.7
092 Paper & cardboard products 0.0 5.0 1.5 2.8 0.8
093 Printed materials 0.0 3.8 0.3 3.6 0.3
094 Basic chemicals except fertiliser 0.0 1.8 1.2 1.6 1.1
095 Fertilisers –18.0 0.0 –3.9 0.0 –3.9
096 Pesticides 0.0 8.6 4.3 7.6 3.8
097 Plastics & synthetic resins, ibres 0.0 5.2 3.4 4.3 2.9
098 Paint, varnish, lacquers 0.0 9.1 6.3 6.9 4.8
099 Pharmaceuticals 0.0 3.8 2.5 3.6 2.4
100 Traditional medicines 0.0 5.0 0.0 5.0 0.0
101 Soaps & cleaning products 0.0 4.1 0.6 2.5 0.3
102 Cosmetics 0.0 10.0 5.1 3.3 1.7
103 Other chemical products 0.0 4.4 3.4 3.7 2.9
104 Oil reining products 0.0 0.3 0.2 0.2 0.2
105 Liquid natural gas 0.0 0.0 0.0 0.0 0.0
106 Crumb & smoked rubber 0.0 5.0 0.0 4.9 0.0
107 Tyres 0.0 14.7 1.7 12.2 1.4
108 Other rubber products 0.0 6.3 2.6 5.0 2.1
109 Plastic products 0.0 14.4 4.4 11.0 3.4
110 Ceramic & clay products 0.0 9.9 3.9 9.7 3.8
111 Glass & glass products 0.0 4.7 0.8 4.2 0.8
112 Ceramic & clay building materials 0.0 8.9 3.7 8.7 3.6
113 Cement 0.0 0.0 0.0 0.0 0.0
114 Other non-metallic materials 0.0 9.5 2.9 9.0 2.8
115 Basic iron and steel 0.0 0.4 0.4 0.3 0.3
116 Iron & steel products 0.0 7.5 5.2 6.6 4.6
117 Non-ferrous basic metals 0.0 1.2 0.2 1.1 0.2
118 Non-ferrous metallic products 0.0 7.7 2.5 5.9 1.9
119 Metallic kitchen, craft & farm tools 0.0 7.8 3.2 6.5 2.6
120 Metallic household & ofice articles 0.0 9.8 1.4 8.2 1.1
121 Metal building materials 0.0 6.7 4.0 5.8 3.4
122 Other metal products 0.0 8.2 5.6 6.5 4.5
123 Turbines & engines for propulsion 0.0 4.1 3.4 2.9 2.5
124 Machines & related equipment 0.0 2.5 2.1 2.1 1.7
125 Generators & electric motors 0.0 4.7 1.7 3.9 1.4
126 Electrical machines & equipment 0.0 5.4 1.9 4.0 1.4
127 Electronic products & equipment 0.0 1.3 0.3 0.9 0.2
128 Electrical household items 0.0 10.4 5.3 5.0 2.6
129 Other electrical equipment 0.0 7.3 1.9 5.0 1.4
130 Batteries 0.0 7.3 0.6 4.6 0.4
131 Ships & repair services 0.0 3.8 3.2 2.1 1.8
132 Railroad cars & repair services 0.0 0.0 0.0 0.0 0.0
133 Motor vehicles except motorcycles 0.0 19.5 13.7 12.4 8.8
134 Motorcyles 0.0 13.2 9.3 8.9 6.4
135 Other transport equipment 0.0 10.9 3.9 9.0 3.3
136 Aircraft & their repair services 0.0 0.0 0.0 0.0 0.0
137 Optics, measurement, time-keeping tools 0.0 3.8 2.3 2.9 1.8
138 Jewellery 0.0 10.3 1.0 8.0 0.8
139 Musical instruments 0.0 6.0 0.5 5.3 0.4
140 Sports equipment 0.0 11.0 3.7 7.6 2.6
141 Other manufactured goods 0.0 9.3 2.8 7.5 2.3
74 Stephen V. Marks and Sjamsu Rahardja
TABLE 4 Effective Rates of Protection, All Policies in Effect, Early 2008 (%)
No. Sector MRP ARP
ERPB ERPC ERPB ERPC
001 Field rice 89.4 73.2 89.4 73.2
002 Corn 17.4 15.5 15.6 14.0
003 Cassavas 4.4 4.2 4.3 4.1
004 Sweet potatoes 1.5 1.5 1.5 1.5
005 Other tubers 9.1 8.8 5.0 4.9
006 Peanuts 7.1 6.7 6.3 6.0
007 Soybeans 19.9 18.1 19.9 18.0
008 Other beans & nuts 4.1 3.9 4.1 3.9
009 Vegetables 11.2 10.8 6.9 6.7
010 Fruits 11.0 10.6 6.8 6.6
011 Other grains 11.5 11.0 11.5 11.1
012 Rubber 9.4 8.8 8.7 8.1
013 Sugar cane 10.1 8.9 10.2 8.9
014 Coconut 7.1 6.4 7.0 6.4
015 Oil palm –43.0 –37.2 –43.0 –37.2
016 Fibre plants 4.5 4.4 4.5 4.4
017 Tobacco 113.8 72.0 113.8 72.1
023 Other estate crops 26.5 20.2 26.4 20.2
024 Other agriculture 13.7 12.3 13.3 11.9
025 Livestock & its products 0.4 0.3 0.3 0.2
026 Fresh milk 7.7 6.1 2.8 2.0
027 Poultry & its products 2.5 2.1 2.4 2.0
028 Other livestock products 0.1 0.1 –0.1 –0.2
029 Wood –0.5 –0.5 –0.5 –0.5
030 Other forest products –9.0 –8.5 –9.1 –8.5
031 Marine ish & products 7.1 6.8 7.0 6.8
032 Freshwater ish & products 0.9 0.7 0.9 0.7
033 Shrimp & prawns 1.0 0.8 0.7 0.5
035 Coal 0.7 0.5 0.7 0.5
036 Crude oil 0.0 0.0 0.0 0.0
037 Natural gas & geothermal 3.2 3.2 3.0 2.9
038 Tin ore 0.1 0.0 0.1 0.0
045 Other mined metal products 4.7 4.5 4.1 3.9
046 Non-metallic minerals 1.8 1.2 1.4 0.8
047 Coarse salt 0.0 0.0 0.1 0.1
048 Other mined products –33.6 –31.6 –34.0 –32.0
049 Meat & viscera 6.9 5.5 6.9 5.5
050 Processed & preserved meat 22.0 10.8 21.8 10.7
051 Milk products 8.9 4.9 6.9 3.6
052 Processed fruits & vegetables 1.2 0.5 3.0 1.9
053 Dried & salted ish 2.8 1.8 2.4 1.5
054 Processed & preserved ish 3.6 1.8 3.5 1.7
055 Copra 2.2 1.3 2.3 1.4
056 Edible oils 16.3 13.0 16.4 13.0
057 Milled, polished rice 34.4 27.0 34.5 27.1
058 Wheat lour 11.2 9.6 3.4 2.6
059 Other lour –9.3 –6.5 –9.8 –6.9
060 Bread, biscuits & related products –4.1 –3.4 –5.4 –4.4
061 Noodles & related products –2.5 –2.4 1.0 0.3
062 Sugar 645.1 182.1 638.5 181.4
063 Processed seeds & nuts –5.9 –5.3 –5.6 –5.0
064 Chocolate & candies –2.1 –1.9 –4.1 –3.5
065 Milled coffee 4.7 3.4 3.3 2.3
066 Processed tea 4.4 2.4 4.4 2.4
067 Soybean products –5.7 –4.8 –7.2 –6.0
068 Other food products 7.9 4.9 6.0 3.6
069 Animal feeds –2.3 –1.9 –2.3 –1.9
070 Alcoholic beverages 2.2 0.6 3.0 1.2
071 Other beverages 3.8 2.1 0.1 –0.4
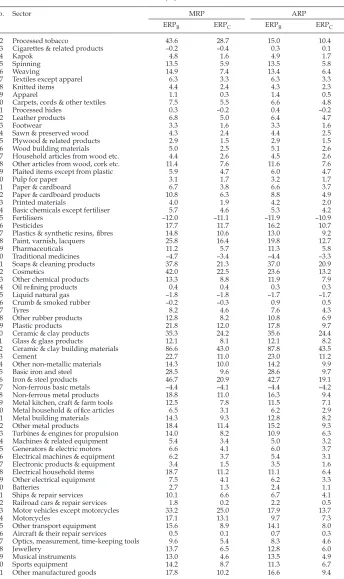
TABLE 4 (cont.) Effective Rates of Protection, All Policies in Effect, Early 2008 (%)
No. Sector MRP ARP
ERPB ERPC ERPB ERPC
072 Processed tobacco 43.6 28.7 15.0 10.4
073 Cigarettes & related products –0.2 –0.4 0.3 0.1
074 Kapok 4.8 1.6 4.9 1.7
075 Spinning 13.5 5.9 13.5 5.8
076 Weaving 14.9 7.4 13.4 6.4
077 Textiles except apparel 6.3 3.3 6.3 3.3
078 Knitted items 4.4 2.4 4.3 2.3
079 Apparel 1.1 0.3 1.4 0.5
080 Carpets, cords & other textiles 7.5 5.5 6.6 4.8
081 Processed hides 0.3 –0.2 0.4 –0.2
082 Leather products 6.8 5.0 6.4 4.7
083 Footwear 3.3 1.6 3.3 1.6
084 Sawn & preserved wood 4.3 2.4 4.4 2.5
085 Plywood & related products 2.9 1.5 2.9 1.5
086 Wood building materials 5.0 2.5 5.1 2.6
087 Household articles from wood etc. 4.4 2.6 4.5 2.6
088 Other articles from wood, cork etc. 11.4 7.6 11.6 7.6
089 Plaited items except from plastic 5.9 4.7 6.0 4.7
090 Pulp for paper 3.1 1.7 3.2 1.7
091 Paper & cardboard 6.7 3.8 6.6 3.7
092 Paper & cardboard products 10.8 6.3 8.8 4.9
093 Printed materials 4.0 1.9 4.2 2.0
094 Basic chemicals except fertiliser 5.7 4.6 5.3 4.2
095 Fertilisers –12.0 –11.1 –11.9 –10.9
096 Pesticides 17.7 11.7 16.2 10.7
097 Plastics & synthetic resins, ibres 14.8 10.6 13.0 9.2
098 Paint, varnish, lacquers 25.8 16.4 19.8 12.7
099 Pharmaceuticals 11.2 5.7 11.3 5.8
100 Traditional medicines –4.7 –3.4 –4.4 –3.3
101 Soaps & cleaning products 37.8 21.3 37.0 20.9
102 Cosmetics 42.0 22.5 23.6 13.2
103 Other chemical products 13.3 8.8 11.9 7.9
104 Oil reining products 0.4 0.4 0.3 0.3
105 Liquid natural gas –1.8 –1.8 –1.7 –1.7
106 Crumb & smoked rubber –0.2 –0.3 0.9 0.5
107 Tyres 8.2 4.6 7.6 4.3
108 Other rubber products 12.8 8.2 10.8 6.9
109 Plastic products 21.8 12.0 17.8 9.7
110 Ceramic & clay products 35.3 24.2 35.6 24.4
111 Glass & glass products 12.1 8.1 12.1 8.2
112 Ceramic & clay building materials 86.6 43.0 87.8 43.5
113 Cement 22.7 11.0 23.0 11.2
114 Other non-metallic materials 14.3 10.0 14.2 9.9
115 Basic iron and steel 28.5 9.6 28.6 9.7
116 Iron & steel products 46.7 20.9 42.7 19.1
117 Non-ferrous basic metals –4.4 –4.1 –4.4 –4.2
118 Non-ferrous metal products 18.8 11.0 16.3 9.4
119 Metal kitchen, craft & farm tools 12.5 7.8 11.5 7.1
120 Metal household & ofice articles 6.5 3.1 6.2 2.9
121 Metal building materials 14.3 9.3 12.8 8.2
122 Other metal products 18.4 11.4 15.2 9.3
123 Turbines & engines for propulsion 14.0 8.2 10.9 6.3
124 Machines & related equipment 5.4 3.4 5.0 3.2
125 Generators & electric motors 6.6 4.1 6.0 3.7
126 Electrical machines & equipment 6.2 3.7 5.4 3.1
127 Electronic products & equipment 3.4 1.5 3.5 1.6
128 Electrical household items 18.7 11.2 11.1 6.4
129 Other electrical equipment 7.5 4.1 6.2 3.3
130 Batteries 2.7 1.3 2.4 1.1
131 Ships & repair services 10.1 6.6 6.7 4.1
132 Railroad cars & repair services 1.8 0.2 2.2 0.5
133 Motor vehicles except motorcycles 33.2 25.0 17.9 13.7
134 Motorcycles 17.1 13.1 9.7 7.3
135 Other transport equipment 15.6 8.9 14.1 8.0
136 Aircraft & their repair services 0.5 0.1 0.7 0.3
137 Optics, measurement, time-keeping tools 9.6 5.4 8.3 4.6
138 Jewellery 13.7 6.5 12.8 6.0
139 Musical instruments 13.0 4.6 13.5 4.9
140 Sports equipment 14.2 8.7 11.3 6.7
141 Other manufactured goods 17.8 10.2 16.6 9.4
76 Stephen V. Marks and Sjamsu Rahardja
In most cases, the Corden method, which measures the proportionate change in value added in the sector in question, and in all the non-tradables sectors that contribute directly and indirectly to it, yields a measure of effective protection lower in absolute value than that yielded by the Balassa method, particularly if the Balassa method implies a high level of effective protection. This is consistent with previous indings on Indonesia by Warr (1992).
ERPs are relatively high for a number of agriculture-oriented sectors, such as sugar (sector 62); tobacco (sector 17); ield rice (sector 1); processed tobacco (sector 72); and milled, polished rice (sector 57).
Also noteworthy are the relatively high ERPs for ceramic and clay building materials (sector 112); soaps and cleaning products (sector 101); iron and steel products (sector 116); ceramic and clay products (sector 110); motor vehicles (sec-tor 133); and cosmetics (sec(sec-tor 102). The most highly negative ERPs apply to oil palm (sector 15); other mined products (sector 48); and fertilisers (sector 95). A negative NRP for edible oils (sector 56) is overcome by the high export tax rates on palm fresh fruit bunches and palm kernels in the oil palm sector, such that edible oils end up with one of the higher ERPs.
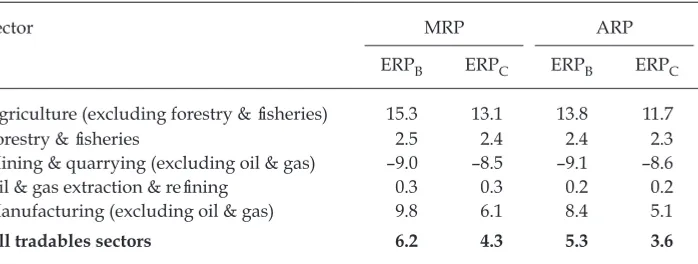
Table 5 summarises for broad sectors the effective rates of protection shown in table 4, using IO-sector value added weights (see footnote 11). Agriculture has the highest ERP, followed by non-oil and gas manufacturing. Among the resource-based sectors, the ERP is negative for mining and quarrying, close to zero for oil and gas, and slightly positive for forestry and isheries.
Some complications
It is important to point out some complications related to two agribusiness sec -tors, sugar (sector 62) and palm oil (the dominant industry in sector 56).
In the case of sugar, high transport costs and the rapid diminution of sugar content after the cane is harvested, as well as contractual ties between sugar cane growers and local sugar factories, render sugar cane (sector 13) largely non-tradable internationally. There is a relatively small amount of trade in sugar cane, however, and we do include it among the tradable commodity sectors. Its sta -tus as a nominally tradable commodity does not mean in practice that its price is locked in by international commodity arbitrage. In particular, the contractual
TABLE 5 Effective Rates of Protection, All Policies in Effect, Early 2008a
(%)
Sector MRP ARP
ERPB ERPC ERPB ERPC
Agriculture (excluding forestry & isheries) 15.3 13.1 13.8 11.7
Forestry & isheries 2.5 2.4 2.4 2.3
Mining & quarrying (excluding oil & gas) –9.0 –8.5 –9.1 –8.6
Oil & gas extraction & reining 0.3 0.3 0.2 0.2
Manufacturing (excluding oil & gas) 9.8 6.1 8.4 5.1
All tradables sectors 6.2 4.3 5.3 3.6
a See table 1 for explanation of abbreviations.
arrangements between state-owned sugar factories and independent cane grow -ers on Java pass on some of the gains of the protected sugar price to cane grow-ers, to induce farmers to grow more cane and less of alternative crops. To some extent, then, the ERP for sugar is over-stated, and that for sugar cane is under-stated.
Similarly, in the case of palm oil, the fresh fruit bunches harvested from oil palm trees to produce crude palm oil spoil within days if not processed, and oil palm growers have contractual ties to local crude palm oil factories. Thus the fresh fruit bunches, although tradable to some extent, and classiied as such in our analysis, in practice are more or less non-tradable. For this reason the oficial export tax rate of 40% may exceed the export tax that would be prohibitive in most locations. Moreover, the contractual arrangements between oil palm growers and the crude palm oil factories compensate the farmers based on the prices of crude palm oil and crude palm kernel oil, both subject to relatively low export tax rates.40 The
magnitude of both the negative ERP for the oil palm sector (15) and the positive ERP for the edible oils sector (56) in table 4 may therefore be over-stated.
For both sugar and palm oil, the general message is clear: many important institutional details are dificult to capture in a broad-gauge study such as an effective protection analysis or, for that matter, a computable general equilibrium analysis.
Some alternative policy scenarios
Table 4 reveals that ERPs are high in a number of sectors for which the NRP, as indicated in table 3, is low. Examples include tobacco (sector 17); coffee (sector 18); other estate crops (sector 23); other agriculture (sector 24); ceramic and clay products (sector 110); and ceramic and clay building materials (sector 112). This raises a question about the extent to which these high effective rates of support are attributable to subsidies.
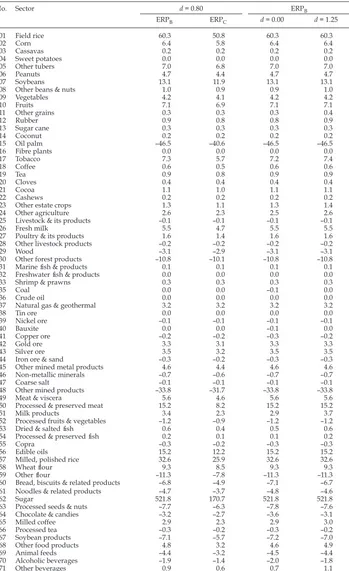
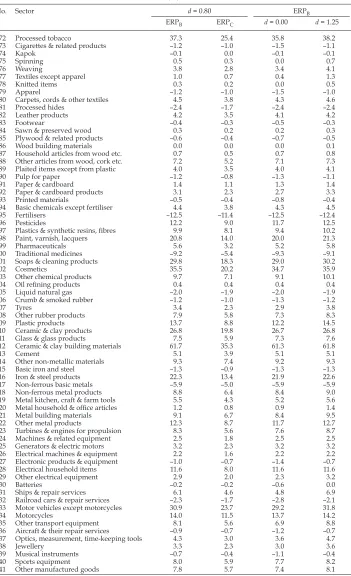
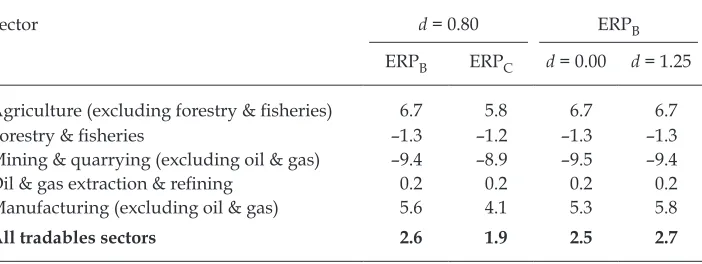
Table 6 provides an answer. All of the ERPs shown in the table are calculated with the various subsidies omitted and using the marginal rate of protection as the composite measure of import protection. The irst two columns of the table con -tinue to assume that exporters are able to recover duty drawbacks and exemptions on 80% of the value of their exports (we use a parameter d = 0.80 to indicate this), and show the Balassa and Corden calculations (ERPB andERPC), respectively.
Comparison of the irst two columns of table 4 and table 6 indicates that, for all of the agricultural sectors just mentioned, effective rates of support are much lower once the effects of the subsidies are omitted. In addition, the effective rate of support for basic iron and steel (sector 115) is much lower after removal of the electricity subsidy in particular, and the effective rate of support for ield rice (sec -tor 1) is similarly lower after removal of the fertiliser subsidy.
The effective rate of support for sugar (sector 62) is also reduced considera -bly by removal of the subsidies. Table 7, which shows ERPB with the subsidies removed one by one, shows that most of the support for sugar comes from the electricity subsidy, but some comes from the fuel and fertiliser subsidies.41
40 Maryadi, Yusuf and Mulyana (2004) discuss how these contractual arrangements work in South Sumatra, as part of a policy analysis matrix study.
41 The fuel subsidy does not accrue directly to the sugar sector, but instead comes primar
-ily through its use of road transport services.