Full Terms & Conditions of access and use can be found at
http://www.tandfonline.com/action/journalInformation?journalCode=vjeb20
Download by: [Universitas Maritim Raja Ali Haji] Date: 11 January 2016, At: 22:03
Journal of Education for Business
ISSN: 0883-2323 (Print) 1940-3356 (Online) Journal homepage: http://www.tandfonline.com/loi/vjeb20
The Gender Gap in Undergraduate Business
Programs in the United States
Jennifer Ann Ball
To cite this article: Jennifer Ann Ball (2012) The Gender Gap in Undergraduate Business Programs in the United States, Journal of Education for Business, 87:5, 260-265, DOI: 10.1080/08832323.2011.617792
To link to this article: http://dx.doi.org/10.1080/08832323.2011.617792
Published online: 05 Jun 2012.
Submit your article to this journal
Article views: 232
View related articles
ISSN: 0883-2323 print / 1940-3356 online DOI: 10.1080/08832323.2011.617792
The Gender Gap in Undergraduate Business
Programs in the United States
Jennifer Ann Ball
Washburn University, Topeka, Kansas, USA
In the last several years there has been much scholarship in the area of the reverse gender gap in colleges and universities, as there have been more women than men attending and graduating from colleges and universities since the early 1980s. Little if any scholarship exists about students and recent graduates from undergraduate business programs specifically, so the topic is explored here. Included are patterns among the majors and emphases in business programs, and a logit model with choice of business major as the dependent variable. Findings include the odds are greater a student will choose business as a major if the student is a man, has parents with lower levels of education, has higher family income, had a higher GPA in high school, and did not earn advanced placement credit in high school. The findings show there are differences in the behavior of female and male students regarding choice of business major.
Keywords: business education, college major choice, gender gap
Goldin, Katz, and Kuziemko (2006) pointed out the in-crease in women’s postsecondary degree attainment relative to men’s is actually a homecoming for women. That is, from 1900 to 1930 men and women attended postsecondary insti-tutions at about the same rate, such that the ratio of men to women enrolled was around one during this time. The in-crease in relative male enrollments began in the 1930s and continued until after World War II. At its height in 1947, the male-to-female enrollment ratio was 2.3. After that year, women started to catch up with men, reaching parity again in the early 1980s (Goldin et al.). Now, according to the U.S. Bureau of Labor Statistics (2010), of the high school graduates in 2009 who went to postsecondary schools, 56% were women and 44% were men. The percentage of female high school graduates enrolling was 46% compared with male high school graduates’ 36%. Degree attainment (for all degrees and for bachelor’s degrees) was at the same propor-tions as enrollments, according to the U.S. Department of Education (2010a).
It is important to note the percentage of the male and fe-male population partaking of postsecondary education has increased tremendously since 1940. According to the Na-tional Center for Education Statistics (2010), the percentage
Correspondence should be addressed to Jennifer Ann Ball, Washburn University, School of Business, 1700 SW College Avenue, Topeka, KS 66621, USA. E-mail: [email protected]
of 18- and 19-year-olds enrolled in school was 28.9% in 1940, compared with 66.8% in 2007. This indicates women are not increasing their enrollment in postsecondary institutions at the expense of men, but the growth of female enrollment is faster than that of men. This growth has not occurred primar-ily due to changes in the mix of students’ ethnicity, type of postsecondary institutions, or students’ socioeconomic back-ground, but across all races, socioeconomic backgrounds, and types of postsecondary institutions. In fact, thereverse gender gap, as it has been referred to, is not only occurring in the United States, but in almost all Organization for Eco-nomic Cooperation and Development countries (Buchman & DiPrete, 2006; Goldin et al., 2006).
Goldin et al. (2006) noted that girls have always, since data have been available, done better than boys in high school by class rankings. So the question becomes, what changed af-ter World War II that made women more likely to pursue postsecondary education? These researchers suggested three things: (a) an increase the percentage of girls age 14–18 years who expected to be working at age 35 years, (b) an increase in the age of first marriage, and (c) the greater behavioral problems of boys. The first two reasons obviously increase young women’s attachment to the labor force, providing in-centive for them to pursue more education. The third reason is less clear. Has it ever been the case that boys and girls had similar rates of behavioral problems? Boys do have higher rates of attention deficit hyperactivity disorder and crimi-nal activity, but the idea that this has changed substantially
THE GENDER GAP IN BUSINESS PROGRAMS 261
relative to girls in the last few decades is questionable. Buch-mann and DiPrete suggested another reason for women’s increased interest in higher education—faster growing re-turns to higher education for women than for men over the last several decades as women entered fields considered non-traditional for them until recently. These authors also pointed out that the reverse gender gap is largest among families with less educated or absent fathers, so the rise in the number of female-headed households is also a contributing factor.
Other scholarship on the topic of gender and higher edu-cation centers on major choice. Although women have now reversed the gender gap in attainment of bachelor’s degrees, Staniec (2004) observed they still are underrepresented in science, math, and engineering (SME). Staniec also found that a significant reason for this underrepresentation is lower expected returns to these majors for women, and that once these lower returns are accounted for, the female dummy is no longer statistically significant in a model of college ma-jor choice. On the other hand, Morgan (2008) found within-major pay penalties are virtually zero in SME for recent grad-uates (the sample is from 1990 and 1993 of 1988–89 college graduates). Morgan also found most of the wage gap by gen-der in recent graduates is driven by two general studies fields: social science-humanities and business administration (other than accounting), and that most of the gap in these fields can be explained by the different types of jobs women and men in these areas take after college (or job characteristics).
In this work, trends in the gender mix of students in busi-ness programs over the last two decades were explored to see if they reflect the overall changes in college enrollments, or if they are significantly different. Also of interest was to what extent these trends may be driven by changes in the gender mix of particular emphases in business, such as ac-counting or finance. A logit model of major choice was also presented to provide insight into the characteristics of stu-dents who choose business over other majors. The purpose of this research was to introduce evidence that business en-rollments are becoming a smaller proportion of all college degrees, and a substantial reason for this is the behavior of female students. The logit model showed women are sub-stantially less likely to choose business as a major than men. It also indicates other characteristics of business majors that suggest the trend of relatively smaller business programs is likely to continue. If business educators believe they offer a valuable education and graduates of business programs are important to society, these educators may need to ask them-selves how they can better serve the new mix of potential business students.
TRENDS
Data for overall trends were retrieved from the Integrated Postsecondary Education Data System (IPEDS) at the U.S. Department of Education’s Institute of Education Sciences
National Center for Education Statistics (U.S. Department of Education, 2010a). Annual bachelor degree completions from 1987–2009 were gathered from 4,543 colleges and uni-versities in the United States. Each of these colleges and universities were in the dataset for the entire period, but the degrees and majors offered at some of the institutions changed over the period. For example, of these 4,543 col-leges and universities, 1,602 offered bachelor’s degrees and 1,244 offered at least one business degree in 1987 whereas 2,009 offered bachelor’s degrees and 1,598 offered at least one business degree in 2009.
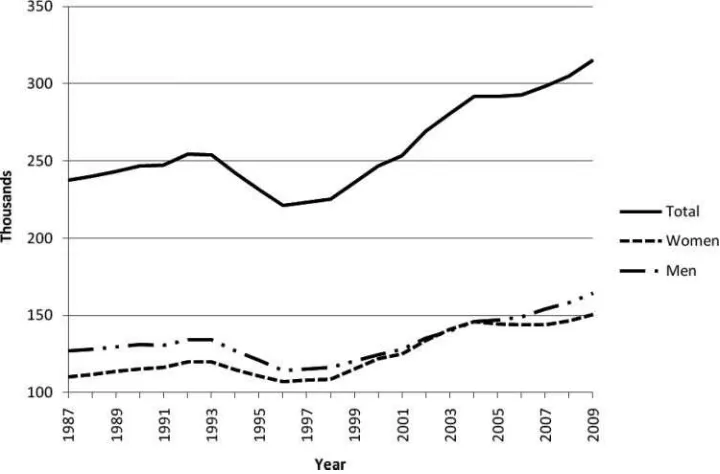
In 1987, there were about 973,000 bachelor’s degrees awarded from these institutions, of which about 237,000 were business degrees. By 2009, this number had increased about 58% for all bachelor’s degrees to around 1,534,500, of which about 315,000 were business degrees (an increase of 33%). The increase in the number of women complet-ing a bachelor’s degree was 75%, whereas the increase in the number of men was only 38% (Figure 1). As for business degrees, there was a 37% increase in the num-ber of women attaining a degree, and an increase of 29% for men (Figure 2). So, although women outpaced men in attaining any bachelor’s degree and in business degrees, the increase was smaller for business degrees (Figure 3). From 1987 to 2009, the percentage of all bachelor’s de-grees being earned by women increased from 51% to 57%, whereas for business degrees the increase was only two percentage points, from 46% to 48% (all percentages are approximates).
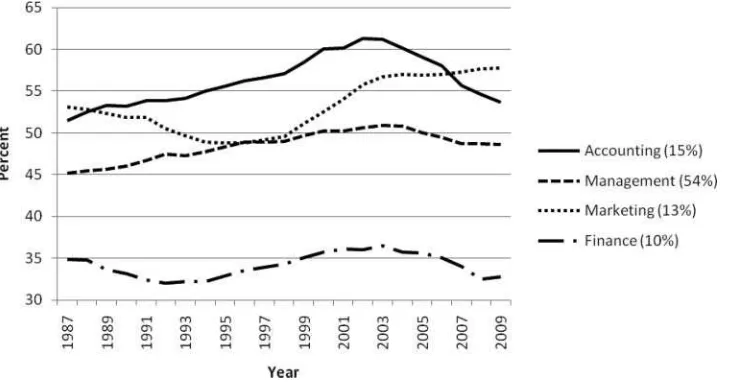
This may be surprising because some important subdis-ciplines in business have become more female-dominated in the last couple of decades. However, as a percentage of all business degrees, the more heavily female subdisciplines have become smaller over the past 20 years. Regarding the percentage of degrees earned by females, the subdisciplines that most closely mirror the changes in all degrees are ac-counting and marketing (Figure 4). In 1987, both of these subdisciplines were majority female, 51% and 53% respec-tively, and these majorities increased over the twenty years, to 56% and 58%. However, both of these subdisciplines be-came smaller percentages of all business degrees, dropping from 18% to 14% in the case of accounting, and from 14% to 12% in the case of marketing. Therefore, although the female percentage of these areas increased, the decrease in these subdisciplines as a percentage of all business degrees actually represents a net loss to the percentage of all business degrees going to women.
Management, on the other hand, increased both its share of all business degrees, and became more heavily female. In 1987, the management degrees were 51% of all business degrees; by 2009 this percentage had increased to 58%. In the same time period, the percentage of management degrees completed by women increased from 45% to 49%. Looking more deeply into the areas of management, the biggest gains for women came in international business, human resources,
FIGURE 1 Bachelor’s degree completions, 1987–2009 (calculated from Integrated Postsecondary Education Data System [U.S. Department of Education, 2010a]).
and hospitality. All of these areas are majority female, and international business and human resources also became a larger share of all business degrees. Hospitality stayed about constant as a percentage of business degrees, but became much more female-dominated (from 54% to 60% female). Putting all of this together, it is possible to see that the in-crease in the percentage of women earning business degrees has been almost entirely driven by changes in the manage-ment category of business degrees.
In this period business programs have drawn women at a slower rate than the average for all bachelor’s degrees, but they have also drawn men at a lower rate than for all bach-elor’s degrees. As a percentage of all bachbach-elor’s degrees, business degrees fell by almost five percentage points for women and by more than two percentage points for men (U.S. Department of Education, 2010a). From a utility max-imization or revealed preferences perspective, this is not a problem. Young people make their choices based on their
FIGURE 2 Business degree completions, 1987–2009 (calculated from Integrated Postsecondary Education Data System [U.S. Department of Education, 2010a]).
THE GENDER GAP IN BUSINESS PROGRAMS 263
FIGURE 3 Percentage of degrees granted to women, 1987–2009 (calculated from Integrated Postsecondary Education Data System [U.S. Department of Education, 2010a]).
family backgrounds, their academic strengths, their expected returns, and how important money is to them. From the per-spective of business educators, however, this trend may not be desirable. Perhaps these educators should ask themselves what can be done to appeal to a greater proportion of college students in the future.
A MODEL OF MAJOR CHOICE
It may therefore be informative to explore the characteristics of students who choose business as a major in college compared to students who choose other majors. To this end a logit model was estimated using Baccalaureate and Beyond 2000–2001 data (U.S. Department of Education, 2010b). The Baccalaureate and Beyond Longitudinal Study is a nationally representative sample of graduating
seniors administered by the U.S. Department of Education. The 2000 cohort (which was interviewed again in 2001) comprised about 10,000 students.
All variables in the model were binaries, and the per-centage of students in each category is noted in parentheses following the category. The dependent variable was the stu-dent’s college MAJOR, which was coded 1 if the student is a business major (11.5%) and 0 if another major (88.5%). The independent variables were the following: GENDER, which was 1 if female (62%), and 0 if male (38%); RACE had coded categories of 1 for Black (8%), Asian (5%), Latino (3%), and other non-White (6%), with White (79%) as the omit-ted variable; PRIMARY LANGUAGE was coded 1 if a lan-guage other than English was the first lanlan-guage of the student (8%), 0 if English was the first language (92%); PARENTS’ HIGHEST EDUCATION LEVEL had coded categories of 1 for no high school diploma (4%), high school diploma
FIGURE 4 Percentage of degrees granted to women by business subdiscipline, 1987–2009. Following the subdiscipline’s label is its average percentage of all business degrees in 2007–2009 (U.S. Department of Education [2010a]).
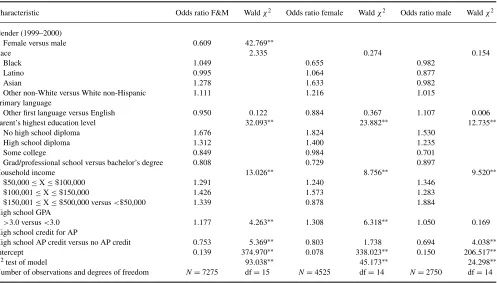
TABLE 1
Logit Regression Results: College Major Choice, Class of 2000 (N=7,275)
Characteristic Odds ratio F&M Waldχ2 Odds ratio female Waldχ2 Odds ratio male Waldχ2
Gender (1999–2000)
Other non-White versus White non-Hispanic 1.111 1.216 1.015
Primary language
Grad/professional school versus bachelor’s degree 0.808 0.729 0.897
Household income 13.026∗∗ 8.756∗∗ 9.520∗∗
High school credit for AP
High school AP credit versus no AP credit 0.753 5.369∗∗ 0.803 1.738 0.694 4.038∗∗
Intercept 0.139 374.970∗∗ 0.078 338.023∗∗ 0.150 206.517∗∗
χ2test of model 93.038∗∗ 45.173∗∗ 24.298∗∗
Number of observations and degrees of freedom N=7275 df=15 N=4525 df=14 N=2750 df=14
Note.Dependent variable was 1 if major was business and 0 if another major. Source: U.S. Department of Education (2010b). AP=advanced placement; GPA=grade point average.
∗p=.05.∗∗p=.01.
(23%), some college (22%), and graduate or professional school (27%), with bachelor’s degree (24%) as the omitted category; and HOUSEHOLD INCOME was the total income of the student’s household, whether the student is a depen-dent, coded as 1 in categories of $50,000–100,000 (31%)
and$100,001–150,000 (10%), and more than$150,001 (4%)
where less than$50,000 (54%) was the omitted category; a
grade point average (GPA)AorBwas coded 1 if the student had a high school GPA of B or better (30%) and 0 if not (70%); and AP CREDIT was coded 1 if the student had ad-vanced placement (AP) credit in high school (13%), and 0 if not (87%). The model was also estimated for female students only and male students only. The results are shown in Table 1.
DISCUSSION
As seen in Table 1, the odds a female student would be a business major were about 40% lower than the odds a male student would be a business major. The odds ratios regarding race are not statistically significant, although it did appear that the odds an Asian woman would choose business as a major are substantially greater than those of a White woman. The odds ratios for English as a second language are not statistically significant. Regarding parents’ education, it
appears there was a general negative relationship between the level of the parents’ education and the odds a student would choose business as a major (the only exception being that a male student with parents who had some college would be less likely to choose business as a major than a student with parents with a bachelor’s degree). This effect was somewhat stronger for women than for men. For male students, the odds a student would be a business major were increased if the family income was above average (average income in this sample was about $55,000). For female students, this
was true up until a family income of $150,000, but then
the odds decreased. Interestingly, the two proxies for high school success pointed to another difference in female and male students. Although the odds a female student would choose business as a major were about 30% higher if she had a high school GPA of 3.0 or greater, this was not true of male students. On the other hand, the odds a male student would choose business a major were about 30% lower if he had AP credit in high school, although this may not be true of female students (the coefficient is less than 1, but it is not statistically significant for women).
Of course these findings are only descriptive, but a few implications stand out. The combined effect of women becoming a larger percentage of college students and their being less likely than men to choose business as a major
THE GENDER GAP IN BUSINESS PROGRAMS 265
explains part of the decrease in the relative size of busi-ness programs. Also, if (especially) female students are less likely to choose business as a major when their parents have higher levels of education, the trend of a greater percent-age of Americans attaining college and professional degrees (U.S. Census Bureau, 2011a) also helps explain why fewer students are choosing business as a major. Similarly, students with advanced placement credit appear to be less likely to choose business as a major and the percentage of high school students sitting for AP exams each year has increased from about 2% in 1987 to about 10% in 2009 (College Board, 2009; U.S. Census Bureau, 2011b). If these trends continue into the future, business schools may continue to see their relative enrollments fall.
FURTHER RESEARCH AND CONCLUSIONS
Further research is needed to determine why students with the characteristics described previously (being female, hav-ing parents with more education, earnhav-ing AP credit) are less likely to choose business as a major. However, because women are much more likely to choose social work, nursing, and psychology as majors than are men (U.S. Department of Education, 2010a), it can be speculated that some women would be more likely to choose business as a major if busi-ness programs were to offer courses or programs focusing on not-for-profits. In this way, business programs could appeal to students who are helping oriented. Another way business pro-grams might increase their enrollments would be to offer joint programs with majors more popular with women, or market business minors to students in fast-growing majors more ag-gressively. Students with AP credit may be more likely to choose liberal arts majors as AP courses tend to be those found in liberal arts programs (College Board, 2011). Busi-ness programs could do a better job of explaining to potential students that their AP credit would be applied to general ed-ucation courses, therefore accelerating their progress in a business program as it would in a liberal arts program. An-other possibility would be to work with AP course and exam administrators to develop AP courses in business disciplines (beginning acccounting, finance). However, if students with AP credit are less likely to choose business as a major because business is not seen as rigorous enough for the ambitious stu-dent entering college, perhaps offering a more challenging business honors program would appeal to these students.
The findings of this research indicate relatively smaller numbers of college students are choosing business as a ma-jor, and recent changes in the characteristics of these students suggest this trend may continue. Presumably business edu-cators believe they offer a rigorous education that provides graduates with the potential for fulfilling careers and greater earning power. If this is the case, these educators may need to make adjustments to business programs to appeal to the changing mix of college students.
REFERENCES
Buchman, C., & DiPrete, T. A. (2006). The growing female Advantage in college completion: The role of family background and academic Achievement.American Sociological Review,71, 515–541.
College Board. (2009). Annual AP program participation 1956–2009. Retrieved from http://professionals.collegeboard.com/profdownload/ annual-participation-09.pdf
College Board. (2011). AP courses and exams. Retrieved from http://www.collegeboard.com/student/testing/ap/subjects.html
Goldin, C., Katz, L. F., & Kuziemko, I. (2006). The homecoming of Amer-ican college women: The reversal of the college gender gap.Journal of Economic Perspectives,20(4), 133–156.
Morgan, L. A. (2008). Major matters: A comparison of the within-major gender pay gap across college majors for early-career graduates. Indus-trial Relations,47, 625–650.
National Center for Education Statistics. (2010). Table 7. Percentage of population 3 to 34 years old enrolled in school. Retrieved from http://nces.ed.gov/programs/digest/d09/tables/dt09 007.asp?referrer= list
Staniec, J. F. (2004). The effects of race, sex, and expected returns on the choice of college major.Eastern Economic Journal,30, 549– 562.
U.S. Bureau of Labor Statistics. (2010). Table 1. Labor force status of 2009 high school graduates. Retrieved from http://data.bls.gov/cgi-bin/print.pl/news.release/hsgec.t01.htm
U.S. Census Bureau. (2011a).Table A-2. Percent of people 25 years and over who have completed high school or college, by race, Hispanic origin and sex: Selected years 1940 to 2010. Retrieved from http:// www.census.gov / hhes / socdemo / education / data / cps / historical / index. html
U.S. Census Bureau. (2011b). Table A-1. School enrollment of the population 3 years old and over, by level and control of school, race, and Hispanic origin: October 1955 to 2009. Retrieved from http://www.census.gov/hhes/school/data/cps/2010/tables.html
U.S. Department of Education. (2010a). Integrated postsecondary ed-ucation data system; group statistics; completions. Retrieved from http://nces.ed.gov/ipeds/datacenter/login.aspx
U.S. Department of Education. (2010b).2000/2001 Baccalaureate and be-yond longitudinal study (restricted use data). Washington, DC: Institute of Education Sciences, National Center for Education Statistics.