1
EFFECT ANALYSIS OF THE USE OF ACCOUNTING INFORMATION, MANAGERIAL PERFORMANCE AND EMPLOYEE PERFORMANCE
TOWARD SMEs
Akhsa Meiliana Intani Elisabeth Penti Kurniawati
[email protected] [email protected]
Satya Wacana Christian University Satya Wacana Christian University
ABSTRACT
SMEs (Small Medium Enterprises) have significant contribution in Indonesia economy. Therefore, it is necessary to analyze the factors that affect SMEs performance. The purpose of this study is to analyze the impact of the use of accounting information, managerial performance, and employee performance toward SME performance. The population of this study is SMEs located in District Purworejo, Central Java, Indonesia. Using convenience sampling method, there are 141 SMEs that are determined by Slovin formula. Multiple regression technique is used as an analysis technique. The study shows that the use of accounting information and employee performance has positive significant effect on the performance of SMEs, whereas managerial performance has no significant effect on the performance of SMEs. Based on the research, the role of operational employees is greater than the manager. Their skills to process the raw materials and to serve customers are very important in SME. The result can be used for SME's managers to increase the use of accounting information as a basis to take enhanced business decisions, and to improve their
employees’ performance by training and setting the reward system to get better productivity. By doing these, the performance of SMEs will be increased.
2
INTRODUCTION
Small Medium Enterprises (SMEs) sector contribute a lot for economy, also during the economic crisis. It gives significant contribution to Indonesia economics; 57.12% to Gross Domestic Product (GDP) in 2013. In Indonesia, the number of SME up to June 2013 is 55.2 millions unit or 99.98% out of Indonesia’s total enterprises unit. Moreover, this sector has absorbed 101.72 millions manpower or 97.3% out of Indonesia’s manpower. SME in district Purworejo, Central Java, is able to absorb approximately 48,238 people. SME’s targets in 2015 are improving
SME’s productivity and competitiveness, upgrading SME’s export up to 20% and creating innovative entrepreneurs (KRjogja.com, 27 July 2014). To develop SME’s potentials, this study will investigate factors that affect SME’s performance.
Previous study, Ediraras (2010), states that accounting information has positive effect to
SME’s performance. It is stated that accounting is the performance indicator in every enterprise
because of the information provided by the records is helpful in decision making. Hutagaol (2012) says that accounting is the key indicator in enterprise performance. The records is important
information that can be helpful in the decision making, hence it can improve the enterprise’s
management. The information will enable SME to identify and predict the upcoming problems and then take timely action. Based on those studies, it can be concluded that the using of accounting
information is significant to improve enterprise’s performance.
Hendrati and Muchson (2010) says that internal factor that influences SME’s performance
is Human Resources (HR). It includes SME’s managers and workers. Qualified HR is expected able to improve SME’s performance, both finance and non-finance. Based on that study, besides accounting information, managers and workers’ performance has significant influence in SME’s performance.
Tin and Hidayat (2012) states that to get a maximum profit, which is the goal of the
enterprise, is to continually develop employee’s performance, particularly managers. Hartini (2012) shows that management performance affect on innovation as it is determined by the managers. The
innovation does not affect the enterprise’s performance directly but significantly affect the quality
of product. In further, product quality has significant influence toward enterprise performance. Previous study has not investigated the influence of management performance toward SME performance directly hence this study is going to investigate the influence of management performance toward SME performance directly.
Yusriati, Arfan and Yahya (2012) states that SME owner needs to employ workers who already have adequate working experience. They show their high-quality performance hence the business operational could improved. When the business operational improved, it brings positive effect to the business profit, in which it reflects the real performance of the business operational.
Their study concludes that employees’ professionalism has significant effect toward SME’s profit
in Banda Aceh. Previous study has not investigated the influence of employees’ performance toward the enterprise performance directly hence this study is going to investigate the influence of
employees’ performance toward the enterprise performance directly.
Considering the significant role of SME in Indonesia economy, this study will investigate
factors that influence the SME performance in order to develop SME’s potential. Based on previous study, the question of this study is “Is there any influence in using the accounting
3 Benefit of this study is committed to (1) SME practioners, so that they could recognize the
factors that influence the SME’s performance; (2) Indonesia government, as their reference in designing the SMEs development planning in order to improve economy of Indonesia.
LITERATURE REVIEW
Small Medium Enterprises (SMEs)
Based on the net assets and annual sale income, definition of SMEs in accordance with SMEs Government Regulation no.20 of 2008 is:
1. The small enterprise is an independent productive economic enterprise, which runs by individuals or companies which is not a branch companies owned, run, or becomes both, directly or indirectly, the part of the medium or big enterprises which have net asset more than IDR 50.000.000 (fifty millions rupiah) up to IDR 500.000.000 (five hundred millions rupiah), excluding the sites and buildings of the enterprise or have annual sales income more than IDR 300.000.000 (three hundred millions rupiah) up to IDR 2.500.000.000 (two billions five hunded millions rupiah).
2. The medium enterprise is an independent productive economic enterprise, which runs by individuals or companies which is not a branch companies owned, run, or becomes both, directly or indirectly, the part of the small or big enterprises which have net asset more than IDR 500.000,000 (five hundred millions rupiah) up to IDR 10.000.000.000 (ten billions rupiah), excluding the sites ad buildings of the enterprise, or have annual sales income more than IDR 2.500.000.000 (two billions five hundred millions rupiah) up to IDR 50.000.000.000 (fifty billions rupiah).
Meanwhile based on the number of the workers, Central Bureau of Statistics in District Purworejo in 2012 defines SME as follow:
a. The small enterprise is an independent productive economic enterprise, which runs by individuals or companies which is not a branch companies owned, run, or becomes both, directly or indirectly, the part of the medium or big enterprises which have 5 (five) up to 19 (nineteen) workers.
b. The medium enterprise is an independent productive economic enterprise, which runs by individuals or companies which is not a branch companies owned, run, or becomes both, directly or indirectly, the part of the big enterprises which have 20 (twenty) up to 99 (ninety nine) workers.
There are three types of SME based on Central Bureau of Statistics in District Purworejo:
1. Manufacturing Business is any business that uses components, parts or raw materials to make a finished good that can be sold to consumers.
2. Merchandising Business is any business that purchases finished products and resells them to consumers.
3. Service Business is any business that provides service, not products or good for consumers.
The Use of Accounting Information
4 need information to reduce past, current and future uncertainty. Based on that definition, the using of accounting information can be defined as using fact, data, examination, perception or others related to accountancy which adds to knowledge of an organization. A manager uses accounting information to reduce uncertainty in choosing any business alternative procedures. According to Suryani (2013), good accounting information will help the boards to make an effective decision. It shows when a manager use accounting information as a data in every decision making then it will reduce the uncertainty hence it will make better decision quality. This surely brings positive impact to the SME performance.
To be able to measure the use of accounting information, this study is using Holmes and
Nicholls (1988) classification which classify the information in three types according to the users’
benefit: (1) Statutory accounting information, accounting information according to the rules applied; (2) Budgetary information, accounting information provided in budget planning to support internal boards in making planning, assessment and decision making; (3) Additional accounting information, other accounting information that is prepared to increase the effectiveness
of manager’s decision making.
Managerial Performance
Performance is a competence that is required for any positions such as knowledge, skills, behavior and attitude (Lestari & Maliki, 2003). Managerial performance is how far a manager carries out the management functions including planning, investigation, coordination, evaluation, monitoring, staff selection, negotiation and delegation (Mahoney, Jerdee & Karrol, 1963). These functions are tools to achieve company’s goals. Therefore, when these functions run effectively it
is expected that the goals of the company is achieved, which means the enterprise’s performance
perform well. When these functions are applied in SME, it will also affect its performance.
Indicator is needed in order to assess a manager’s performance. According to Heneman
(1974) there are eight indicators to assess managerial performance: (1) Planning is a process of setting goal, target, policy and series of upcoming programs that consider current and future condition; (2) Investigation is done through collecting information as a means of recording and reporting in order to measure and analyze result of a program; (3) Coordination is an information exchange between people in the organization in order to coordinate and reconcile upcoming
programs; (4) Evaluation is assessment which is done by a leader for assessing the workers’
performance and working report then a decision can be drawn from the assessment; (5) Supervision is assessment of working plan or inputs which is observed and reported in order to direct, lead and develop the subordinate; (6) Staffing is keeping the subordinate in a working unit, selecting new tasks, putting and promoting the task in the units or other working unit; (7) Negotiation is an effort to get agreement in buying, selling or contract for procurement; (8) Representative are those who deliver information on vision and mission and programs of the organization by attending business meeting.
Employee Performance
5
This study is using Janseen’s (2001) indicators to measure employees performance, there
are (1) Working Quantity is load of work based on the allocated time. What matter is how the employee finishes the task in time, not on the routine task itself. An employee who shows good performance, his/her working quantity is usually above average than other employees: (2) Working Quality is quality of working result based on the standard procedures. Usually it is measured by accuracy, details, skills and orderliness. An employee who shows good performance, his/her working quality is usually above average than other employees; (3) Efficiency is the best comparison between a task and result according to the targets both in quality and quantity including time usage and quality of the working procedures; (4) Quality Standard, a good quality standard means quality standard which is set above the official standard of the company; (5) Effort, an employee who shows good performance is he/she who makes an effort harder than any other employee in the same department; (6) Professional Standard, an employee who shows good performance holds high professional standard; (7) Ability to carry out his/her main task, an employee with good performance can be seen from his/her ability to carry out his/her main tasks in line with his/her position in the company; (8) The ability to use logic in caring out the task; (9) Accuracy in performing the task, a good employee will do the order from his/her leader accurately; (10) General knowledge related to the main task; (11) Creativity in performing the main task.
Company Performance
According to Helfert (in Srimindarti, 2004), company performance is a display of whole situation of a company for certain period of time, as a result or achievement that influenced by
activities of a company’s operation in employing its resources. Simanjuntak (2005) suggests a
performance as the level of result achievement from performing certain tasks. Thus, it can be said that the enterprise is the level of result achievement in the framework gaining purposes of the company.
This research uses measurement indicators of company performance using method of balanced scorecard, consists of financial perspective, customer perspective, internal business process perspective, and learning and growth perspective (Kaplan and Norton, 1996):
a. Financial Perspective
Financial perspective is oriented on maximizing profits that in turn effects the satisfaction
of the owner of a company. Kaplan and Norton (1996) state that “for each of the three
strategies of growth, sustain, and harvest, there are three financial themes that drive the business strategy: revenue growth and mix, cost reduction/productivity improvement, and
asset utilization/investment strategy”. In this research, the measurement of financial
perspective in SMEs is simplified by Prijambodo (2011) by measuring profits and sales increases.
b. Customer Perspective
Customer perspective is the fulfillment of customer satisfaction so that customer loyalty is
maintained. Kaplan and Norton (1996) state that “The core measurement group of customer
outcomes is generic across all kinds of organizations. The core measurement group includes measures of: market share, customer retention, customer acquisition, customer
satisfaction, and customer profitability”. In this research, the measurement of customer
perspective in SMEs is simplified by Prijambodo (2011) by measuring the increases of number of customers, complaints of customers, and grants of rewards/gifts to old customers.
6 The changing dynamics of needs, demands, and tastes of customers has demanded a company to fulfill the needs to obtain of goods or services in developed amount and quality
(Prijambodo, 2011). Kaplan and Norton (1996) state that, “Each business has a unique set
of processes for creating value for customers and producing financial results. We have found, however, that a generic value-chain model provides a template that companies can customize in preparing their internal-business-process perspective. This model encompasses three principal business processes: innovation, operations and post sale
service”. In this research, the measurement of internal business process perspective in
SMEs is simplified by Prijambodo (2011) by measuring innovation in business, time priority as well as service quality and post-sale process such as giving of warranty.
d. Learning and Growth Perspective
Learning and growth perspective has a scope of the competence improvement of human
resources. Kaplan and Norton (1996) state that, “Our experience in building Balanced
Scorecards across a wide variety of service and manufacturing organizations has revealed three principal categories for the learning and growth perspective: employee capabilities,
information system capabilities, and motivation, empowerment and alignment”. In this
research, the measurement of learning and growth perspective in SMEs is simplified according to Prijambodo (2011) by measuring bonuses obtained by employees as compensation for their good performance, the involvement of employees in decision making and the frequency of employee turnover.
The Impact of the Use of Accounting Information toward SMEs Performance
Accounting information can help a company in business related decision making. According to Kurniawati, Kurniawan and Kristiani (2013), SMEs using different accounting information depends on their business characteristics. SMEs require documents and records in provide the accounting information that can be used in business decision making and performance assessment.
The use of accounting information can be used to control the performance of the company. It means that there will be different performances between SMEs that use accounting information and SMEs that do not use accounting information. If a company uses accounting information, its quality of planning, supervision and strategic and operational decision making will be better, therefore it will help increasing of its business performance. It is supported by the results of research done by Ediraras (2010) stating that accounting information has a positive effect on SMEs performance.
The Impact of Managerial Performance toward SMEs Performance
A manager in a company has a pivotal role in managing the company to achieve its objectives. Thus it can be said that the performance of a manager influences the success in achieving purposes of a company. The achievement purposes of a company are measured by the performance of the company. Hartini (2012) states that innovation of a company does not influence the performance of the company directly but do influence significantly on its product quality. Meanwhile, product quality influences significantly on the performance of a company. Control of innovation is in the hands of a manager, thus the performance of a manager influences innovation of a company. The product quality is also determined by the performance of manager.
7 Employees in a company have duties and responsibilities to perform what has been commanded by a manager or supervisor in the framework achieving the purposes of a company. Thus, roles of employees are very important for the success of a company. Research of Yusriati, Arfan and Yahya (2012) shows that professionalism of employee influences significantly on the profit of SMEs. Their research shows that the professionalism of employees really determines the performance of SMEs. Employees with long work experiences will be able to show a high performance, thus the business operation will be better. Operation of production that is conducted smoothly and finished in short time will be able to increase sales. The increase of sales will result higher profits. Profit is one of indicators of enterprise performance according to Prijambodo (2011).
Thinking Framework
The reasoning framework of this research will be built with a basis that if SMEs use accounting information, SME s will be able to use the information to evaluate the weakness of a company so that the company can do repairs to improve its business performance. It is in line with the research by Ediraras (2010) stating that accounting information has a positive effect on SMEs performance.
When the performance of SMEs is good, it can help SMEs achieving their purposes. The extent of SMEs achieve their purposes can be measured by the performance of SMEs. It is in line with the research by Hartini (2012) stating that the performance of manager determines innovation influencing the product quality of which in turn influences performance of a company.
If the performance of a manager is good but the employees cannot perform their tasks properly, the company will not be able to achieve its purposes. For that reason, if the performance of employees is good in performing tasks given by a manager, the performance of SME will also be better. It is in line with the research by Yusriati, Arfan and Yahya (2012) stating that the professionalism of employees has a significant effect on SMEs’ profits. Their researches explain that the professionalism of employees extremely determines the performance of SMEs.
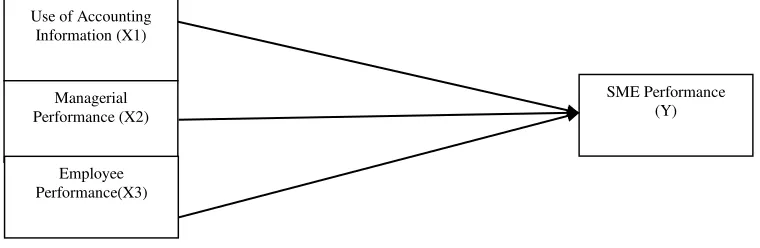
Based on that logical concept, the thinking framework of this research can be defined as follows:
Figure 1.Thinking Framework
The above thinking framework shows that the use of accounting information, managerial performance and employee performance influence the performance of SMEs simultaneously or partially.
Use of Accounting Information (X1)
SME Performance (Y) Managerial
Performance (X2)
8
Research Hypotheses
Based on the above, hypotheses of this research are:
1. � : The use of accounting information does not influence the performance of SMEs � : The use of accounting information influences the performance of SMEs. � : Managerial performance does not influence the performance of SMEs. � :Managerial performance influences the performance of SMEs.
2. � : Employee performance does not influence the performance of SMEs. � : Employee performance influences the performance of SMEs.
3. � : The use of accounting information, managerial performance and employee performance do not influence the performance of SMEs.
� : The use of accounting information, managerial performance and employee performance influence the performance of SMEs.
METHODOLOGY Population
Populations of this research are SMEs at Purworejo sub-district of Purworejo regency – Central Java consisting of 218 units (BPS catalog, 2013). This research only takes object of small enterprise and middle enterprise without takes micro enterprise with a consideration that micro enterprises in general have not had accounting report and have not had employees, therefore, it cannot be identified their managerial performance and employee performance.
Sample
Method of sample taking in this research is convenience sampling, i.e. method of which members of a population that is met by researchers and is willing to be respondent of sample (Sekaran, 2003). This research uses 5% error level with 95% confidence level.
Number of samples of this research is determined, based on the formula of Slovin (Sevilla, et al, 1993), namely:
� = +� �� 2
Explanation:
n = number of sample N= number of population
e = desired limit of accuracy or tolerated limit
Based on the above formula, the calculation of number of samples as follows (using e = 5%):
� = + 8 , 58 2= 141,10 rounded into 141
Data Collection Technique
Primary data was collected through direct visits to the object of study in order to obtain the necessary data, that is by distributing questionnaires to managers of SMEs.
Variable and Indicator
9 employee performance (X3). Variables of the performance of SME was measured using a five-point scale (Strongly disagree = 1 to Strongly agree = 5), variable of the use of accounting information is measured using a five-point scale (never = 1 to Always = 5), the managerial performance is measured using a scale of seven points (Low = 1 to High = 7), the employee performance is measured using a seven-point scale (Strongly disagree = 1 to Strongly agree = 7). Explanation about variables and each of their indicators is presented in table 1 below:
Table 1:Table of Variables dan Indicators
Variable Operational Definition Indicator
The Use of Accounting Information (X1)
The use of accounting information is the use of facts, data, observations, as well as a perception or the others concerning financial condition of a company that that adds knowledge (Mulyadi, 1993).
According to Holmes and Nicholls (1988) there are three (3) types of accounting information according to the benefits for the users, namely: 1. Statutory accounting information
2. The budgetary information 3. Additional accounting information
1. Using statutory information in decision making, namely:
a. Balance sheet
b. Report of profit and loss c. Report of changes in equities d. Report of cash flow
e. Others
2. Using budgetary information for planning, namely: a. Cash flow budget
b. Sales budget c. Production budget d. Operating cost budget e. Others
3. Using additional information for decision making, namely:
a. Report of inventory b. Report of employee salary
c. Report of the number of production d. Report of production cost
e. Others
Managerial Performance (X2)
Managerial performance is the extent of a manager performs management functions such as planning, investigation, coordination, evaluation,
supervision, staffing, negotiation, and representation. (Mahoney et.al,
1963).
According to Mahoney et.al (1963) there are 8 managerial performance measurement indicators, namely: 1. Planning 2. Investigation 3. Coordination 4. Evaluation 5. Supervision 6. Staffing 7. Negotiation 8. Representation
1.Determine objectives, targets, policies, and actions. 2.Collect and prepare information (used in
examination to assess results of work), usually in form of reports, notes and accounts.
3.Exchange of information with people in the organization not only with employees, but also with other parties to adjust programs.
4.Evaluate and assess proposal (work plan), report and performance.
5.Direct, lead and develop employees in their unit or multiple units.
6.Maintain and sustain employees in their unit or multiple units.
7.Purchase, sale, contract for goods and services (efforts to get an agreement on the issue of purchasing, sale and contract).
10
Variable Operational Definition Indicator
Employee Performance (X3)
Employee performance is results of work both in quality and quantity that achieved by an employee by performing his/her tasks according to responsibility trusted to him/her (Mangkunegara, 2006).
According to Janseen (2001), employee performance is observed from
1. Work quantity 2. Work quality 3. Efficiency 4. Quality standard 5. Effort
6. Professional standard
7. Ability to carry out the core job 8. Ability in using common sense
in performing job
9. Accuracy in carrying out work 10.Knowledge related to the main
job
11.Creativity in carrying out the main job
1. Quantity of employee performance exceeds the average of other employees.
2. Quality of employee performance is much better than other employees.
3. Employee efficiency exceeds the average of other employees.
4. Employee quality standard exceeds the existing official standards (standard in the company) 5. Employees try harder than the required standard. 6. Employees hold a high professional standard. 7. The ability of employees in a carrying out a main
job excellently.
8. The ability of employees in using common sense in carrying out an excellent job.
9. The accuracy of employees in performing job excellently.
10.The knowledge of employees in related to the main job is good.
11.Creativity of employees in carrying out main job is good.
SME performance (Y)
The performance of enterprise is a display state as a whole over certain period of time, as a result or achievement that is affected by the operation of the enterprise in using their resources (Helfert (in Srimindarti, 2004)).
According to Kaplan % Norton (1996) who introduce the Balanced Scorecard performance
measurement method, suggest the management to look at the organization from four
perspectives, then build the system, collect data and analyze by relating it to each perspective with every aspect, namely:
1. Financial perspective 2. Customer perspective
3. Perspective of Internal Business Process
4. Learning and Growth Perspective
1.Financial perspective:
a. There is always an increase of profit every year.
b. There is always an increase of sales every year.
2.Customer perspective:
a. There are always additional employees every year.
b. There is never any serious complaint from customers.
c. Discounts or gifts always given to old customers.
3.Perspective of internal business process: a. Always innovate on business.
b. Always prioritize time and quality of service. c. Always provide after-sales service such as
warranty.
4.Perspective of learning and growth: a. Always give bonuses or rewards to
employees performing well.
b. Always involve employees in decision making.
c. Employee turnover occurs rarely.
11 Data are analyzed descriptively and quantitatively. Data that has been collected is processed using SPSS application. The data must first be tested using the classical assumption test, which consists of normality test, autocorrelation, multi-colonearit test, and hetero-scedasticity test. Next, hypothesis test is done using multiple regression test (F and t test) with 95% confidence level.
RESULTS AND DISCUSSION Overview of Research Object
Object research of this study is 141 units of SMEs, of which 68.09% is engaged in trading, the remaining engaged in the service sector (19.86%) and manufacturing (12.06%), see the table 2 below:
Table 2 Business Type of SMEs
No. Business Type Number Percentage
1. 2. 3. Service Trade Manufacture 28 96 17 19.86% 68.09% 12.06%
Total 141 100.00%
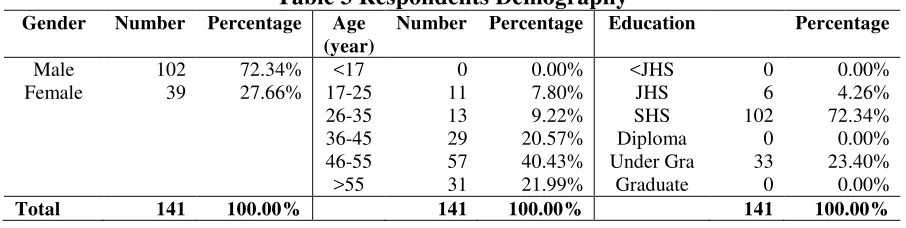
From demographic data of respondents (table 3) noted that 72.34% are male, 40.43% aged 46-55 years old, and 72.34% graduated from Senior High School.
Table 3 Respondents Demography
Gender Number Percentage Age
(year)
Number Percentage Education Percentage
Male Female 102 39 72.34% 27.66% <17 17-25 26-35 36-45 46-55 >55 0 11 13 29 57 31 0.00% 7.80% 9.22% 20.57% 40.43% 21.99% <JHS JHS SHS Diploma Under Gra Graduate 0 6 102 0 33 0 0.00% 4.26% 72.34% 0.00% 23.40% 0.00%
Total 141 100.00% 141 100.00% 141 100.00%
JHS = Junior High School, SHS = Senior High School
Most SMEs are managed by managers (94.33%), not by owners of SMEs (see Table 4). Most SMEs have employees, which ranges between 1-4 men, (30.50%), 5-19 men (48.23%), and 20-99 men (15.60%).
Table 4 Business Managers and Number of Employees of SMEs Business
Manager
Number Percentage Number of
Employees
Number Percentage
Manager Owner 133 8 94.33% 5.67% 0 1-4 5-19 20-99 8 43 68 22 5.67% 30.50% 48.23% 15.60%
Total 141 100.00% 141 100.00%
12 turnover, it consists of microenterprises (19.86%), small businesses (57.45%), and medium enterprises (22.69%).
Table 5 Grouping of SMEs Based on Assets and Turnover
No. Criteria (based on Law no. 20 of 2008) Number Percentage
1. Asset:
Micro Business: ≤ Rp 50.000.000
Small Business: > Rp 50.000.000 to Rp 500.000.000 Medium Business: > Rp 500.000.000 to Rp 10.000.000.000
41 86 14 29.08% 60.99% 9.93%
141 100%
2. Turnover:
Micro Business: ≤ Rp 300.000.000
Small Business: > Rp 300.000.000 to Rp 2.500.000.000 Medium Business > Rp 2.500.000.000 to Rp 50.000.000.000
28 81 32 19.86% 57.45% 22.69%
141 100%
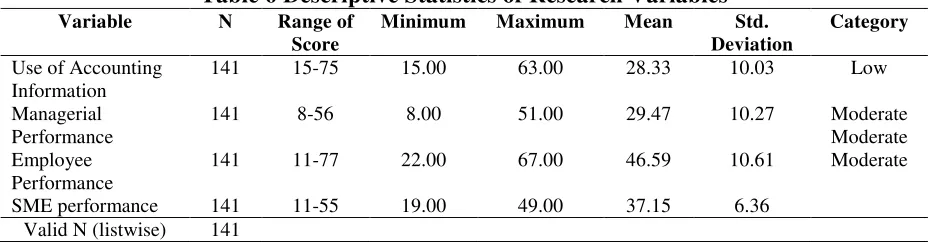
Descriptive Statistics
Descriptive statistics for each variable indicate that the average score of the use of accounting information is 28.33, which means the level of use of accounting information on the object of research is low; the average score of managerial performance is 29.47, which means the level of managerial performance on the object of research is moderate; The average score of the employee performance is 46.59, which means the level of employee performance on the object of research is moderate; the average score on SME performance is 37.15 which means that the level of performance of SMEs in the research object is moderate (see table 6).
Table 6 Descriptive Statistics of Research Variables
Variable N Range of
Score
Minimum Maximum Mean Std.
Deviation
Category
Use of Accounting Information Managerial Performance Employee Performance SME performance 141 141 141 141 15-75 8-56 11-77 11-55 15.00 8.00 22.00 19.00 63.00 51.00 67.00 49.00 28.33 29.47 46.59 37.15 10.03 10.27 10.61 6.36 Low Moderate Moderate Moderate
Valid N (listwise) 141
Classical Assumption Test
The test results of normality with the Kolmogorov-Smirnov test (KS) indicate that significant value of KS 0.955 greater than the significance level 0.05, then it can be concluded that the data are distributed normally.
Autocorrelation test results show that the value of Durbin Watson (DW) is 1.762. For N = 141 and the number of independent variables or k = 3 obtained the value of dL = 1.681 and dU = 1.761 therfore 4-dL = 2.319 and 4-dU = 2.239. Because the value of DW located between dU and 4-dU, it can be concluded that there is no autocorrelation in research data.
13 respectively 1.148; 1.153; 1.054. From these results it can be concluded that there is no multicollinearity on research data.
The multicolinearity test results show that the value of Sig. for each variable is 0.107; 0.889; 0.285, all those values greater than α = 0.05. While the tcount value for each variable is -1.624; -0.140; 1,074, all grades are smaller than t-table 1.97718. From these results it can be concluded that there is no heteroscedastisity on research data.
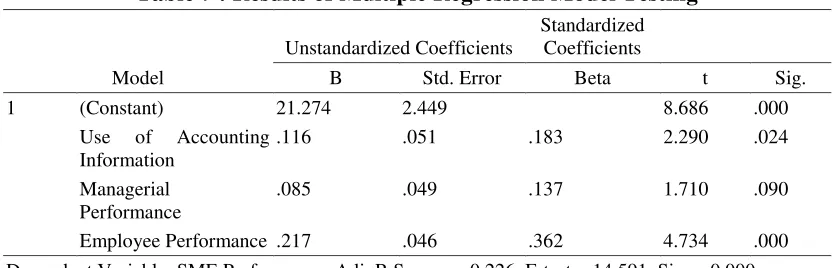
Hypothesis Testing Results Using Multiple Regression
The results of hypothesis testing using multiple regression and the F test and t test can be observed in the following table:
Table 7 : Results of Multiple Regression Model Testing
Model
Unstandardized Coefficients
Standardized Coefficients
B Std. Error Beta t Sig.
1 (Constant) 21.274 2.449 8.686 .000
Use of Accounting Information
.116 .051 .183 2.290 .024
Managerial Performance
.085 .049 .137 1.710 .090
Employee Performance .217 .046 .362 4.734 .000
Dependent Variable: SME Performance, Adj. R Square = 0,226, F-test = 14,591, Sig. = 0,000
In determination coeficient test results, it is obtained adjusted R-square of 0.226, which means that 22.60% the performance of SMEs affected by the use of accounting information, managerial performance and employee performance. While the remaining 78.40% influenced by other variables.
a. Simultaneous Test (F Test)
Based on F tes results (see tabel 7), that is testing the effect of all independent variables on the dependent variable simultaneously, obtained the value of Sig. = 0.000 of which value is less than α = 0.05. Thus, � is rejected, so it can be concluded that there is the influence of the use of accounting information, managerial performance and employee performance on the performance of SMEs which is significant.
b. Partial Tes (t Test)
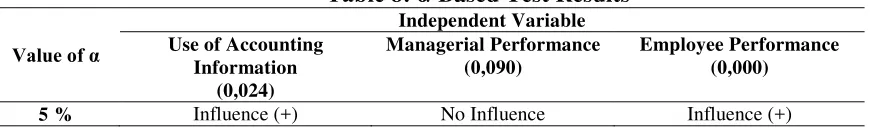
Based on t test results (see table 7), it is known that the variable of the use of accounting information has a value Sig. = 0.024, which means it is smaller value than α = 0.05. Thus � is rejected, so it can be concluded that the use of accounting information influences the performance of SMEs significantly. Meanwhile, the variable of managerial performance has a value of Sig. = 0.090 which means it is a greater value than α = 0.05. Thus is � is accepted, so it can be concluded managerial performance has no significant effect on the performance of SMEs. The variable of employee performance has a value of Sig. = 0.000 which it means a smaller value from
14 Table 8: α-Based Test Results
Value of α
Independent Variable Use of Accounting
Information (0,024)
Managerial Performance (0,090)
Employee Performance (0,000)
5 % Influence (+) No Influence Influence (+)
The Use of Accounting Information and Performance of SMEs
The use of accounting information variable is measured by the use of accounting information by SMEs, including the use of statutory information, budget information and the additional information that are used for planning and decision making. Based on t test results show that the use of accounting information has influence on the performance of SMEs, thus the results of this study support the research of Ediraras (2010) which states that the accounting information has positive influence on the performance of SMEs. This study therefore proves the proposition that if SMEs use accounting information in their business, the performance of SMEs will increase because the use of accounting information can support planning and decision-making business.
Managerial Performance and Performance of SMEs
Managerial performance variable is measured by the ability of managers to manage their business. Based on t test results showing that the performance of managerial has no significant effect on the performance of SMEs, the results of this study do not support research of Hartini (2012) which states that the performance of managerial innovations significantly affect the quality of products that in turn has a significant effect or influence on the performance of the enterprises. Thus, this research cannot prove that if the SMEs managerial performance is good then the performance of SMEs will increase because the performance of SMEs can also be influenced by other factors, especially the performance of operational employees that are more directly involved in day-to-day business activities.
Employee Performance and Performance of SMEs
Employee performances are measured by the ability of employees in their work and carry out a task given by a manager. Based on t test results showing that the performance of the employees have a significant effect on the performance of SMEs, the results of this study support the research by Yusriati, Arfan and Yahya (2012) which states that the professionalism of the employees have a significant effect on profit. Profit is one of indicators of business performance measurement according to Prijambodo (2011). Thus this study proves that the good performance of employees can improve the performance of SMEs, because employees are directly involved with operational activities of SMEs.
CLOSING Conclusion
15 SMEs, therefore, if employee performance improves, the performance of SMEs will increase as well.
Applied Implications
This research can be taken into consideration for managers of SMEs to (1) increase the use of accounting information as a basis for making business decisions, so that decisions taken are the ones with higher quality so that it can give contribution towards the improvement of the performance of SMEs; (2) improve the performance of employees through training or giving of bonus/reward because with the increased performance of employees, it is expected that the performance of SMEs will also increase.
The results of this study indicate that managerial performance has no influence on the performance of SMEs. Observations of this study show that in the core activities of SMEs, the role of operational employees is greater than the role of the manager. Skills in processing raw materials and customer services are the core activities in SMEs. The performance of employees play more important role because more employees are directly involved in core activities in SMEs.
Limitations and Future Research
Limitations of this study are the subjectivity of respondents in filling the questionnaires. Besides, some respondents did not have any employees so that an assessment of managerial performance and the performance of employees cannot be separated. The coefficients of determination in this research is still low, i.e. at 22.60%, which means there are many other variables besides accounting information, managerial performance and employee performance that affect the performance of SMEs.
Based on these limitations, recommendations for future research are: completing the questionnaire method by an in-depth interviews method to reduce the subjectivity of the respondents as well as adding other variables that can affect the performance of SMEs like accounting records, accounting knowledge, and so on.
REFERENCES
Ediraras, Dharma T. 2010. Akuntansi dan Kinerja UKM. Jurnal Ekonomi Bisnis No. 2, Volume 15, Agustus 2010.
Hartini, Sri. 2012. Peran Inovasi: Pengembangan Kualitas Produk dan Kinerja Bisnis. Jurnal Manajemen dan Kewirausahaan, Vol.14, No. 1,
Maret 2012: 82−88.
Hendrati, Ignatia Martha dan Muchson, Mochamad. 2010. Latar Belakang Pendidikan, Pelatihan Dan Jiwa Kewirausahaan Terkait Kinerja Keuangan UKM (Studi Di Sentra Industri Tenun Ikat Kelurahan Bandar Kidul Kecamatan Mojoroto Kota Kediri). Jurnal Riset Ekonomi dan Bisnis Vol.10 No. 1 Maret 2010.
16 Holmes, S., dan Nicholls, D. 1988. An Analysis of The Use of Accounting Information by
Australian Small Business. Journal of Small Business Management, 26 ).57-68.
http://purworejokab.bps.go.id, diakses 6 Februari 2014.
Hutagaol, Renaldo Martin Novianto. 2012. Penerapan Akuntansi Pada Usaha Kecil Menengah.
Surabaya: Jurnal Ilmiah Mahasiswa Akuntansi Fakultas Bisnis Universitas Katholik Widya Mandala Surabaya.
Janseen, Onne. 2001. Fairness Perception As Moderator in the Curvilinear Relationship Between Job Demand, and Job Performance and Job Satisfaction. Academy of Management Journal Vol. 44. No. 5, 1039-1050.
Kaplan, R.S dan Norton, D.P. 1996. The Balanced Scorecard: Translating Strategy into Action.
Boston Massachuted: Harvard Business School Press.
KRjogja.com, 27 Juli 2014, diakses 9 September 2014
Kurniawati, Elisabeth Penti; Kurniawan, Even Yunika dan Kristiani Mira. 2013. Accounting Information for Business Decision Making and Performance Assessment in Small and Medium Enterprises (SMEs). 社会科学ジャーナル』76 2013 The Journal of Social Science 76[2013] pp. 67-95.
Lestari, Endang dan Maliki. 2003. Komunikasi yang Efektif. Jakarta
Mahoney, T. A., T. H. Jerdee & S. J Karrol. 1963 . Development of Managerial Performance: A Research Approach. Cincinatti: South Western Publishing.
Mangkunegara, Anwar Prabu. 2003. Perencanaan Dan Pengembangan SDM. Bandung: Rafika Aditama.
Mas’ud, Fuad. 2004. Survai Diagnosis Organisasional Konsep dan Aplikasi. Badan Penerbit Universitas Diponegoro.
Mulyadi. 1993. Akuntansi Manajemen: Konsep, Manfaat dan Rekayasa. Edisi Kedua. Yogyakarta: BPFE.
Prijambodo. 2011. Balanced Scorecard (BSC) pada Koperasi. Jakarta:Kominfo.
Sekaran, Uma. 2003. Research Methods for Business: A Skill Building Approach, 4th Edition.
New York, USA: John Wiley & Son, Inc.
17 Simanjuntak, Payaman J. 2005. Manajemen dan Evaluasi Kerja. Lembaga Penerbit FEUI, Jakarta. Simanullang, Gideon. 2013. Pengaruh Belanja Modal, Intergovernmental Revenue dan Pendapatan Asli Daerah Terhadap Kinerja Keuangan Daerah Kota
dan Kabupaten di Provinsi Kepulauan Riau Tahun 2008 – 2012. Umrah Journal Of
AccountingVolume 1, Nomor 1, Tahun 2013, Halaman 1-24.
Srimindarti, Caecilia. 2004. Balanced Scorecard: Sebagai Alternatif Untuk Mengukur Kinerja. Fokus Ekonomi.
Suryani, Indah. 2013. Pengaruh Penggunaan Informasi Akuntansi Manajemen dan Desentralisasi Terhadap Kinerja Manajerial (Survey pada Dealer Mobil Kota Jambi).e-Jurnal BINAR AKUNTANSI Vol. 2 No. 1, Januari 2013 ISSN 2303 – 1522.
Tin, Se dan Hidayat, Taufik. 2012. Analisis Pengaruh Penerapan Akuntansi Pertanggungjawaban Terhadap Kinerja Manajer Pusat Laba di Warung Paskal Bandung. Jurnal Akuntansi Vol.4 No.2 November 2012: 187-199.
Undang-Undang Republik Indonesia Nomor 20 tahun 2008. Tentang Usaha Mikro, Kecil dan Menengah.
Yusriati, Cut; Arfan, Muhammad dan Yahya,M. Rizal. 2012. Pengaruh Pinjaman
Modal Kerja dan Profesionalisme Sumber Daya Manusia Terhadap Laba Usaha Kecil Menengah Kota Banda Aceh. Jurnal Akuntansi Program Pascasarjana Universitas Syiah Kuala Banda Aceh Volume 1, No.2,November 2012.
18
APPENDIX 1
THE QUESTIONNAIRE OF INFLUENCE OF THE USE OF ACCOUNTING INFORMATION, MANAGERIAL PERFORMANCE, AND EMPLOYEE PERFORMANCE ON THE PERFORMANCE OF SME
Tick the sign (V) on your answers
I. Respondent Data
1. Name of Respondent (may be filled with blank): ………. 2. Gender: Male Female
3. Age
(year): 4. Last Education:
Not completed Primary School
Primary School
Junior High School
Senior High School
Diploma Under graduate
Graduate
5. Type of Business: Manufacture Trade Service 6. Category of Business:
Category Number of Employees (BPS)
Business asset (Act no. 20 of 2008)
Business turnover (Act no. 20 of 2008)
Micro 1 – 4 ≤ IDR 50,000,000 ≤IDR 300,000,000
Small 5 – 19 >IDR 50,000,000 to 500,000,000
>IDR 300,000,000 to 2,500,000,000 Middle 20 – 99 >IDR 500,000,000 to
10,000,000,000
>IDR 2,500,000,000 to IDR 50,000,000,000
II. Rate from Respondents Regarding the Use of Accounting Information in Business (Holmes and Nicholls, 1988)
< 17 17-25 26-35 36-45 46-55 >55
Question
Never Rarely Someti mes
Often Always
1 2 3 4 5
1. Are you using the statutory information (information prepared in accordance with the existing rules) in decision making, namely: a. Balance sheet
b. Profit and loss report c. Report of changes in equities d. Report of cash flow
e. Others,
Please mention ...
2.Are you using budgetary information for planning, namely:
19 III. Rate from Respondents Regarding Managerial Performance (Heneman, 1974 in Mas’ud,
2004)
Rate of managerial performance is made by a manager himself. Filled with value of 1 to 7 with commentary:
Low Average High
1---2---3---4---5---6---7
IV. Rate from Respondents Regarding Employee Performance (Janseen, 2001 in Mas’ud,
2004)
The rate of average operational performance of employees is made by a manager. Filled with the value of 1 to 7 with commentary:
Strongly Disagree Strongly Agree
1---2---3---4---5---6---7
No Statement Value
1 2 3 4 5 6 7 1. On average, quality of an employee exceeds other employees
2. Work quality of your employee is far better than other employees. 3. The efficiency of your employee exceeds the average of other employees.
4. Your employee quality standard exceeds the existing official standard (standard of the company).
b. sales budget
c. production cost budget d. perational cost budget e. others
Please mention ...
3. Are you using additional information for decision making, namely:
a. Inventory report b. Employee salary report c. Number of production report d. Production cost report e. Others
Please mention ...
No.
Activity Commentary Value
1 2 3 4 5 6 7 1. Planning Determine the objectives, targets, policies and actions.
2. Investigation/ Examination
Collect and prepare the information (used in examination to assess the work results), usually in form of reports, records and accounts.
3. Coordination Exchange of information with other people in the organization not only with employees but also with other parties to adjust the existing programs.
4. Evaluation Evaluate and assess proposals (work plans), reports and performance. 5. Supervision Direct, lead and develop employees in one unit or in several units. 6. Staffing Maintain and defend employees in one unit or several units.
7. Negotiation Purchase, sale, make contract for goods and services (The effort to achieve an agreement on the issues of buying, sales and contract).
20
5. The employee tries harder than it is expected. 6. The employee holds a high professional standard.
7. Ability of the employee is good in performing core works.
8. Ability of the employee to use common sense is good in carrying out a job. 9. Timing of the employee is good in performing a job.
10. Knowledge of the employee is good related to the main job.
11. Creativity of the employee is good in performing his main job.
V. Rate from Respondents Regarding SMEs Performance (Prijambodo, 2011)
Description: SD : Strongly Disagree D : Disagree N : Neutral
A : Agree
SA : Strongly Agree
Description
SD D N A SA
1 2 3 4 5
Financial perspective:
1. 1. There is always an increase in profits every year. 2. There is always an increase in sales every year. Customer perspective:
1. There is always addition of customers every year. 2. There are never any serious complaints from customers. 3. Always give discounts or presents for old customers. Internal business process perspective:
1. Always innovating in the business.
2. Always prioritize timing and service quality. 3. Always provide after-sales services such as warranty. Perspective of learning and growth:
1. Always give bonuses or other rewards to employees who perform well. 2. Always involve employees in decision making.
3. Employee turnover rarely occurs.
21
APPENDIX 2
Descriptive Statistics
N Minimum Maximum Mean Std. Deviation
Use of Accounting Information
141 15.00 63.00 28.3262 10.02746
Managerial Performance 141 8.00 51.00 29.4681 10.26753
Employee Performance 141 22.00 67.00 46.5887 10.61204
SME Performance 141 19.00 49.00 37.1489 6.36389
Valid N (listwise) 141
Classical Assumption Test Normality Test
One-Sample Kolmogorov-Smirnov Test
Unstandardized Predicted Value
N 141
Normal Parametersa,,b Mean 37.1489362
Std. Deviation 3.13155174
Most Extreme Differences Absolute .043
Positive .043
Negative -.037
Kolmogorov-Smirnov Z .513
Asymp. Sig. (2-tailed) .955
a. Test distribution is Normal. b. Calculated from data.
Autocorrelation Test
Model Summaryb
Model R R Square
Adjusted R Square
Std. Error of the
Estimate Durbin-Watson
1 .492a .242 .226 5.60041 1.762
a. Predictors: (Constant), Employee Performance, Use of Accounting Information, Managerial Performance
b. Dependent Variable: SME Performance
Multi-colinearity Test
Coefficientsa
Model
Collinearity Statistics
Tolerance VIF
1 Use of Accounting Information
.871 1.148
Managerial Performance .867 1.153
Employee Performance .949 1.054
22
Hetero-scedasticity Test
Coefficientsa
Model
Unstandardized Coefficients
Standardized Coefficients
B Std. Error Beta t Sig.
1 (Constant) 4.584 1.433 3.199 .002
Use of Accounting Information
-.048 .030 -.147 -1.624 .107
Managerial Performance -.004 .029 -.013 -.140 .889
Employee Performance .029 .027 .093 1.074 .285
a. Dependent Variable: absu
Multiple Regression Test
Variables Entered/Removed
Model
Variables Entered
Variables
Removed Method
1 Employee
Performance, Use of Accounting Information, Managerial Performancea
. Enter
a. All requested variables entered.
Model Summaryb
Model R R Square
Adjusted R Square
Std. Error of the Estimate
1 .492a .242 .226 5.60041
a. Predictors: (Constant), Employee Performance, Use of Accounting Information, Managerial Performance
b. Dependent Variable: SME Performance
Model Summaryb
Model
Change Statistics
R Square
Change F Change df1 df2 Sig. F Change Durbin-Watson
1 .242 14.591 3 137 .000 1.762
b. Dependent Variable: SME Performance
ANOVAb
Model Sum of Squares Df Mean Square F Sig.
1 Regression 1372.926 3 457.642 14.591 .000a
Residual 4296.946 137 31.365
23 Variables Entered/Removed
Model
Variables Entered
Variables
Removed Method
1 Employee
Performance, Use of Accounting Information, Managerial Performancea
. Enter
a. Predictors: (Constant), Employee Performance, Use of Accounting Information, Managerial Performance
b. Dependent Variable: SME Performance
Coefficientsa
Model
Unstandardized Coefficients
Standardized Coefficients
B Std. Error Beta t Sig.
1 (Constant) 21.274 2.449 8.686 .000
Use of Accounting Information
.116 .051 .183 2.290 .024
Managerial Performance .085 .049 .137 1.710 .090
Employee Performance .217 .046 .362 4.734 .000
a. Dependent Variable: SME Performance
Residuals Statisticsa
Minimum Maximum Mean Std. Deviation N
Predicted Value 28.8913 46.5261 37.1489 3.13155 141
Residual -14.15759 11.16899 .00000 5.54008 141
Std. Predicted Value -2.637 2.994 .000 1.000 141
Std. Residual -2.528 1.994 .000 .989 141