M – 23
CLUSTERING RURAL DEVELOPMENT TYPOLOGY
IN EAST JAVA PROVINCE USING LATENT CLASS ANALYSIS
Desy Setiawati, Aji Hamim Wigena, Bagus Sartono Statistics Department, FMIPA, Institut Pertanian Bogor
Abstract
To deliver the sustained and equitable regional development in Indonesia, the government must understand the characteristics of each region based on its area features, therefore, the classification of rural area must be handled to increase the precision of the development program. Since the rural area has their own specific characteristics that may lead to its rural level, the classification must ensure that the development policy fit in each area.
In this paper, we try to classify the typology of rural development that measured based on the rural potential characteristics, education, and socioeconomic. We select villages in East Java province as a scope of research area since East Java was well-known as a center of agricultural in Java, however, in 2011-2014, according to BPS, the poverty rate put east Java in 15th position in the national poverty rate.
The classification uses latent class analysis, which models the data into particular statistical distribution to identify immeasurable cluster membership between subjects with observed categorical or continuous variables. The method was able to handle overlapping model data by setting different characteristics, and the modeling results can be tested its accuracy level. Expectation Maximization (EM) algorithm is used to estimate parameters of the latent class model. The research uses PODES 2011 dataset which contains characteristics and facilities information of 8502 villages.
The result showed that using latent class analysis generates five clusters of rural area development, while the current classification from Ministry of Home Affairs only uses three typologies of rural development. The research result was able to give more detail additional information of current three classifications by dividing its typology into several detail typology classifications.
Key words: Latent Class Analysis, Maximum Likelihood, Expectation Maximization Algorithm, Rural Development Typology
INTRODUCTION
According to Indonesian long-term development plan 2005-2025 that derived from middle-term development plan 2010-2014, the village development is directed to embody the national development priority. In order to achieve the government program goals in village development, the comprehensive database that explains the village’s features to support the program development is needed.
political sovereignty of the community, community participation in development, community organizations, the performance of the village administration, coaching and supervision. Based on these indicators, typologies of rural development are classified into:
Desa swadaya, namely territory that almost all people are able to meet their needs by organizing themselves, technology, facilities and infrastructure are still lacking, isolated areas, people tend to be closed and uphold traditional customs.
Desa swakarya, namely areas where people are able to meet their own needs, technology, facilities and infrastructure began to rise, started their interaction with other residents outside the village which resulted in a change of mind and start apart from traditional customs.
Desa swasembada, areas where people, namely more advanced and able to develop all the existing potential optimally, technology, modern and complete infrastructure, people tend to be open and manage a rational relationship in human relations, has been freed from the traditional customs.
We chose East Java Province as a study area, since it's one of the agricultural centers in Indonesia, especially the largest rice producer in Indonesia, however, in 2011-2014, the poverty percentage has ranked 15th largest in the national poverty level. Therefore, the depth study in order to know the typology of rural development, according to the indicators that have been determined previously is needed. According to data from Ditjen PMD, Ministry of Home Affairs, in 2011, there are 50 percent of Desa swadaya, 49 percent of Desa Swakarsa, and only 1 percent of Desa swasembada in East Java Province.
There are some related researches in typology classification for village clustering. Lastini (2011) have done classification typology based on a community forest identifier in Ciamis with K-Means clustering method. From these studies produced two typologies of villages: potential village and no potential for the development of community forests. Additionally, Resia (2012) have done classification typology developed areas in Sampang with Hierarchical Cluster and produces three types of developed areas, which underdeveloped areas, heading advanced areas, and advanced areas. Both of these studies are advised to consider the use of other influential variables, whether numerical and/or categorical variables.
The purpose of this research is to obtain the best model for rural development typology, The research result is also able to give more detail additional information about the current Ministry of Home Affairs classifications by dividing its typology into several detail typology classifications, in order to obtain accurate data base to support rural development.
RESEARCH METHOD Method and Material
The research uses PODES 2011 dataset which contains characteristics and facilities information of 8502 villages. Some of the classification variables which have been used as the basis of typology measurement in village development based on Regulation no.12/2007.
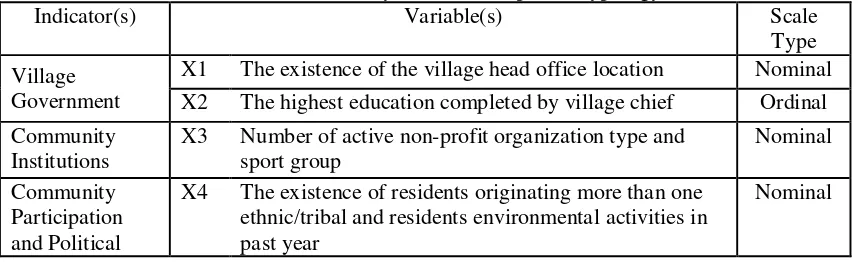
Table 1. Indicator and Variable(s) to Classify Rural Development Typology
Indicator(s) Variable(s) Scale
Type
Village Government
X1 The existence of the village head office location Nominal
X2 The highest education completed by village chief Ordinal
Community Institutions
X3 Number of active non-profit organization type and sport group
Nominal
Community Participation and Political
X4 The existence of residents originating more than one ethnic/tribal and residents environmental activities in past year
Sovereignty Society
X5 Number of program types/community empowerment activity within past three years and the existence of village consultative bureau (BPD)
Nominal
Public Health X6 Access to clinic, village health center, village sub-health center, doctors practice center
Ordinal
X7 Sources of drinking water and cooking in most village family
Nominal
X8 The plague of infectious diseases Ordinal
Public Education
X9 The existence of formal education infrastructure (elementary, junior, senior)
Nominal
X10 The existence of skills and education facility and public library
Nominal
Public Economy X11 Number of hotel/lodging type Ordinal
X12 Number and type of savings and loans institution and credit facility that received by resident in past a year
Ordinal
X13 Access to permanent/semi permanent market building and lighting at the main street village
Nominal
Infrastructure X14 The type of widest main street surface and the ability of road village crossed by four or more wheels of motor vehicle
Nominal
X15 Cellular Phone Signal and The existence Public Telephone Facility, Internet Cafe
Nominal
X16 Dispose of waste type that mostly used Nominal
X17 The existence of slums Ordinal
X18 Proportion of family subscribe the cable-phone Ordinal
X19 Family proportion as electric users Ordinal
X20 The fuel type to cooking and the existence of kerosene or LPG base
Nominal
Security and Order
X21 The amount of crime type, mass fighting (vandalism), and brothel during the last year
Ordinal
Stages of the analysis conducted in this study are:
1. Establishment of a new variable, which is a combination of several variables. It is intended that the exercise of the assumption of local independence required in latent class analysis.
2. Selection of the best model, by choosing the model with the smallest BIC value.
3. Checking the local independence assumption by bivariate residuals between two variables of all variables that exist.
4. Analysis of the results of parameter estimation with maximum likelihood estimation. 5. Comparison of the results of clustering with classification Ministry of Home Affairs.
Methodology
Latent Class Analysis
Model of latent class analysis is a technique for analyzing the relationship of data categories, namely the relationship among variables were measured with nominal and ordinal scale (McCutcheon 1987). Vermunt and Magidson (2002a) define a model of latent class analysis as a statistical method to identify clusters that are not measurable membership between subjects with observed variables, which is categorical or continuous variables. Latent class analysis models commonly referred to as finite mixture models. The method was able to handle overlapping model data by setting different characteristics, and the modeling results can be tested its accuracy level.
Let say ( , , …, ) as a vector of h variables measurement, where each variable has a conditional distribution in the exponential family, such as Bernoulli, Poisson, Multinomial, and Normal and is the value of i sample of the object/element for variable j (j = 1,2, ..., n). Line vector ′ = ( , ,…, ) which refers to the shape of the response j object(s). In latent class analysis model, vector space is assumed consist of K clusters. For every k clusters associated with which refers to the initial opportunity observations x (Moustaki and Papageorgiu 2004). Joint distribution of the observed variables is finite mixture of probability:
| = ( | )
where:
| = distribution of is given by the model parameter ( | ) = distribution given by the parameter θ, k cluster
= initial probability latent classes or clusters K on the data x, where = = probability of an object on a clusters K
K = number of cluster(s) (k=1,2,…,K), where ∑ = 1 and ∑ = 1
Nainggolan, B (2009) have done clustering dengue fever and dengue hemorrhagic fever with Latent Class Analysis (LCA), the selection process of the model using maximum likelihood estimation. Clustering results show that the criteria used for each cluster are almost the same as the WHO criteria for determining the group of dengue fever and dengue hemorrhagic fever. Additionally, Riswan (2010) have also been used Latent Class Analysis of Logistics in Indonesian student mathematics achievement grouping. Results grouping can know the background of each group is formed, it can even be done forecasting of an object into the specified group.
Expectation Maximization Algorithm
One method to estimate the parameters of the latent class analysis model is Maximum Likelihood Estimation (MLE). The log-likelihood function that is required on the MLE approach can be derived from the probability density function which defines the model. EM algorithm (Expectation Maximization Algorithm) is a tool for estimating the MLE of the parameters of the latent class analysis model. The likelihood function of the mixture latent class model is:
= log ( )
( | ) = |
maximization (M), with stages:
1. Define the initial value ( ) = ( ( ), ( ), ( ), ( )) 2. Calculate | = ∑ ( | )
3. Step E: be calculated ( | )( ); = 1, …, ; = 1, …, where ( | )( ) is conditional probability that states emerge from K clusters, where:
( | )( ) =
( )
( , )( )
∑ ( )
( , )( )
4. Step M: The maximum likelihood equation is obtained from the log-likelihood derivatives, in order to obtain a new parameter estimator.
5. Repeat steps 2 and 3 until convergent.
RESULT AND DISCUSSION
The results of the analysis stages in this study as follows:
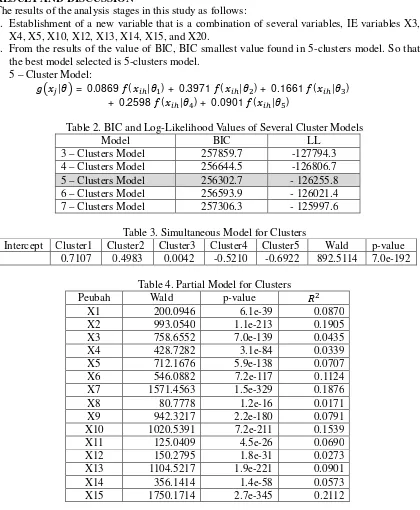
1. Establishment of a new variable that is a combination of several variables, IE variables X3, X4, X5, X10, X12, X13, X14, X15, and X20.
2. From the results of the value of BIC, BIC smallest value found in 5-clusters model. So that the best model selected is 5-clusters model.
5 – Cluster Model:
| = 0.0869 ( | ) + 0.3971 ( | ) + 0.1661 ( | )
+ 0.2598 ( | ) + 0.0901 ( | )
Table 2. BIC and Log-Likelihood Values of Several Cluster Models
Model BIC LL
3 – Clusters Model 257859.7 -127794.3 4 – Clusters Model 256644.5 -126806.7 5 – Clusters Model 256302.7 - 126255.8 6 – Clusters Model 256593.9 - 126021.4 7 – Clusters Model 257306.3 - 125997.6
Table 3. Simultaneous Model for Clusters
Intercept Cluster1 Cluster2 Cluster3 Cluster4 Cluster5 Wald p-value 0.7107 0.4983 0.0042 -0.5210 -0.6922 892.5114 7.0e-192
Table 4. Partial Model for Clusters Peubah Wald p-value
X1 200.0946 6.1e-39 0.0870 X2 993.0540 1.1e-213 0.1905 X3 758.6552 7.0e-139 0.0435 X4 428.7282 3.1e-84 0.0339 X5 712.1676 5.9e-138 0.0707 X6 546.0882 7.2e-117 0.1124 X7 1571.4563 1.5e-329 0.1876
X8 80.7778 1.2e-16 0.0171
X16 1504.5759 1.4e-319 0.3795 X17 1600.1953 2.7e-345 0.1072 X18 1482.9146 7.2e-320 0.4832 X19 196.5827 2.0e-41 0.0428 X20 1094.5165 7.2e-216 0.2733
X21 46.8482 1.6e-9 0.0094
In overall this model is quite feasible to be used. It can be seen from the p-value model for clusters < ∝ (p-value=7.0e-192). value indicates how well a variable of the model is explained by the model. The biggest variable explained by the model is proportion of families who subscribe to cable-phone (48.32%), further dispose of waste type that mostly used (37.95%). While most low variable can be explained by the model is the amount of crime type, mass fighting (vandalism), and brothel during the last year (0.94%).
3. Checking local freedom disorders can be seen from the bivariate residual value (BVR). Suppose ∝= 0.01. If BVR value > . ; (6.63) hence no interference with the freedom of local. Based on the BVR output, it can be concluded that no disruption of local freedom in 5-clusters model using 21 variables.
4. Table 5. The Expectation Value of The Parameter Estimation Results
Based on the output above, the characteristics of the clustering result compared to Ministry of Home Affairs classification are described as follows:
- Cluster 1, 2, and 5 show the characteristics approach to desa swadaya, where:
Cluster 1, which the administration of the village is quite poor, community institutions are only slight, community participation in supporting rural development is still lacking, access to public health facilities is still relatively difficult, and road infrastructure, telephone, garbage disposal, electricity subscription, and cooking fuel are inadequate.
Cluster 2, which the institutions to support the economy in the village are still
cl ass 1 cl ass 2 cl ass 5 swadaya cl ass 4 swakarya cl ass 3 swasembada
X1 2.6579 2.9746 2.9934 2.9258 2.9920 2.9248 2.9900 2.9703
X2 5.0101 5.4434 5.2445 5.3074 5.6630 5.5490 6.4113 6.7129
X3 2.2664 4.4120 4.0344 3.1312 5.2312 5.0944 5.0400 7.2773
X4 2.9577 2.8002 3.0761 2.6924 3.3418 3.5079 3.6364 3.9208
X5 4.6864 5.2753 5.6059 5.1969 5.5924 5.4866 4.9071 5.6337
X6 2.7619 3.1885 2.9905 3.0686 3.2478 3.2461 3.4197 3.3168
X7 2.8878 2.9562 2.4654 2.8066 2.9852 3.0477 3.5594 3.4654
X8 4.6060 4.6316 4.3431 4.4760 4.4840 4.5332 4.3086 4.4258
X9 6.6881 5.7119 6.2110 5.6934 6.6559 6.7731 6.9890 7.8713
X10 1.0456 1.1165 1.1923 1.0938 1.6862 1.7196 2.4752 3.4357
X11 1.0001 1.0004 1.0338 1.0090 1.0419 1.0715 1.2799 1.5247
X12 2.3826 1.9575 1.9512 2.0635 2.0987 2.0605 2.3134 2.6931
X13 2.4508 3.6184 2.7801 3.2035 3.2602 3.2810 3.3036 2.7128
X14 7.0839 7.6508 7.4553 7.5087 7.8335 7.8012 7.9889 7.9802
X15 5.2022 6.8326 5.4242 6.2035 8.2836 8.0320 9.4017 9.7030
X16 1.7249 1.9757 1.8124 1.9008 2.0228 2.1460 2.9087 2.7327
X17 2.9932 2.9906 2.9778 2.9851 2.9751 2.9420 2.7459 2.6733
X18 1.0589 1.3531 1.0954 1.2774 1.8172 1.8131 2.7005 2.5547
X19 4.6133 4.9141 4.8635 4.8522 4.9144 4.9015 4.8770 4.8614
X20 3.1245 5.7128 3.5286 4.7433 6.2469 6.0351 6.9779 6.8713
inadequate.
Cluster 5, which the education of village government officials below the average, poor public health, the economy of the community less developed, and road infrastructure, telephone, garbage disposal, and cooking fuel are inadequate.
- Cluster 4 shows characteristics approaching the desa swakarya, especially in terms of the village administration, community institutions, public education, and infrastructure. - Cluster 3 shows characteristics approaching desa swasembada, however, certain
characteristics such as civil society and community education approaching to desa swakarya.
CONCLUSION AND SUGGESTION
Based on the research result of clustering rural development typology using Latent Class Analysis (LCA), it can be concluded as follows:
1. From the results of rural development typology clustering using LCA has produced five clusters model. Three clusters approach to the characteristics of desa swadaya, one cluster approaches to the characteristics of desa swakarya, and one cluster approaches to the characteristics of desa swasembada. This result was able to give more detail additional information of current three classifications from Ministry of Home Affairs.
1-clust er 2-cl ust er 5-cl uster T otal
LCA 748 673 2655 4076 3525 901
M ini stry of Home Aff airs
cl assi fi cat ion 4236 4165 101
Desa Sw adaya Desa
Swasembada Desa
Home Affairs classification is quite high, therefore, the LCA can be used as a tool for classifying rural development typology.
3. Need for further studies on the best model selection process and the handling of missing information on the model of LCA.
REFERENCES
Agusta, I. (2014, October 24). Transformasi Desa Indonesia 2003-2025. [Web log post]. Retrieved from
http://www.perhepi.org/wp-content/uploads/2014/11/Transformasi-Desa-Indonesia-2003-2025_Dr.-Ivanovich-Agusta.pdf
Hagenaars, J.A., & McCutcheon, A.L. (2002). Applied Latent Class Analysis. Cambridge, UK: Cambridge University Press.
Indonesian Ministry of Home Affairs. (2012). Profil Desa dan Kelurahan 2011. Jakarta, Indonesia: Author.
Linzer, D.A. & Lewis, J.B. (2014, July 2). 2014. Package ‘poLCA’: An R Package for Polytomous Variable Latent Class Analysis. Retrieved from
http://cran.us.r-project.org/web/packages/poLCA/poLCA.pdf
McLachlan, G.J. & Krishnan, T. (2008). The EM Algorithm and Extensions. New Jersey, USA: A John Wiley & Sons Inc Publication.
Nainggolan, B. (2009). Perbandingan Analisis Kelas Laten Dengan Kriteria WHO Untuk Penggerombolan Pasien Demam Dengue (DD) dan Demam Berdarah Dengue (DBD) (Masters theses). Available from Bogor Agricultural University repository.
Riswan. (2010). Analisis Logistik Kelas Laten (Pengelompokan Prestasi Matematika Siswa Indonesia Berdasarkan Hasil Survey TIMSS) (Masters theses). Available from Bogor Agricultural University repository.
Vermunt, J.K., & Magidson, J. (2005). Technical Guide for Latent Gold 4.0: Basic and Advanced. Retrieved from