THE POWER OF PRODUCT LEADERSHIP IN GENERATING
CUSTOMERS’ INTENTIONS TO BUY:
THE CASE OF DAGADU
Markus Surkamta Eric Santosa
Unisbank Semarang (ericsantosa.2010@gmail.com)
ABSTRACT
Marketing products is frequently not easy. Besides the need for brands and/or products to be recognized by consumers, they must be prominent among the other brands and/or products, which hopefully in turn will develop an interest in them and the intention to buy. The prominent brands and/or products usually become so because they comprise of a number of factors, such as good quality, good design, and good customer value. In addition, the performances of the brands and/or products really meet the consumers’ expectations, and conform to the consum-ers’ perceptions of them. While the consumconsum-ers’ intentions to buy are generally generated by their attitudes and subjective norms, the purpose of this study is to investigate the influence of product leadership in producing the customers’ intention to buy through the customers’ per-ception of value and quality. Data were acquired from a sample which consisted of 100 respondents who were interested in and wanted to buy Dagadu T-shirts. The sample itself was withdrawn by using the judgment method. The data were then analyzed using Amos 5.0 and SPSS 16.0. The result showed that product leadership affected consumers’ perception of value and quality, which sequentially generated the consumers’ intention to buy through the consum-ers’ attitude and subjective norm.
Keywords: product leadership, perceived quality, perceived value, intention to buy
INTRODUCTION
The market for consumption goods has recently been coloured by new products, either belonging to ‘new to the world’ products, new product lines, additions to existing product lines, improvements and revisions to existing products, repositioning or cost reductions (Kotler, 2000). Since the products are very similar to one another, this leads to tight competition, which pushes companies to strive hard to attain a larger market share by employing precise and accurate strategies. As a consequence, those who make mistakes in deciding their strategy will likely lose. It is very common that precise and accurate strategy is decided on by study of a situation analysis (Hunger & Wheelen, 2001; Thompson, et al., 2010). This comprises of market analysis, particularly about consumers’ behavior and competitors’ possible actions. It should be stressed that a good marketing strategy will work well if the marketers can identify which market
is to be defined as the target market (Kotler, 2000). It makes it easier for the company to be more effective, and possess a greater under-standing of the market’s characteristics, since the market has been closely scrutinized.
Markets have various characteristics. Each can differ from another because of such factors as income, education, gender, religion, geo-graphical aspect, and similar, which lead to variations (Cannon, et al., 2008; Kotler & Keller, 2006). Likewise, the strategies employed by competitors make it difficult to retain custom-ers. As a consequence, a full understanding of the target market, and consideration of competi-tors’ actions are factors that need to be consi-dered before introducing products.
superior and distinctive (Cravens, 2000). The competitive advantage makes the product easy to differentiate from the others. It absolutely helps customers to make a choice, since similar prod-ucts confuse customers. Customers want those that match their needs and preferences. How-ever, those that match the market’s need do not necessarily have a large market, since only those that are diverse and also superior will be promi-nent.
As a matter of fact, customers need diversity. Even though a particular product meets the demands for high quality, the absence of compa-rable products lead customers to dissatisfaction. The need for variety leads to diversification. If a company is able to understand what the market likes, and produces various products to meet these needs, it may lead to the company occu-pying a dominant position. Under condition, the company’s technology should be competent, unless the market’s respect will be of jeopardy.
The situation could be worsened if a new potential competitor appears, who may offer items or services of a higherquality. The existing company’s products might be inferior, which could result in a movement of customers to the better product. In such a situation, the role of the Research & Development (R & D) department becomes prominent. Innovation becomes a priority, not only for the creation of a new prod-uct, but also for the modification of existing items to give them a higher added value to the customers (Kotler & Keller, 2006).
In such situations, products are also frequently imitated. Those belonging to the dominant producer will be immediately copied, in the hope of emulating their success. These products are usually created by market followers to utilize market demands. They are commonly offered at a lower price. Even though the original products are still superior, if the company offering them does not seriously take this into account, a decrease in its market share is almost inevitable.
The threat of similar products, or imitative products and substitutive products, makes any company that wants to be and remain a market
leader work hard. Its products must possess more competitive advantage. The product leadership priority needs the company to under-stand what the market likes, needs, and wants, and later on to apply them to its products.
Recognizing how customers think in making their buying decisions is also crucial. Though the message has obviously described that the prod-uct is in accordance with the market’s prefe-rence, it might still be perceived in a different way. Therefore, complying customers’ percep-tionsthat the product is what it has been claimed to be, is not easy. However, if the product really is a high technology item, with high quality, high customer value and well-designed, as the market wanted, the similarity in perception is unavoidable.
Such a market response has a great influence on individuals’ buying decisions. First of all, it gives self-confidence that what he/she is buying is correct, which is very beneficial. In other words, the customer’s attitude toward the prod-uct is favorable. Secondly, the customer’s conviction becomes greater since his/her peers, such as couples, girl/boy friends, family, friends and the like, support his/her decision (the sub-jective norm). If the customer’s perceived restraints, such as the price of the product, is within their spending range, the increase in the intention to buy is inevitable.
LITERATURE REVIEW
Product Leadership. The description of product leadership is as follows. MISC Maga-zine (2014) define product leadership as: “Offering customers leading edge products that consistently enhance the customers’ use or application of the product, thereby making its rivals’ goods obsolete”. While Hopkin (2011a) had a different viewpoint. He suggested that product leadership was the ability of the product manager to lead the product team. If the product manager succeeded, the product succeeded. With good leadership, ideas flow, solid products are released and sales increase. Hopkin (2011b) also highlighted that the product manager’s role was very important. The product manager played a key role in the success of the company.
Kalypso
(2011) saw product leadership as a new
emerging strategy, leaving behind
traditional operating models such as customer intimacy and operational excellence, which relied upon product superiority, by delivering innovative products that met ever-evolving customers’ needs.Creating a superior product is not just about how to make a new product, since a new product might be developed from an existing product by adding new features or modifying it. It is a multi-layered process incorporating several key steps, such as analyzing the existing products and their competitors, and studying market trends to meet the future customers’ expecta-tions.
When poorly thought out products reach the market, they are likely to fail and disappear. Such an event may happen when a high-level executive pushes a favorite idea through, inspite of negative market research findings, or the market size being over estimated (Kotler, 2000).
Based on the literature mentioned, the prod-uct leadership variable can be clearly seen as: “A
n approach to the market,
which relies upon product superiority by delivering innovative products that meet ever-evolving customers’needs
.” The variable is
operated through thefollowing indicators i.e. (1) product’s variety, (2) product’s competitiveness, (3) superior quality, and (4) easy operating.
Perceived Value. Kotler & Keller (2006: 133) defined what perceived value meant, that is: “The difference between the prospective customer’s evaluation of the benefits and all the costs of an offering and the perceived alterna-tives.” The other meaning of perceived value, in fact, can be determined word-by-word, that is ‘perceived’ and ‘value’. The word ‘perceived’ refers to perception which means the way a con-sumer looks at a particular object (Kotler, 2000). The word ‘value’ refers to the total customer value, that is: “The perceived monetary value of the bundle of economic, functional and psycho-logical benefits customers expect from a given market offering” (Kotler & Keller, 2006: 133). If someone is talking about total customer value, he/she cannot ignore the role of total customer cost as a part which greatly contributes to the total meaning of total customer value. The total customer cost itself defined as: “The bundle of costs customers expect to incur in evaluating, obtaining, using and disposing of the market offering, including monetary, time, energy, and psychic costs” (Kotler & Keller, 2006: 133).
So, for the sake of this study, the meaning of perceived value can be established as follows, that perceived value is based on a difference between what a customer gains and what a cus-tomer loses from any goods or services. Mean-while, the value which a customer will obtain can be increased by magnifying its functional or emotional benefits. In addition, it also can be increased by reducing its cost or by a combina-tion of things. For instance, there are 2 (two) products, A and B. A consumer will prefer A if the ratio between A to B is greater than B to A. On the contrary, B is the choice if the ratio A to B is smaller than B to A. Thereby, the variable can be operated through the indicators that fol-low, (1) good design, (2) instillation of pride, (3) identity, and (4) achievable price.
bear on its ability to satisfy stated or implied needs” (Kotler & Keller, 2006: 138).
Companies commonly strive to satisfy con-sumers by producing high-quality goods. This is so if what the customers accept is equal to what they expect. It is more so if expectations can be exceeded. The total of the features and characte-ristics of a product or service which is able to meet the needs is known as the conformance quality, while the total features and characteris-tics of a product or service which satisfies com-panies’ promises is called performance quality (Kotler & Keller, 2006). The term perceived quality itself can be defined as the way a con-sumer looks at the total of the features and characteristics of a product or service that bear on its ability to satisfy stated or implied needs. The variable is operated through the following indicators (1) good material, (2) fade-proof, (3) durable, (4) unique, and (5) tasteful color.
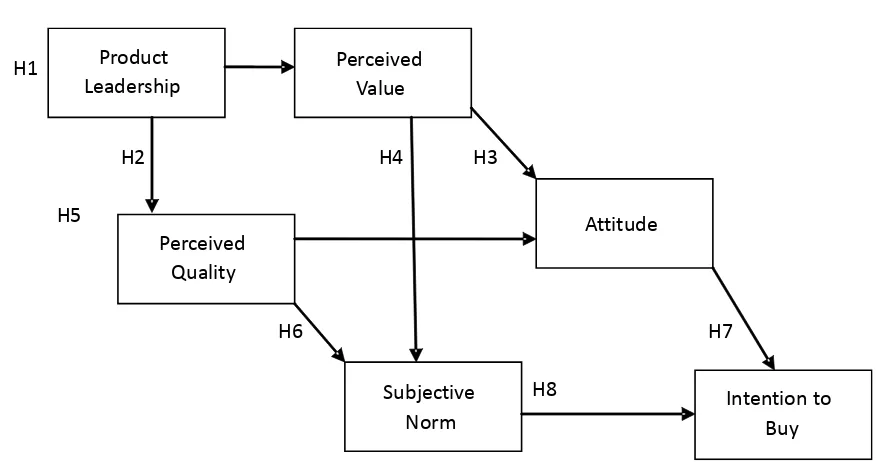
The Relationship between Product Leader-ship, Perceived Value and Perceived Quality. Commonly, any company that wants to be a market leader needs to create superior products (Kalypso, 2011). They should meet the markets’ needs and wants, and be characterized by their superiority and distinctiveness (Cravens, 2000). If so, then the products are assumed to be able to overcome competitors’ offerings and the com-pany is worthy to stand as a product leader (Hopkin, 2011; Kalypso, 2011). While a product represents a set of attributes and benefits (Peter & Olson, 2002), in the context of arousing the consumers’ needs, they are supposed to act as stimuli. Meanwhile, the superior products which have superior features demonstrate a company’s strategy to invest in superior values (Kotler, 2000; Kotler & Keller, 2006), which in turn, generate a favorable perceived value and perceived quality. Therefore, hypotheses can be drawn as follows:
H1: Product leadership influences perceived value.
H2: Product leadership influences perceived quality.
Attitude, Subjective Norm, and Behavioral Intention. These three variables will be clarified
in accordance with what Ajzen (1991) sug-gested, in which they actually were components of his theory i.e. the Theory of Planned Behavior (TPB). In this theory, the emergence of the behavioural intention could be predicted from one’s attitude and subjective norm (Ajzen & Fishbein, 1980; Ajzen, 1991).Attitude itself usually consisted of two components, i.e. out-come belief and outout-come evaluation. Outout-come belief relates to a tendency for a particular out-come. The power of this outcome belief is magnified by the outcome evaluation, which significantly contributes to the form of the beha-vioural belief. It is understandable that only a significant outcome will affect an individual’s attitude.
The subjective norms appear as normative beliefs and as motivation to comply. The nor-mative belief is concerned with what other people want him/her to do, and his/her motiva-tion to comply with this. As in attitude, the two factors should be multiplied to get greater power. Social pressure will be taken into account if appropriate to his/her motivation to comply.
The three variables can be clarified as follows:
a. Behavioural Intention (BI), is a want corre-lating with ‘self’ and an action in the future. Some people may have an opinion that an intention is really a plan to do something with regard to a certain objective. A beha-vioural intention is generated primarily by a decision making process, which integrates factors such as the attitude towards beha-viour and subjective norms, to evaluate alternatives, which in turn leads to choosing one of them. The behavioural intention varies in its power, depending on the proba-bility of actually doing something.
b. Attitude toward behaviour or action (Ab),
∑
== n
1 i
ei bi Ab
bi= Behavioral belief ei= Outcome evaluation
c. Subjective Norms, exemplify one’s
percep-tion about what other people think what he/she should do. A normative belief is con-cerned with what other people want him/her to do and his/her motivation to comply. The formula is as follows:
∑
== m
j
MCj NBj SN
1 .
NB = Normative beliefs MC = Motivation to comply
The Relationship between Perceived Value, Perceived Quality, Attitude, and the Subjective Norm. Kotler & Keller (2006: 133) suggested that perceived value was: “The difference between the prospective customer’s evaluation of the benefits and all the costs of an offering and the perceived alternatives.” On the other hand, perceived quality was the way a consumer saw the quality (Kotler, 2000). Any perception will be automatically administered by either affective or cognitive systems, which in turn generated outcomes, such as attitude (Peter & Olson, 2002). Also, an attitude can be produced by knowledge and needed perception, along with direct experience and information related to the object (Schiffman & Kanuk, 2000).
While superior products generate a favoura-ble responsein a particular consumer, it may also happen regardless of the number of consumers present in the market. If so, a similar perception by the consumers may be present in the market, which can lead to favourable responses and attitudes later on among the consumers. Conse-quently, the consumer will be convinced that what he/she likes about the product will be sim-ilar to the other consumers. Furthermore, he/she is ready to comply with what he/she will do with the other customers’ wants. As a result, the consumer’s subjective norm is apparently
well-built. So, four hypotheses can be drawn as follows:
H3: Perceived value influences attitude
H4: Perceived value influences the subjective norm
H5: Perceived quality influences attitude
H6: Perceived quality influences the subjective norm
The Relationship between Attitude, Subjec-tive Norm, and Intention to Buy. Referring to the Theory of Planned Behaviour, it is known that behavioural intention is predicted by attitude and the subjective norm (Fishbein & Ajzen, 1975; Ajzen, 1991). Thereby, hypotheses can be formulated as follows:
H7: Attitude influences the intention to buy H8: The subjective norm influences the
inten-tion to buy
RESEARCH MODEL
Referring to the theory and hypotheses, a research model was drawn as follows (see Figure 1). The model was based on the phenomena arising in the market in which the relationship between the variables could hopefully be benefi-cial in developing the theory, even though some variables, i.e. attitude, the subjective norm and behavioural intention refer to the term TPB. Thus, it was neither similar to, nor an extension of, TPB.
METHOD
through a factor analysis, and then Cronbach’s alpha analysis. Further, data were analyzed by employing Amos5.0.
RESULT AND DISCUSSIONS
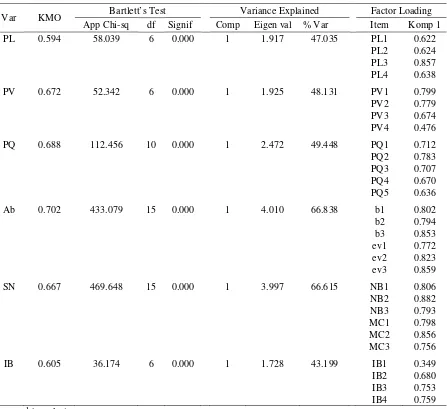
Test of Validity. A test of the KMO and a Bartlett’s test were first conducted to check whether the sample adequacy met the pre re-quirements and whether the factor analysis could be employed. Table 1 shows that all the variab-les i.e. Product Leadership (PL), Perceived Value (PV), Perceived Quality (PQ), Attitude toward behaviour (Ab), Subjective Norm (SN), and Intention to Buy (IB) had sample adequacy, which was denoted by all of them having scores of more than 0.5 (Ghozali, 2008). Likewise, the outcome of the Bartlett’s test showed a favorable condition, denoted by the significance of Chi-square, indicating that the exercise of factor analysis was certainly approved (Ghozali, 2008).
The total variance explained all the variables (PL, PV, PQ, Ab, SN, and IB), and demonstrated that a rotation was not required, since only one component had an eigenvalue score > 1. Thereby, the assessment of validity is pleased from component 1 only, which points to the indicators, since their loading factor >that most indicators i.e. Product Leadership1 (PL1), Prod-uct Leadership2(PL2), ProdProd-uct
Leader-ship3(PL3), Product Leadership4(PL4), Per-ceived Value1(PV1), PerPer-ceived Value2(PV2), Perceived Value3(PV3), Perceived Quali-ty1(PQ1), Perceived Quality2(PQ2), Perceived Quality3(PQ3), Perceived Quality4(PQ4), Perceived Quality5(PQ5), behavioral belief2 (b2), behavioral belief3(b3), outcome eva-luation1 (ev1), outcome evaluation2(ev2), outcome evaluation3(ev3), Normative Belief1 (NB1), Normative Belief2(NB2), Normative Belief3(NB3), Motivation to Comply1 (MC1), Motivation to Comply2 (MC2), Motivation to Comply3 (MC3), Intention to Buy2 (IB2), Intention to Buy3(IB3), Intention to Buy4(IB4)were valid indicators, since their loading factors were>0.5 (Gozali, 2008),But with the exception of Perceived Value4(PV4) and Intention to Buy1 (IB1) which were< 0.5. However, according to Ferdinand’s basis, the PV4 still included a valid indicator, since Ferdinand (2002) only required 0.4 as the border line. A different situation exists for IB1, with a loading factor of< 0.4 which must cause it to be rejected.
Test of Reliability. The Cronbach’s alpha analysis was exercised by employing SPSS 16.0. The result showed that most variables were reli-able, indicated by the Cronbach’s alpha score > 0.6 (Ghozali, 2008) (Table 2). An exception is
H1
H2 H4 H3
H5
H6 H7
H8 Product
Leadership
Perceived Value
Attitude Perceived
Quality
Subjective Norm
Intention to Buy
the IB variable (in which the IB1 had already been dismissed) as its Cronbach’s alpha score < 0.6. However, it was assumed to be reliable since its score was close to 0.6.
The Structural Equation Model. The model had one initial independent variable (PL) and five dependent variables (PV, PQ, Ab, SN, IB) of which four were treated as independent variables to some extent as well. Since the pur-pose of the study was to understand the relation-ship between the one initial independent variable (PL) and the primary dependent variables (PV, PQ), likewise among the four dependent variables, separately and simultaneously, a
structural equation modelwas employed (Hair,et al., 1995).
Table 2. Test of Reliability
PL, PV, PQ, Ab, SN, and IB Variables
Variables indicators Cronbach’s
Alpha
PL PL1, PL2, PL3, PL4 0.614
PV PV1, PV2, PV3, PV4 0.606
PQ PQ1, PQ2, PQ3, PQ4, PQ5 0.738
Ab b (b1, b2, b3) 0.813
ev (ev1, ev2, ev3) 0.816
b+ev 0.900
SN NB1, NB2, NB3 0.851
MC1, MC2, MC3 0.824
NB + MC 0.898
IB IB2, IB3, IB4 0.594
Source: Analysis Data
Table 1. Test of KMO, Bartlett’s Test, Variance Explained and Factor Loading
PV, PQ, Ab, SN, IB, Variables
Var KMO Bartlett’s Test Variance Explained Factor Loading
App Chi-sq df Signif Comp Eigen val % Var Item Komp 1
PL 0.594 58.039 6 0.000 1 1.917 47.035 PL1 0.622
PL2 0.624
PL3 0.857
PL4 0.638
PV 0.672 52.342 6 0.000 1 1.925 48.131 PV1 0.799
PV2 0.779
PV3 0.674
PV4 0.476
PQ 0.688 112.456 10 0.000 1 2.472 49.448 PQ1 0.712
PQ2 0.783
PQ3 0.707
PQ4 0.670
PQ5 0.636
Ab 0.702 433.079 15 0.000 1 4.010 66.838 b1 0.802
b2 0.794
b3 0.853
ev1 0.772
ev2 0.823
ev3 0.859
SN 0.667 469.648 15 0.000 1 3.997 66.615 NB1 0.806
NB2 0.882
NB3 0.793
MC1 0.798
MC2 0.856
MC3 0.756
IB 0.605 36.174 6 0.000 1 1.728 43.199 IB1 0.349
IB2 0.680
IB3 0.753
IB4 0.759
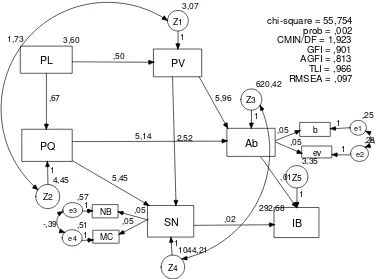
An initial structural equation model was drawn by connecting all the variables as hypothesized. This model was not thoroughly appropriate to what was expected, since all the indicators, i.e. Chi-Square/Prob, Cmin/df, GFI, AGFI, TLI, RMSEA, did not meet the criteria. Consequently, a modified model was generated
by connecting e1 ↔ e2, e3 ↔ e4, z1 ↔ z2, and z3 ↔ z4. This modified model seemingly pro-duced better scores than before (Table 3, Figure 2).
Table 3 denotes that although not all the model’s indicators meet the criteria, some
(Cmin/df, GFI, and TLI) equal the requirements. It meant that the model’s data were in accordance with the structural parameters. As a consequence, the model was worthy of use.
Evaluation of Assumptions. The evaluation of normality was first carried out, employing a univariate test (Ferdinand, 2002; Ghozali, 2008). It scrutinized the skewness value to see whether its critical ratio (c.r) values were less than or equal to ± 2.58. As a matter of fact, all the c.r values were less than ± 2.58. This indicated that univariately the data distribution was normal. To check further, a multivariate test was also carried
Table 3. The Second Indicators Resulted from Modification of the Model
Indicators Initial Scores Second Scores Thresthold Justification
Chi-square/Prob 258.151/0.000 55.754/0.002 29.588/p>0.05 Not meet the criterion
Cmin/df 7.823 1.923 ≤ 5 Meet the criterion
GFI 0.727 0.901 High Meet the criterion
AGFI 0.544 0.813 ≥ 0,9 Not meet the criterion
TLI 0.750 0.966 ≥ 0,9 Meet the criterion
RMSEA 0.263 0.097 0.05 to 0.08 Not meet the criterion
Source: Data Analysis
3,60
PL PV
PQ Ab
SN IB
,50
,67
5,14
5,96
2,52
,02
5,45 ,01
3,07
Z1
1
4,45
Z2
620,42
Z3
1
1044,21
Z4
3,35
Z5
1 1
1
b
ev
NB
MC
,25
e1
,28
e2
,57
e3
,51
e4
,05 ,05 1
1
,05 ,05
1
1 chi-square = 55,754
prob = ,002 CMIN/DF = 1,923 GFI = ,901 AGFI = ,813 TLI = ,966 RMSEA = ,097
-,39
-,2
292,68 1,73
out. The result of the data analysis showed that the multivariate critical value was13.687. It was more than the 2.58 required. As a result, the normality test needed a bootstrap analysis.
A Bollen-Stine bootstrap analysis illustrated the following, (a) the model fitted better in 446 bootstrap samples, (b) it fitted equally well in 0 bootstrap samples, (c) it fittedbadly, or failed to fit in 54 bootstrap samples, (d) testing of the null hypothesis showed that the model was correct, Bollen-Stine bootstrap p = 0.110. As a matter of fact, the probability resulted (p = 0.110) indicated that the model was not rejected. Therefore, although multivariately the data’s distribution were abnormal, it was worthy of use.
The next evaluation of assumption was about the outliers which was carried out by a univa-riate test or a multivauniva-riate test (Ferdinand, 2002). The univariate test was successfully exercised by firstly converting the data to Z-scores, in which they should be less than ± 3.0 (Hair, et al.,1995). The result indicated that some variables such as PL1, PV1, NB3, and IB2 were more than ± 3.0 which points to outliers. To check further, it required a multivariate outliers test. It demon-strated, by determining the Chi-square value which subsequently could be used as the upper limit, which could be calculated by searching on aChi-square table, whose degree of freedom was equal to the amount of variables employed, which were 10, under the degree of significance
(p) = 0.001. The Chi-square value found was
29.588. In fact, all the scores for Mahalanobis distance were less than 29.588, except for the numbers 53, 29, and 33 which inevitably sug-gested outliers. However, because of no specific reason to dismiss these, the outliers were likely worth using(Ferdinand, 2002).
Further evaluation of assumption was for multicollinearity and singularity. According to the Amos output, the determinant of the sample covariance matrix was equal to162,084,353. The value is more than zero. As a consequence, it belonged to no multicollinearity and singularity categories.
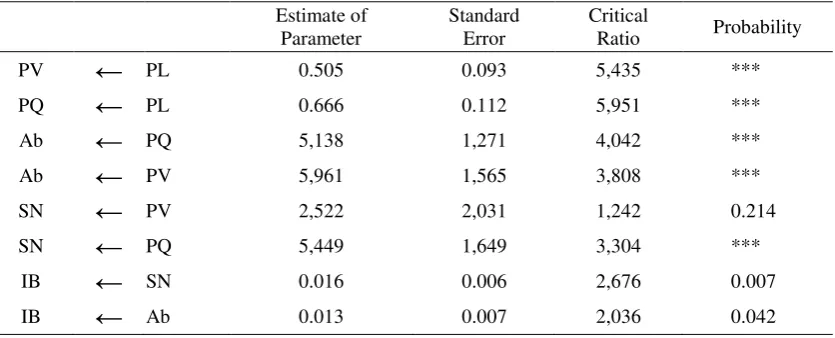
Test of Hypotheses. The regression weights output indicated that the influence of PL on PV and PQ were significant. Likewise, for the influ-ence of PQ on Ab and SN. In addition, it was so for the case of the influence of Ab and SN on IB, and the influence of PQ on SN. Conversely, the influence of PV on SN was not significant (p = 0.214) (Table 4). The result showed that all the hypotheses proposed were supported by the empirical data, except for H4.
Discussion. The appropriateness of the empirical data with the hypotheses i.e. product leadership influences perceived value and perceived quality, was in accordance with the theory and facts. In other words, it was pertinent to the theory that (a) the perceived value and the perceived quality were relevant to the product’s superiority (Hopkin, 2011a; Kalypso, 2011), (b) the superior products were characterized by their
Table 4. Regression Weights: (Group number 1 - Default model)
Estimate of Parameter
Standard Error
Critical
Ratio Probability
PV
←
PL 0.505 0.093 5,435 ***PQ
←
PL 0.666 0.112 5,951 ***Ab
←
PQ 5,138 1,271 4,042 ***Ab
←
PV 5,961 1,565 3,808 ***SN
←
PV 2,522 2,031 1,242 0.214SN
←
PQ 5,449 1,649 3,304 ***IB
←
SN 0.016 0.006 2,676 0.007IB
←
Ab 0.013 0.007 2,036 0.042distinctiveness, which offered a superior value as well (Cravens, 2000), (c) a company’s strategy to provide excellent features inevitably made a large contribution to the perceived value or the perceived quality (Kotler, 2000; Kotler & Keller, 2006). As a consequence, customers positively appreciate the value and the quality presented.
Meanwhile, some other hypotheses such as (a) perceived value influences attitude, (b) per-ceived quality influences attitude, and (c) perceived quality influences the subjective norm, were all positively supported by the empirical data, and were appropriate to some factors which are, firstly, the overall evaluation of the custom-ers’ values and the product quality offered was positively appreciated by the customers (Peter & Olson, 2002), secondly, a favourable response supported by knowledge, direct experience and other related information, obviously generated customers’ positive attitudes (Schiffman & Kanuk, 2000),thirdly, the customers’ conviction of other people’s perception about the quality offered, increased their perception as well about the same product (Ajzen, 1991).
Conversely, the hypothesis which stated per-ceived value influences the subjective norm, was not supported by the empirical data. It might be scrutinized as follows, since the subjective norm exemplified the customers’ perception about other peoples’ thoughts of what he/she should do (Ajzen, 1991), while the different ways a consumer looks at an object generates a distinct perception (Kotler, 2000), thereby, a particular customer might not follow what other people suggest. As a result, whatever meaningfulness a product has for one person, it might be ignored by others.
Whereas the hypotheses of attitude influence the intention to buy, and the subjective norm influences the intention to buy, were both supported by the empirical data. This can be explained by the intention to buy, while being determined by attitude (Fishbein & Ajzen, 1975), and likewise shaped by the subjective norm, obviously suggests that whatever happens to the attitude or the subjective norm, the intention to buy apparently also follows, and the
alteration of intention to buy was in accordance with the change in them.
IMPLICATION
While product leadership denotes a high customer value, the result of the study highlights the important role of the superiority and the dis-tinctiveness of the products offered. The signifi-cant influence of product leadership on perceived value or perceived quality puts products whose customer value is both superior and distinctive, in a strategic position. This is likely to not only burden the marketing depart-ment, but also other departments such as R & D and the production department, which should be more active in submitting information about competitors and the markets’ preferences. Even with the cooperation of other departments to get what the market wants for the future customers’ values so the company can plan its products, this is absolutely necessary. Therefore, all parts of the company should prioritize the company’s concerns, which include a sense of belonging, and high levels of participation and cooperation.
The significant influence of perceived qual-ity on attitude or the subjective norm, and the significant influence of perceived quality on attitude, gives signals that they are in truth a logical consequence of the consumers’ percep-tions of both the quality and the value of partic-ular products. A favourable perception of prod-ucts inevitably generates a favourable attitude and a favourable subjective norm as well. There-fore, the marketing department should cautiously examine the market, particularly to competitors actions in the market, and should take such observations into account. The communication strategy to be used should be selected depending on a precise market understanding.
inti-macy techniques (Santosa, 2011). Both contri-bute to forming a brand image (Kotler & Keller, 2006) which in turn can apparently generate favourable customers’ attitudes and favourable subjective norms.
REFERENCES
Ajzen, I,1991. The Theory of Planned Behavior, Organizational Behavior and Human Deci-sion Processes.50. 179-211.
Ajzen, I, and M. Fishbein, 1980.Understanding Attitudes and Predicting Social Beha-vior.Englewood Cliffs, NJ: Prentice Hall. Cannon, J.P., W.D. Perreault Jr, and F.J.
McCarthy, 2008.Basic Marketing: A Global Managerial Approach. Diterjemahkan oleh Afia R Fitriati dan Ria Cahyani. Jakarta: Penerbit Salemba Empat.
Cooper, D.R.. and P.S. Schindler, 2008.Business Research Methods. Boston: McGraw-Hill/Irwin.
Cravens, D.W, 2000. Strategic Marketing. 6th ed. Boston: Irwin-McGraw-Hill.
Ferdinand, A, 2002. Structural Equation Modeling Dalam Penelitian Manajemen. Semarang: BP Undip.
Fishbein, M and I. Ajzen. (1975). Belief, Atti-tude, Intention, and Behavior: An Introduc-tion to Theory and Research. Reading, MA: Adisson-Wesley.
Ghozali, I, 2005.Model Persamaan Struktural: Konsep dan Aplikasi dengan Program Amos Ver 5.0. Semarang: BP Undip.
Ghozali, I. 2008. Model Persamaan Struktural: Konsep dan Aplikasi dengan Program Amos Ver 16.0. Semarang: BP Undip.
Hair, et al., 1998.Multivariate Data Analysis. New Jersey: Prentice Hall.
Hopkin, M.R, 2011a.Product-leadership. Avail-able at: http:leadonpurposeblog.com accessed January 24, 2011.
Hopkin, M.R, 2011a.Product-leadership. Avail-able at: http:leadonpurposeblog.com ac-cessed January 24, 2011.
Hopkin, M.R., 2011b. Five-rules-for-executive-product-leadership. Available at: http: lea-donpurposeblog.com accessed July 9, 2011.
Hunger, J.D. and T.L. Wheelen, 2001.Strategic Management. Diterjemahkan oleh Julianto Agung. Yogyakarta: Penerbit Andi.
Kalypso, 2011. Capabilities, Services, Product-leadership, Transformation. Available at: http:kalypso.com, capabilities, services, product-leadership-transformation accessed at May 22, 2011.
Kotler, P, 2000.Marketing Management. The Millennium Edition. Upper Saddle River, NJ: Prentice-Hall, Inc.
Kotler, Pand K.L, Keller, 2006.Marketing Man-agement.. 12th ed. Upper Saddle River. New Jersey: Pearson Education Inc.
MISC, 2014. In Pursuit of Customer Intimacy and Operational Excellence. Available at: http://www.miscmagazine.com/in-pursuit- of-customer-intimacy-and-operational-excellence/ accessed at May 8, 2014.` Peter, J.P. and J.C, Olson, 2002.Consumer
Behaviourand Marketing Strategy.6th ed. New York: McGraw-Hill Company.
Santosa, E, 2011.Pengaruh Product Leadership, Service Excellence, dan Customer Intimacy Terhadap Brand Equity dan Dampaknya Terhadap Customer Loyalty.Unpublished. ______, 2013. Can Product Leadership be a
Pre-dictor of Customer Loyalty? The Case of the Influence of Product Leadership, Service Support Excellence, and Customer Intimacy to Brand Equity and the Effect of Brand Equity to Customer’s Loyalty, Junal Inter-nasional Ekonomi dan Bisnis (JIEB) UGM, 28.3.
Schiffman, L.G.and L.L, Kanuk, 2000, Con-sumer Behavior. 7th ed. London: Prentice-Hall International Ltd.
Thompson, A.A, et al., 2010. Crafting and Executing Strategy: The Quest for Competi-tive Advantage, 17th ed. Boston: McGraw-Hill Irwin.
Trieha, Utroq , 2014. Branding ‘Dagadu’, Inspi-rasi Tumbuhnya Bisnis Penjualan Kaos Oblong Khas Daerah. Available at: http://ensiklo.com/. Accessed at June 5, 2015.
APPENDIX
Observation number Mahalanobis d-squared p1 p2
82 36,968 0.000 0.006
3 34,887 0.000 0.000
1 34,389 0.000 0.000
53 33,980 0.000 0.000
29 30,264 0.001 0.000
33 29,879 0.001 0.000
80 28,646 0.001 0.000
78 22,322 0.014 0.000
5 20,677 0.023 0.001
35 20,200 0.027 0.000
57 20,056 0.029 0.000
42 18,793 0.043 0.001
58 17,679 0.061 0.007
89 17,147 0.071 0.011
40 16,696 0.081 0.015
73 16,198 0.094 0.025
39 14,771 0.141 0.236
54 14,284 0.160 0.336
96 14,192 0.164 0.282
94 13,767 0.184 0.378
25 13,727 0.186 0.304
85 13,698 0.187 0.234
52 12,808 0.235 0.582
31 12,674 0.242 0.561
12 11,855 0.295 0.864
97 11,382 0.329 0.944
48 11,033 0.355 0.972
72 10,732 0.379 0.985
86 10,685 0.383 0.979
6 10,410 0.405 0.989
18 10,004 0.440 0.997
100 9,986 0.442 0.995
98 9,905 0.449 0.994
41 9,761 0.462 0.995
65 9,658 0.471 0.995
62 9,561 0.480 0.994
63 9,443 0.491 0.994
8 9,230 0.510 0.997
84 8,968 0.535 0.999
95 8,727 0.558 0.999
76 8,671 0.564 0.999
64 8,661 0.565 0.999
67 8,600 0.570 0.998
74 8,455 0.585 0.999
9 8,397 0.590 0.998
27 8,396 0.590 0.997
36 8,119 0.617 0.999
19 7,919 0.637 1.000
Observation number Mahalanobis d-squared p1 p2
46 7,532 0.674 1.000
20 7,458 0.682 1.000
91 7,427 0.685 1.000
2 7,276 0.699 1.000
34 7,143 0.712 1.000
92 7,131 0.713 1.000
71 7,028 0.723 1.000
45 6,862 0.738 1.000
30 6,776 0.746 1.000
23 6,726 0.751 1.000
51 6,722 0.751 1.000
59 6,675 0.756 1.000
56 6,652 0.758 0.999
87 6,624 0.760 0.999
10 6,620 0.761 0.998
37 6,614 0.761 0.996
61 6,552 0.767 0.995
26 6,537 0.768 0.991
32 6,254 0.793 0.997
38 6,208 0.797 0.996
17 6,065 0.810 0.997
55 5,641 0.844 1.000
15 5,562 0.851 1.000
16 5,391 0.864 1.000
90 5,288 0.871 1.000
49 5,262 0.873 1.000
7 5,218 0.876 1.000
83 5,046 0.888 1.000
66 4,939 0.895 1.000
75 4,862 0.900 1.000
11 4,774 0.906 1.000
14 4,303 0.933 1.000
24 4,161 0.940 1.000
50 4,102 0.943 1.000
13 3,953 0.949 1.000
43 3,783 0.957 1.000
60 3,551 0.965 1.000
68 3,265 0.974 1.000
77 3,225 0.976 1.000
47 3,186 0.977 1.000
79 3,143 0.978 1.000
28 2,988 0.982 1.000
4 2,814 0.985 1.000
70 2,702 0.988 1.000
81 2,702 0.988 1.000
22 2,561 0.990 0.999
99 2,359 0.993 0.999
88 2,124 0.995 0.999
93 1,837 0.997 0.998
69 1,782 0.998 0.978
Sample Covariances (Group number 1)
PL PQ PV SN Ab ev b MC NB IB
PL 3,597
PQ 2,394 6,048
PV 1,816 2,942 3,988
SN 28,072 40,374 26,086 1,329,980
Ab 35,096 48,612 38,888 655,620 1,102,000
ev 1,466 2,133 1,657 29,538 50,484 2,598
b 1,808 2,396 1,914 33,980 55,860 2,352 3,080
MC 1,206 1,902 1,188 62,124 30,872 1,401 1,616 3,416
NB 1,439 1,899 1,181 70,686 33,768 1,531 1,774 2,915 4,322
IB 0.577 1,704 1,166 30,156 25,318 1,291 1,114 1,560 1,624 4,174
Condition number = 42,205,720 Eigenvalues