DEVELOPING A SPATIAL PROCESSING SERVICE FOR AUTOMATIC
CALCULATION OF STORM INUNDATION
H. Jafari a, *, Ali A. Alesheikh b
a Dept. of GIS, K.N. Toosi University Of Technology, Tehran, Iran - haniyejafari12@gmail.com b Dept. of GIS, K.N. Toosi University Of Technology, Tehran, Iran - alesheikh@kntu.ac.ir
KEY WORDS: WPS, Storm, Inundation, Web Service, USISM, Hydrological Model
ABSTRACT:
With the increase in urbanization, the surface of earth and its climate are changing
.
These changes resulted in more frequent flooding and storm inundation in urban areas. The challenges of flooding can be addressed through several computational procedures. Due to its numerous advantages, accessible web services can be chosen as a proper format for determining the storm inundation. Web services have facilitated the integration and interactivity of the web applications. Such services made the interaction between machines more feasible. Web services enable the heterogeneous software systems to communicate with each other. A Web Processing Service (WPS) makes it possible to process spatial data with different formats. In this study, we developed a WPS to automatically calculate the amount of storm inundation caused by rainfall in urban areas. The method we used for calculating the storm inundation is based on a simplified hydrologic model which estimates the final status of inundation. The simulation processand water transfer between subcatchments are carried out respectively, without user’s interference. The implementation of processing functions in a form of processing web services gives the capability to reuse the services and apply them in other services. As a result, it would avoid creating the duplicate resources.
* Corresponding author
1. INTRODUCTION
1.1 Theoretical background
The global changes in climate and the development of urbanization process have increasedthe frequency, severity, and losses of natural disasters. Flood and storm inundation are introduced as one of the natural disasters, which make many challenges to Hydrologic experts due to the intensity and shortage of time to react (Apel et al., 2009; Bonta, 2004; Cheng, 2010). As the ground is often covered with impermeable materials in the urban areas, runoff speed is high and the infiltration of rainwater into the soil seems to be low. As a result, heavy showers in an urban area can cause flood and inundation (Smith, 2006). For instance, the 40-hour rainfall on the 13th 14th and 15th of April in 2012 in Tehran caused serious storm inundation. Indeed, within the last 50 years, the rainfall mass was unprecedented and the regions 1, 3, 4, 5, 6 and 15 faced with serious problems. In some streets, the water level reached to as much as 30 cm and the movement of people and cars was stopped. Moreover, the floodwater broke into the
tunnel of metro’s line 4 and thoroughly disrupted the movement
of trains in that line. In some stations, the floodwater level reached more than 5 meters and caused damages to electric, telecommunication, control, and navigation systems. Accordingly, in recent years, the need for paying attention to urban flood and storm inundation has been discussed more seriously.
Today, via web, many of applications are presented as accessible services.Web services have made the integration and the interactivity of web applications between the machines more feasible. Web services enable the heterogeneous software
systems to communicate with each other. With the application of such technology, all implementation details are hidden from
the users’ view, who would only need a web browser (Bean, 2008). In GIS world, web services are utilized in order to manage, analyse and disseminate spatial data. Spatial web services enable the use spatial data and spatial processing functions to various organizations (Friis-Christensen, et al., 2007).
Different formats of spatial data can be processed through a Web Processing Service (WPS). In fact, the process, defined by a WPS, can encompass a wide range of simple and complex processes. The service can express the simple calculation of the distance between two points or complicated calculations such as modeling the atmosphere changes on earth as a processing source in a standard way. In the current study, since the WPS standard was considered as the basis of our processing functions the details of developing such services are elaborated in the following sections.
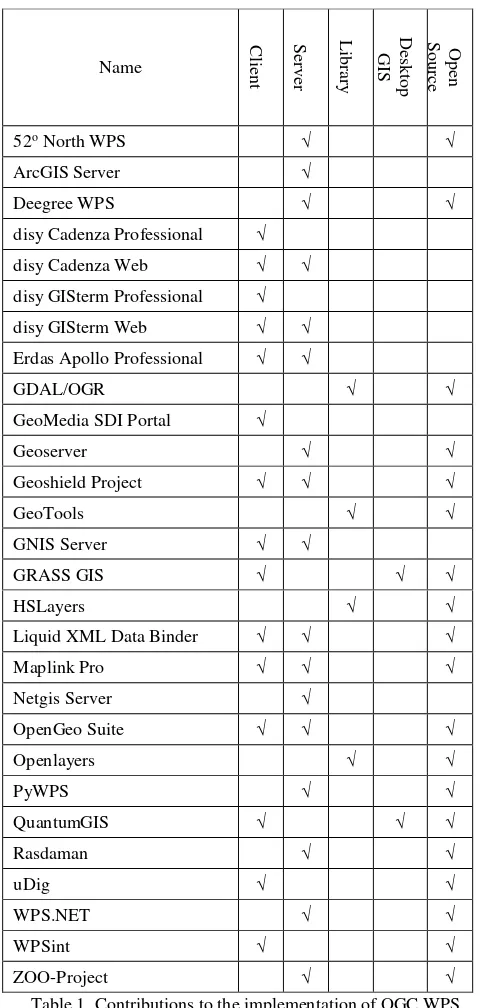
Many different open source and proprietary software have hitherto been generated to implement WPS services. In fact, some software have been developed specifically for WPS implementation, while other ones have been introduced for different purposes, to which the capability of WPS implementation has been added. Table 1 presents a classification based on the role of different software in regard to WPS implementation and application (Evangelidis, et al., 2014). In Table 1:
Client applications: offer the interface to users, which enable them to search for information related to the capabilities of a WPS servant, send their request and receive the answers to their request. In addition, they create a medium to display the processes output.
Server software: entails the main core of operations needed to develop a WPS servant via internet. WPS servant serves as an access point, that can manage all client requests and their responses. Technically, WPS server software is integrated into other software such as libraries, plug-ins and desktop spatial processing parts to process the input parameters, dispatched by user request, and reply to them through the outputs.
Libraries: include classes and divisions developed by means of programing languages, and connected to existing software, which create processing divisions.
Desktop GIS software: act as a thick client and supply all processing actions of a WPS through their processing divisions. Software products listed in Table 1 take part in creating and using WPS implicitly or explicitly through the plug-ins, developed for this purpose.
Table 1. Contributions to the implementation of OGC WPS specification standard (Evangelidis, et al., 2014)
Some of the noticeable WPS implementation softwares are briefly introduced as follows.
52◦Northis regarded as an open source free software, presented in 2004, which was covered by several research and software development unions as well as a wide range of collaborative activities related to software development. The WPS created by 52◦North conforms to Open Geospatial Consortium (OGC) standards. It is a Java-based software that is applied as a plug-in (Evangelidis, et al., 2014).
Zoo is recognized as a WPS open source project, which was published in 2009. Zoo develops a WPS on the basis of OGC and provides the developer with a user-friendly framework. The software also makes it possible to develop and chain the web services, developed by means of different programming languages (Fenoy, et al., 2013).
The PyWPS project began to work in 2006, which aimed to create Grass-based processes applicable to web users. PyWPS can be considered as a translation library, which receives input requests according to OGC standards, sends them to Grass or any other tools (developed by Python), and resend the results (Cepicky & Becchi, 2007).
APOLLO and ArcGIS Server are introduced as two instances of commercial remedies, widely applied in WPS creation. A modeling engine named Imagine is planned for APOLLO, that represents the capability of graphical designing of models and complicated spatial algorithms in order to create chained processed models and publish them. Model Builder, a
modelling engine similar to APOLLO’s, was introduced by
ESRI in 2006. ArcGIS Server 10.1 and its following versions support WPS standards. Moreover, the processing tools and models created in ArcGIS can be utilized by any client applicants, supporting WPS standard (Evangelidis, et al., 2014). To date, the functionalities of spatial web services have been applied in many studies in the field of Hydrology. Diaz et al. developed a web-based geoportal for hydrological purposes, which combines processing web services with client applications in order to display spatial data (Diaz et al, 2008). The geoporatl aims at achieving a user-friendly interactive interface for the scholars in the field of hydrology. The server part provides the hydrological models via a library from the distributed spatial processing web services. The client part facilitates the search for catalogue services in order to achieve an appropriate resource. Furthermore, this part interacts with processing web services through the parameters of hydrological models and displays the results to the user. Castronova and his colleagues (2013). designed a modeling service based on WPS standard. Their approach was examined on a hydrological model. They demonstrated how a hydrological model has been implemented and used as a spatial processing service (Castronova et al., 2013). Lou and his team established a distributed, interoperable and standard-based spatial web service, that can automaticaly extract streams network from Digital Elevation Model (DEM). It is worth noting that in this web service, the streams are extracted by inserting the threshold on the flow accumulation map. This service was also implemented consistently with the WPS standard (Luo et al., 2014). Kadlec and his research group built a WPS using 52 North, for analysis of hydrological time series in R. The presented architecture can be used as a model for publishing other time series analysis scripts online (Kadlecet. al, 2016). Name
In the present study, the spatial web service was applied in order to automatically calculate the amount of storm inundation caused by rainfall in urban areas. The method, adopted for calculating storm inundation, was based on the spatial information systems. Moreover, it is a simplified method of the hydrological models, which calculates the final status of inundation. The simulation process and water transfer between
sub catchments are carried out respectively, without the user’s
interference and automatically, in regard to flow order.
2. MATERIALS AND METHODS
2.1 Algorithm Of Storm Inundation Calculation
In the current study, Urban storm inundation simulation method (USISM) algorithm was used for storm inundation calculation. The method is based on geographic information systems (GIS)
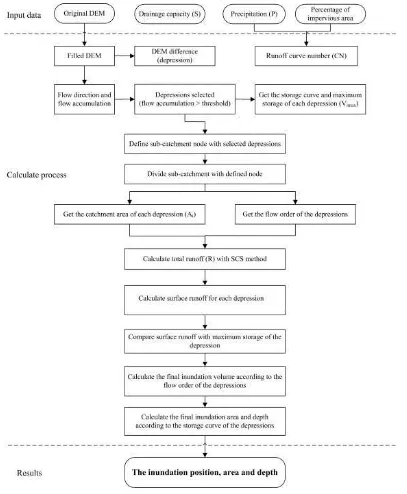
and that is a kind of simplified distributed hydrologic model. The USISM model does not consider the impact of storm water infrastructures in calculation of hydrological characteristics such as flow direction and flow accumulation. Besides, in this model, curve number method was utilized in order to estimate the runoff, in which the amount of infiltration is calculated according to the soil type. As a result, and due to the lack of land use map, the effect of any land types on the calculation of surface runoff is not taken into account and the curve number is determined to estimate the runoff only based on the percentage of permeable areas. As the urban areas are often covered with impermeable materials, the permeability value has been considered as zero for all surfaces. Figure 2 shows the computational algorithm for USISM model (Zhang & Pan, 2014).
Figure 2. USISM model (Zhang & Pan, 2014)
According to above figure DEM must be filled to find depressions. Depressions are calculate using filled DEM minus original DEM. Flow Direction and Flow Accumulation are calculate using a D8 algorithm. Using threshold for flow accumulation, stream is extract. The depressions on the stream are inundated area potentially. Using ArcGIS 3D analysis tools the maximum storage volume and storage curve of these depressions are obtained. In the next step subcatchment is divide based on flow direction, flow accumulation and depressions outline node. Then subcatchment area is calculated, and the order of the depressions is determined. Using the order of depressions surface runoff volume is calculated. Average velocity of water drainage multiplied by storm duration used for sewer system runoff estimation. In the next step surface runoff volume compared with the maximum storage of the depression. If surface runoff volume is less than the maximum storage, volume of surface runoff is inundation volume. Otherwise, depression is filled and excess water transferred to next depressions. Other than the volume, depth and area of the depression are the final results.
The simulation phases in USISM model are carried out manually by the user, though, in implementation service, the steps are automatically done without the user intervention. Thus, the process of water transfer among the depressions and movement from upstream to downstream catchments, considered as a time consuming computational process in
USISM model, is automatically performed in our web processing service.
2.2 Implementation of Web Processing Service
In order to implement the automatic computation service of storm inundation, the spatial processing tool was created to transmit surface runoff across the catchments, and calculate the
inundation’s depth, volume and area using Arcobjects as well as C# programming language in Visual Studio 2015. Using the Model Builder, a combination of spatial processing tools available in ArcGIS 10.2, and the created processing tool, the needed model was established to estimate the storm inundation, which was put as the WPS on ArcGIS for Server 10.2. Flooded depressions, the catchment area related to the research cite, the streams caused by the considered rainfall, flooded points, along with the depth, volume and area were estimated as the outputs of the mentioned services.
2.3 Implementation Of Web Application
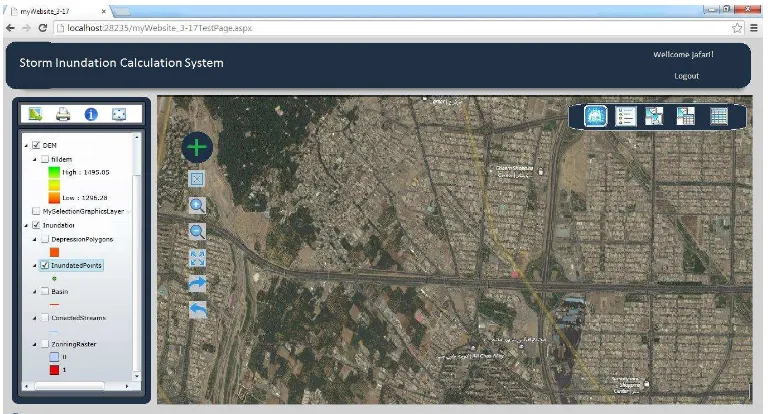
In order to apply the developed service, a web application was also generated to make it possible to call the created service. The implementation was performed using the ARCGIS API for JAVA SCRIPT. The programming phases were carried out in Visual Studio 2015. In this system, DEM layer, urban passages maps, OSM map and Bing satellite images are accessible to users. Figure 3 illustrates the implemented user interface (UI).
Figure 3. User interface of the developed web application
3. RESULTS
In the current study, the district 1 of region 22 of Tehran was selected as the research site. Topographic data used in the research process is DEM, on which the height of the buildings was not considered. The planned speed of water transfer through the sewage system was reported 12 mm per hour. The rainfall data applied in the research process is related to a rainfall event with a return period of 100 years. This event involves a 1-hour rainfall with the amount of 15.74 mm. The data was collected from different departments of Tehran Municipality and National Weather Service. The intensity and
duration of rainfall as well as DEM data of related areas were investigated and clicking on run bottom, the direction and accumulation maps of the flow are generated through another service and sent to the storm inundation automatic calculation service. This implemented service runs and output is accessible to the user. The outputs of this processed service consist of flooded depressions, flooded points with the characteristics of their volume, depth and area, the sub catchment of the research site and the streams caused by the rainfall event. Figure 4 and Figure 5 show the maps of flow direction and accumulation of input flow to the automatic calculation service of storm water. The International Archives of the Photogrammetry, Remote Sensing and Spatial Information Sciences, Volume XLII-4/W4, 2017
Figure 5. Input flow direction map Figure 4. Input flow accumulation map
Figure 6 illustrates the inundated points, streams, and the sub catchment of the study area calculated by the storm inundation calculation service.
Figure 6. Inundated points, streams, and the sub catchment of the study area calculated by the storm inundation calculation service
In order to evaluate the inundation, the flooding assessment tool bar has been envisaged which includes three tools: spatial query, attribute query and inundation statistics calculation. The spatial query tool enables the user to select his intended areas based on a distinct geometry and consequently, observe its inundation characteristics. On the other hand, the attribute query tool enables the user to enquire according to a special
feature and observe the flood characteristics. Besides, the flood statistics tool provides some statistics in regard to the flood status, including a maximum volume of inundation, the maximum area and depth of inundation as well as the total area of flooded regions.
4. CONCLUSIONS
In the current study, the automatic calculation process service of storm inundation was developed on the basis of USISM model. In order to examine the implemented service, a web application was also developed. This system made it possible to measure the inundation of a rainfall event. The output of the system can be used for decision-making and carrying out practical measures in minimum possible time.
Processing functions required for automatic calculation of storm inundation were published on a server as a standard WPS service. The results would be sent to the user after receiving rainfall information and required maps, the service runs and result sent to the client. Then, the user observes the results through the UI, who is able to spatially and descriptively query on the map of flooded areas and observe their characteristics. The characteristics consist of volume, depth and area of each inundated point. The implementation of processing functions in a form of processing web services gives the capability to reuse the services and apply them in other services. As a result, it would avoid creating the duplicate resources.
The storm inundation calculation in the developed service is based on some simplifying assumptions. First, the equipment’s related to storm water collecting infrastructure was only regarded in determining hydrological characteristics of the research site. Moreover, in calculating inundation amount, the medium capacity has been utilized that was designed for flood collection infrastructure. Indeed, such simplification sometimes overestimates and sometimes underestimates the drainage capacity. In addition, ignoring the spatial distribution of the drainage process makes errors in the simulation. USISM also simulates the final status of storm event, and thus, the intensity and duration of rainfall enjoy such a great importance with respect to the inundation calculation.
REFERENCES
Apel, H., Aronica, G. T., Kreibich, H. & Theieken, A. H., 2009. Flood risk analyses-how detailed do we need to be?, Natural Hazards. 49, pp. 79-98.
Bean, J., 2008. SOA and web services interface design:
principles, techniques, and standards. Morgan Kaufmann,
USA.
Bonta, J. V., 2004. Development and utility of Huff curves for disaggregating precipitation amounts, Applied engineering in
agriculture. 20, pp. 641-656.
Castronova, A. M., Goodall, J. L. & Elag, M. M., 2013. Models as web services using the Open Geospatial Consortium (OGC) Web Processing Service (WPS) standard, Environmental
Modelling & Software. 41, pp. 72-83.
Cepicky, J. & Becchi, L., 2007. Geospatial processing via Internet on remote servers PyWPS, OSGeo Journal. 1, pp. 39– 42.
Cheng, X. T., 2010. Urban water disasters and strategy of comprehensive control of water disaster, Journal of
Catastrophol. 25, pp. 10-15.
Diaz, L., Granell, C. & Gould, M., 2008. Case Study: Geospatial Processing Services for Web based Hydrological Applications. In: J. T. Sample, K. Shaw, S. Tu & M. Abdelguerfi, eds. Geospatial Services and Applications for the
Internet. US: Springer, pp. 31-47.
Evangelidis, K., Ntouros, K., Makridis, S. & Papatheodorou, C., 2014. Geospatial services in the Cloud, Computers &
Geosciences. 63, pp. 116–122.
Fenoy, G., Bozon, N. & Raghavan, V., 2013. ZOO-Project: the open WPS platform, Geomatics. 5(1), pp. 19–24.
Friis-Christensen, A., Ostländer, N., Lutz, M. & Bernard, L., 2007. Designing Service Architectures for Distributed Geoprocessing: Challenges and Future Directions, Transactions
in GIS. 11, p. 799–818.
Kadlec, J., Ames, D.P., Bayles, M., Seul, M., Hooper, R. and Cummings, B., 2016. Web Based Analysis of Hydrological Time Series in R using Web Processing Services. 8th International Congress on Environmental Modelling and Software.
Luo, W., Li, x., Molloy, I. & Di, L., 2014. Web Service for extracting stream networks, GeoJournal. 79, p. 183–193.
Smith, M. B., 2006. Comment on ‘Analysis and modeling of
flooding in urban, Journal of Hydrology. 317, pp. 355-363.
Zhang, S. & Pan, B., 2014. An urban storm-inundation simulation method based on GIS, Journal of Hydrology. 517, p. 260–268.