INDOOR MODELLING FROM SLAM-BASED LASER SCANNER: DOOR DETECTION
TO ENVELOPE RECONSTRUCTION
L. Díaz-Vilariño a,b,*, E. Verbree b, S. Zlatanova c, A. Diakité c
a
Applied Geotechnologies Group, Dept. Natural Resources and Environmental Engineering, University of Vigo, Campus Lagoas-Marcosende, CP 36310 Vigo, Spain - [email protected]
b
GIS Technology, OTB Research Institute for the Built Environment, c 3D Geoinformation, Department of Urbanism, Delft University of Technology, Julianalaan 134, Delft, Netherlands – (L.Diaz-Vilarino, E.Verbree, S.Zlatanova, A.A.Diakite)@tudelft.nl
Commission IV, WG IV/5
KEY WORDS: Combinatorial Geometry, Energy Minimization, Connectivity, Completeness, Trajectory.
ABSTRACT:
Updated and detailed indoor models are being increasingly demanded for various applications such as emergency management or navigational assistance. The consolidation of new portable and mobile acquisition systems has led to a higher availability of 3D point cloud data from indoors. In this work, we explore the combined use of point clouds and trajectories from SLAM-based laser scanner to automate the reconstruction of building indoors. The methodology starts by door detection, since doors represent transitions from one indoor space to other, which constitutes an initial approach about the global configuration of the point cloud into building rooms. For this purpose, the trajectory is used to create a vertical point cloud profile in which doors are detected as local minimum of vertical distances. As point cloud and trajectory are related by time stamp, this feature is used to subdivide the point cloud into subspaces according to the location of the doors. The correspondence between subspaces and building rooms is not unambiguous. One subspace always corresponds to one room, but one room is not necessarily depicted by just one subspace, for example, in case of a room containing several doors and in which the acquisition is performed in a discontinue way. The labelling problem is formulated as combinatorial approach solved as a minimum energy optimization. Once the point cloud is subdivided into building rooms, envelop (conformed by walls, ceilings and floors) is reconstructed for each space. The connectivity between spaces is included by adding the previously detected doors to the reconstructed model. The methodology is tested in a real case study.
1. INTRODUCTION
The increasing availability of point clouds and their respective acquisition systems has driven the automated analysis of point clouds to a research topic of great importance in remote sensing, computer vision and robotic communities. Despite the increasingly demand of updated and detailed indoor models, indoor reconstruction is still in an early stage in comparison with the reconstruction of outdoor scenes (Zlatanova et al 2013, Volk et al 2014). Not only reconstruction of indoor environments but also data acquisition present specific challenges due to complex building layouts and high presence of elements such as pieces of furniture causing clutter and occlusions.
The consolidation of new portable and mobile acquisition systems has led to a higher availability and quality of 3D point cloud data from indoors, especially in terms of data completeness. Advances in the reduction of size and weight of laser scanning sensors, together with improvements in indoor positioning techniques, have led to the development of Indoor Mobile Mapping Systems (IMMS). Most of these systems implement the technique of Simultaneous Localization and Mapping (SLAM), which consists in the construction of an incremental map of the unknown environment and the simultaneous localization within it (Bailey and Durrant-Whyte, 2006). Knowing the trajectory followed by the system and the points acquired from each trajectory location, the point cloud can be directly reconstructed.
IMMS can be classified in three groups according to the platform in which sensors are placed: cart, backpack and handheld. Cart-based systems, such as the iMS 3D developed
by Viametris Company and the system developed by Nutcher et al (2013), are usually conformed by several LiDAR and RGB sensors and they can continuously scan complex building layouts moving around furniture to avoid occlusions. However, stairs and multi-level floors represent a considerable difficulty to the survey. Backpack-based systems (Filgueira et al, 2016) and handheld systems such as Zeb-Revo from GeoSLAM Company are designed to solve these difficulties at the expense of reducing weight and autonomy. In any case, SLAM-based LiDAR systems offer not only the reconstructed point cloud but also the trajectory followed by the system during the acquisition process. Trajectory and point cloud are usually related by timestamp, meaning that from each position in the trajectory we know which points in the point cloud were acquired by the system. This concept is used by Verbree and van Oosterom (2003) to reconstruct surfaces by a Delaunay Tetrahedronized Irregular Network approach. Additionally, trajectory represents a navigable path within the building. Doors connecting adjacent spaces are implicitly represented in the trajectory. However, most of literature on building indoor reconstruction is not using trajectory as input in the reconstruction process.
Most of the existing approaches dealing directly with the point cloud can be classified into three categories: linear primitive detection, planar primitive detection and volumetric primitive fitting.
2D primitive extraction followed by extrusion is a widely used technique in indoor modelling for reconstructing assumed planar and vertical surfaces. Methods addressing indoor modelling from a 2D perspective generally perform on isolated floor levels and in the absence of clutter. Recent approaches belonging to this category show good results in large-scale indoor reconstruction. For example, Okorn et al (2010) present an approach based on the use of the Hough transform for detecting lines but the method is restricted to Manhattan-World (MW) scenes and the output constitutes a set of unconnected wall segments. Oesau et al (2014) develop a methodology for modelling both MW and non-MW structures by applying cell decomposition after line fitting followed by a graph cut optimization. Ochmann et al (2016) reconstruct building indoors from point clouds already distributed into separate rooms. Vertical planes are projected to the horizontal plane as wall surface lines and the labelling step is solved as an energy minimization problem. Their methodology also applies to MW and non-MW structures.
Planar primitive detection is also widely used in indoor reconstruction. Sanchez and Zakhor (2012) classify point clouds in four classes (floor, ceiling, wall and remaining points) from their point normal orientations. Then, planar fitting using RANSAC is applied to the first three classes, and their extents are estimated using alpha shapes. However, the output is a set of unconnected surfaces. Díaz-Vilariño et al (2016) also start by point cloud classification but they determine the geometry of floors, walls and ceilings by intersecting planes according to their adjacency. The remaining points are used to obstacle detection for indoor path planning. Another planar primitive detection approach is the one proposed by Budroni and Boehm (2010). They implement a sweeping technique to identify walls in MW structures based on point density.
Volumetric primitive detection generally imposes a stronger regularity. This aspect might be positive in highly cluttered environments but it implies less flexibility; these approaches are usually restricted to MW structures. Xiao and Furukawa (2012) introduce an inverse constructive solid geometry algorithm. After detecting linear wall segments in 2D sections, they are combined according to their parallelism and orthogonally for generating candidate primitives (cuboids). Khoshelham and Díaz-Vilariño (2014) develop a grammar-based methodology to reconstruct MW indoor spaces by iteratively placing, connecting and merging cuboids. Structural elements are subsequently derived from final indoor spaces. Both approaches are tested under the absence of clutter.
Apart from ceilings, floors and walls, windows and doors are also permanent structures of building indoors. While windows can be modelled from outdoors, most of doors can just be addressed from an indoor perspective. The subject of door detection in indoors has been considered in previous research. Xiong et al (2013) detect doors from a voxel-based labelling approach. Doors are considered as openings in the wall structures, and therefore, the methodology is restricted to open doors and door passes. Díaz-Vilariño et al (2015) carry out the extraction of closed doors by applying the Generalized Hough Transform on wall orthoimages generated from coloured point clouds acquired with a Terrestrial Laser Scanner. Díaz-Vilariño et al (2014) extend the previous methodology to classify door
candidates into open and closed doors by studying the point-to-plane distribution of points close to the door candidate. Quintana et al (2016) implement an image-based method to detect open and closed doors by finding horizontal and vertical lines in orthoimages. Barbacan et al (2016) use a Compass Line Filter to extract open-door candidates. Their spatial configuration is solved as an energy minimization problem. The approach is restricted to open doors.
This paper is focused on the development of a methodology to automate the reconstruction of large-scale buildings from the combined use of point cloud and trajectory provided by SLAM-based laser scanner. More specifically, the methodology addresses the subdivision of the point cloud into semantically meaningful subspaces. Trajectory is used as a valuable data source since it depicts the route followed by the acquisition system and therefore, it partially indicates the navigable space. In this work, trajectory is going to be used for detecting doors and subdividing the space into small subspaces. The general configuration of small subspaces into building rooms is formulated as a minimum energy optimization method. Finally, main building structural elements, walls, ceilings and floors, are reconstructed for each space as well as doors.
The rest of this paper is organized as follows. Section 2 describes the proposed methodology. Section 3 explains the conducted experiments and the respective results and Section 4 is aimed to conclude this work.
2. METHODOLOGY
The input of our approach consists of a point cloud of one building story with several rooms and the trajectory followed by the mobile laser scanner system during the acquisition. Both datasets are related by timestamp, which is a sequence of characters encoding information identifying when point clouds were acquired. Therefore, the target points observed from each observation point (trajectory position) are known since timestamp is expected to be the same.
This relation is the basis for distributing a point cloud into semantically meaningful subspaces corresponding to building rooms. Therefore, a preliminary step of this methodology consists on decoding timestamps to make sure that there is time correspondence between both input data sets: point cloud and trajectory.
2.1 Door Detection
In contrast to most of the building reconstruction methodologies in which openings are detected after or from wall reconstruction, this approach starts by the detection of doors. For this purpose, a vertical profile of the point cloud along the trajectory is extracted. The point cloud is assumed to be vertically oriented and the profile is created from searching in 2D all neighbours in the point cloud within a specified Euclidean distance to trajectory points. The point cloud is structured in a kd-tree and a fixed-radius search is used.
whose lower part is adjacent to floor. Doors are typically lower in height than the walls where they are contained. Therefore, when crossing doors, part of the walls will be depicted in the ceiling profile and this feature can be exploited for detecting doors in a ceiling profile. It should be noted that this step just applies to doors traversed during acquisition.
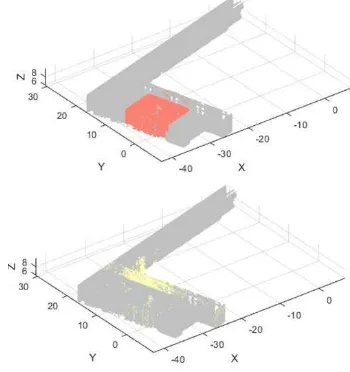
Figure 1. Trajectory is shown in red, while vertical profile corresponding to floor is visualized in green, and vertical profile corresponding to ceiling in blue.
Once ceiling profile is extracted, it is discretized into a rectangular grid-based structure. Cells are assigned the value of the elevation average of points falling inside. In this case, elevation is calculated with regard to the minimum height of ceiling profile points, so that small values would correspond to cells representing doors. Values are normalized between 0 and 1, being the higher and the smaller elevation, respectively.
Door candidates are found by selecting the populated cells with a normalized value greater than a certain percentile. Although the door detection is accomplished from the ceiling profile, door candidates are selected from trajectory points since they are going to be further used for point cloud subdivision (Section 2.2.). The trajectory points belonging to door candidates are next clustered by proximity. The nearest neighbours within a minimum distance between points are calculated, and points are grouped by adjacency.
2.2.Space Partitioning
Trajectory points belonging to doors are used to subdivide the point cloud into subspaces. The subdivision is carried out for a double purpose. Firstly, the indoor reconstruction from smaller datasets is more effective in terms of time and computer resources. Secondly, the organization of indoor point clouds in a way that points belonging to the same room are grouped and labelled together constitutes valuable semantic information for determining the optimal room and wall layout (Oesau et al, 2014, Ochmann, et al, 2016).
According to the Oxford dictionary, a room can be considered as a part of division of a building enclosed by walls, floors and ceiling. Doors act as entrances and exits to rooms. Therefore, the trajectory path followed between two doors would correspond to one room only and doors would divide consecutive rooms. As a point cloud and the corresponding trajectory are related by timestamps, this feature is used to organize the points into subspaces. Figure 2 shows two different subspaces. In both cases, the point cloud corresponds to the trajectory path between two doors. As it can be observed, the distribution of the subspaces is not regular and there is not
univocal correspondence between subspaces and building rooms.
Figure 2. Two different subspaces are highlighted: a building room (above) and a piece of a corridor (below).
2.3.Semantic point cloud Labelling
Although one subspace corresponds to just one room, one room is not necessarily depicted by one subspace. This occurs when a room contains several doors connecting it to some other rooms such as in case of corridors, and consequently it is not continuously acquired. Therefore, the univocal correspondence between subspaces and building rooms of which they form part should be determined in order to distribute the point cloud into semantically meaningful subspaces.
Overall, our premise is that a subspace or a set of subspaces are likely to represent one building room if the building room is completely depicted by the subspace or by the set of subspaces. In this work, the global configuration of the building is formulated as a combinatorial problem solved by an energy minimization problem where the scoring function consists of a Unary and a Contextual Term.
The completeness of a subspace or a set of subspaces is evaluated by a ray-casting algorithm. The entire point cloud is analysed altogether. The labelling problem is reduced to the two-dimensional space whereby the point cloud, conformed at this point by several subspaces (Section 2.2.), is discretized in a grid parallel to the horizontal plane as in Section 2.1. Since the completeness of a subset as a building space should be defined by permanent structures, vertical elements, mostly walls, are extracted by selecting those cells with a number of points higher than a certain percentile. The discard of grid cells representing other elements such as pieces of furniture is desirable for avoiding false positives.
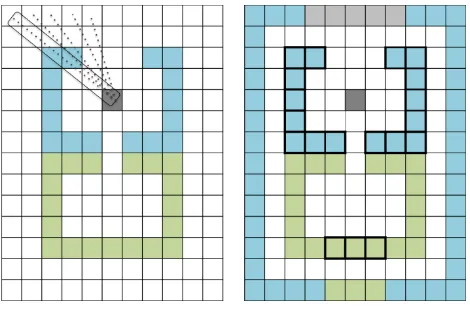
In Figure 3, the ray-casting concept is visualized. The image on the left represents the situation before completeness evaluation, in which two different subspaces are represented by blue and green cells, respectively. The colour of the cells represent their label according to the initial space partitioning. Hence, a cell represented in blue means that most of the points included in that cell are from blue subspace (section 2.2.). In this example, completeness evaluation is performed for the subspace blue. The scanning origin is visualized in grey and rays are traced to all edge cells. The situation after evaluation is represented in the image on the right. Edge cells were labelled as blue, green and grey cells if occlusion was caused by blue subspace, grey subspace or not occlusion, respectively. Populated cells (cells from subspaces) causing occlusion are highlighted with thick borders. In this case, from a total of 46 edge cells, 38 are occluded by subspace blue, 3 by subspace green and 5 are visible.
Figure 3: The ray-casting concept to evaluate subspace completeness. Left and right images represent the situation before and after evaluation, respectively.
Formulation of hypotheses
Once doors are used to subdivide the entire point cloud in subspaces (section 2.2.), a set of hypotheses H = {H1, H2, … Hn} representing all possible combinations between subspaces is generated. The number of building rooms and the number of subspaces conforming rooms is not known. Therefore, the combinatorial problem is solved as a partition of a set of subspaces S into non-empty subsets of subspaces � with cardinality n, in such a way that every subspace �� in S is in exactly one of these subsets s.
The number of possible combinations between subspaces ��, given by the Bell number, is refined by applying the restriction imposed by the existence of doors. For example, if a door is connecting ‘subspace 1’ ��1 and ‘subspace 2’ ��2, combinations including both subspaces into one subset � are excluded from analysis �= {��1,��2} ∉ �.
Unary Term
The unary term is defined as the likeliness of a subset � to define an enclosed space, which represents the completeness of the subset. To provide an unary cost for each subset ��(��), the ray-casting algorithm evaluates whether or not rays intersect with the own subset. As the scanning is carried out from an indoor point of view, trajectory points, associated to the subset is being evaluated ��, are used as scanning origin. Rays are
traced from inside to outside covering the entire field of view, so that, occlusions to all edge cells ε are evaluated.
Intuitively, the cost shall be low if most of cells causing occlusion c belong to the subset that is being evaluated ��. In the example of Figure 3, from a total of 46 edge cells (ε), 38 are occluded for the subspace blue (c), so �� would be 0.17 (1).
�� (��) = 1− � �⁄ (1)
Contextual Term
The contextual term measures the influence of other subspaces in the completeness of each other. For this purpose, all points belonging to populated cells causing occlusions (represented with thick borders in Figure 3. right) are considered. The contextual cost for each subset ��(��) is the normalized frequency of point labels belonging to other subspaces. The higher is the ratio between points belonging to the subspace with regard to the total number of points; the lower is the contextual cost (2).
�� (��) = 1− �(��) (2)
Energy minimization
The optimal configuration of subspaces is formulated as an energy minimization problem where the scoring function consists of the unary term and the contextual term weighted to balance the result. Among the generated hipotheses, the optimal configuration H* is the hipothesis with minimal score (3).
�(�) =� ∑�=0� �� (��)+� ∑��=0�� (��) (3)
2.4. Scene Reconstruction
At this point of the methodology, subspaces are grouped in sets conforming rooms. Therefore, whatever it is the methodology selected to reconstruct the structural elements, we already know which elements would belong to which room and the adjacency relationship between spaces. That means that our labelled point cloud has already semantic and topology information.
Just with the purpose of creating a parametric model from the semantically-rich point cloud, a well-known methodology is implemented in this step. Similarly to Díaz-Vilariño, et al, (2016), a region-growing algorithm followed by an adjacency evaluation are applied to each room in order to obtain the boundary points defining wall, ceiling and floor surfaces.
Assuming floor and ceiling as horizontal structures, they can be easily isolated by studying the distribution of the z-coordinate of the points. The higher peak in the histogram of z-coordinates corresponds to the room ceiling while the lower peak represents the room floor (Khoshelham & Díaz-Vilariño, 2014).
Afterwards, adjacency is evaluated for all planar regions. For each point of the cloud, all neighbours within specified distance are searched. For each region, if neighbouring points belong to different planar regions, they are considered as adjacent regions.
Finally, vertical planar regions adjacent to ceiling or ceiling and floor are considered walls. Adjacency is also used to intersect wall planes with ceiling and floor in order to obtain the boundary points that define each surface.
3. RESULTS AND DISCUSSION 3.1. Instruments and data
The methodology is tested in a real case study, an academic building indoor surveyed with the handheld iMMS Zeb-Revo. The technical characteristics of the laser device are summarized in Table 1.
Technical Characteristics Maximum measurement range 30 m
Data acquisition rate 43,200 points/sec
Resolution 0.625º horizontal, 1.8º
Vertical
Angular FoV 270º x 360º
Relative accuracy 2-3 cm
Absolute position accuracy 2-30cn (10 mins scanning, 1 loop)
Laser Wavelength 905 nm (Class 1 Eye safe)
Scanner Line Speed 100 Hz
Rotation Speed 0.5 Hz
Weight (scanner) 1.0 Kg
Table 1. Technical characteristics of the Zeb-Revo laser scanning device according to the manufacturer datasheet.
Two enclosed rooms, one open room and a L-shape corridor compose the building indoor. Each enclosed room includes two doors and another door is placed at the entrance of the corridor. The point cloud depicting the introduced case study is composed of 1019102 points while 10915 points define the trajectory.
In this case, point cloud timestamps are encoded using the Unix time system, which is defined as the number of seconds that have elapsed since 00.00.00 Coordinated Universal Time of 1 January 1970 minus the number of leap seconds taken place since then. Trajectory timestamps are encoded as the number of seconds elapsed since the acquisition start. Therefore, before processing, timestamps are decoded for referencing both datasets in the same time reference system.
3.2. Door Detection and Space Partitioning
As described in Section 2.1, doors are detected from extracting a vertical profile from the point cloud along the trajectory. Assuming vertically oriented datasets, neighbours within 0.1m have been searched in 2D in the point cloud for each point trajectory.
Then, the ceiling profile is discretized in a grid with 0.1m x 0.1m cell size. Cells are assigned with the elevation average of
points falling inside. Values are normalized between 0 and 1, and doors are selected as the populated cells with a normalized value greater than 98 percentiles. As a result, five doors have been detected. This result means precision and recall values of 1 for this case study.
Finally, doors are used to subdivide the space as explained in Section 2.2. As it can be observed in Figure 4, the open room (in blue at the right of the image) is detected as part of the corridor since there are no doors either walls enclosing the space. In addition, corridor is composed by three subspaces because it was intermittently acquired, as can be observed from the trajectory (in black).
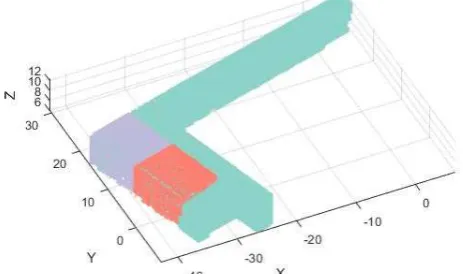
Figure 4. After door detection and space partitioning, point cloud is subdivided into 5 subspaces (sp1, sp2, sp3, sp4, sp5), highlighted in this figure in different colours. Ceiling has been removed for enabling the visualization of trajectory points, in red.
3.3. Space Labelling
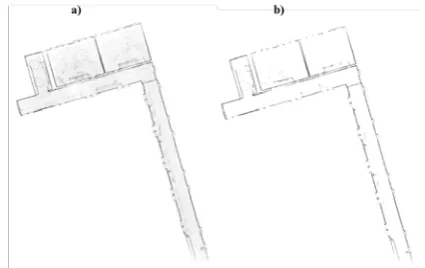
From the space partitioning, an initial label is assigned to each point. As the point cloud was subdivided in a total of 5 subspaces, we have the equivalent number of initial labels. As mentioned in Section 2.3. the entire point cloud is analysed and discretized together in a grid-based structure of 0.15m resolution. Figure 5.a shows the populated cells in grey-scale taking into account the number of points per cell. The 1019102 points fit in a total of 20047 populated cells. Figure 5.b shows the grid after selection of those cells with a number of points higher than the 90 percentile.
After this process, 498231 points are distributed into 2444 populated cells. Most of the remaining cells corresponds to vertical elements such as walls, while those representing furniture are mostly discarded. Wall areas coinciding with windows are also discarded due to the lower amount of points. Consequently, those cells will not be intersecting with rays during completeness evaluation.
The number of all possible combinations between 5 subspaces into sets of unknown size is given by the number of Bell, in this case 52. However, the existence of 5 doors between sp1-sp2, sp2 -sp3, sp3-sp4 and sp4-sp5 reduces the number of valid hypotheses to 15 (Table 2).
Completeness is initially evaluated for each individual subspace. The analysis of the Unary term and the Contextual Term for sets of several subspaces only implies the reclassification of, in case of the Unary Term, visible edge cells, occluded edge cells by the subset and occluded edge cells by other subspaces, and in case of the Contextual Term, occluding points from the subset and occluding points from other subspaces. For example, for the subset {sp1, sp3}, visible edge cells are edge cells visible from any scanning origin (in this case, scanning origin for sp1 and sp3); edge cells occluded by sp1 or sp3 are occluded edge cells by the subset, while edge cells occluded by sp2, sp4, and sp5 are occluded edge cells by other subspaces. When analysing points belonging to the intersecting cells for Contextual Term analysis, those points labelled as sp1 and sp3 are accounted as occluding points from the subset while the rest are accounted as occluding points from other subspaces.
For determining which populated cells intersect with each ray, a buffer of width equal to the grid resolution, in this case 0.15m, is created. A cell is intersecting with the ray if its centre is inside the buffer. A ray is considered occluded if it intersects with more than one populated cell. When intersection, the closest cell is considered for further analysis. Instead of considering one scanning origin, completeness is evaluated for each subspace from ten trajectory points equal-spatially distributed. In this way, the results are more representative and less sensible to false positives. If an edge cell is visible from one of those scanning origins, it is considered visible in the final result because it is unequivocally incomplete. Occluded edge images are labelled with the mode of the identity obtained from all scanning origins.
Finally, the scoring function parameters � and � are set equally as 0.5. For all valid hypotheses, energy is calculated and the minimum value is obtained for the combination S=[{sp1, sp3, sp5}, {sp2}, {sp4}] (Table 2). The point cloud is finally distributed into three building rooms (Figure 6).
Combinations Energy
{sp1, sp3, sp5}, {sp2, sp4} 0.1532
{sp1, sp3}, {sp2, sp4}, {sp5 } 0.2487
{sp1, sp3, sp5}, {sp2}, {sp4} 0.1185 {sp1, sp3}, {sp2, sp5}, {sp4} 0.2247
{sp1, sp3}, {sp2}, {sp4}, {sp5} 0.1988
{sp1, sp4}, {sp2, sp5}, {sp3} 0.3649
{sp1, sp4}, {sp2}, {sp3, sp5} 0.2121
{sp1, sp4}, {sp2}, {sp3}, {sp5} 0.3039
{sp1, sp5}, {sp2, sp4}, {sp3} 0.3023
{sp1}, {sp2, sp4}, {sp3, sp5} 0.1978
{sp1}, {sp2, sp4}, {sp3}, {sp5} 0.2932
{sp1, sp5}, {sp2}, {sp3}, {sp4} 0.2390
{sp1}, {sp2, sp5}, {sp3}, {sp4} 0.2752
{sp1}, {sp2}, {sp3, sp5}, {sp4} 0.1607
{sp1}, {sp2}, {sp3}, {sp4}, {sp5} 0.2444
Table 2. All valid hypotheses and energy obtained for each hypothesis.
Figure 6. Point cloud after space labelling. Each building room is visualized in one colour.
3.4. Scene Reconstruction
Once point cloud is distributed in building rooms, each room is further processed individually. For each of them, floors and ceilings are found as peaks at height of 6.0 m and 11.7 m, respectively. Populated cells selected for space labelling (Section 3.3) are also considered for scene reconstruction since most of them correspond to vertical structural elements such as walls. Therefore, ceiling and floor points together with points belonging to the selected cells are submitted to region growing to isolate planar regions.
A neighbourhood of 50 points is considered for normal point analysis. Angular and point-to-plane distance thresholds (30º and 0.4 m respectively) are coarse enough to include in wall regions most of points belonging to door and window elements. Walls are considered as vertical regions adjacent to floor and ceiling. Adjacency is determined from the relation between all points with their neighbours within a radio of 0.1m. Just adjacency relations higher than a 10 percentile are selected as significant.
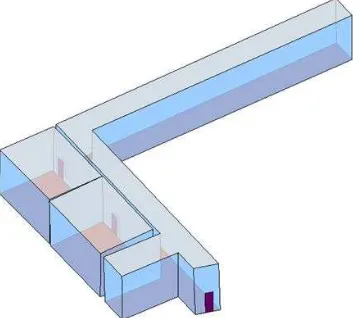
Figure 7. Parametric model from the case study. Walls are visualized in blue, while floors in red and ceilings in grey. Doors are also visualized in red but without transparency.
Final step is door reconstruction. Since the location of doors is already known, walls where they are contained are identified for each space. Dimensions of doors are simulated and boundary points are projected on the respective walls. As it is can be observed in Figure 7 and Figure 8. Left, the result is a surface model in which topological relations such as containment and connectivity between spaces are known. Figure 8. right zooms in the model from a top point of view. Because the reconstruction methodology implemented is highly dependent on data quality and completeness, the resulting model is not very accurate. Several regularization rules could be applied for improving final model but regularization is out of the scope of this paper.
Figure 8: Zoom in the model from a perspective point of view (left) and from a top point of view (right).
3. CONCLUSIONS
This paper presents a methodology for extracting semantic information from the combined use of point clouds and trajectory from SLAM-based laser scanners, with the ultimate purpose of automating building indoor modelling. Point cloud distribution into semantically meaningful partitions is formulated as a combinatorial problem solved as an energy minimization optimization.
From the results, the main conclusions can be drawn:
• Doors can be detected from creating a vertical profile along the trajectory and analysing the number of points or their average elevation on the horizontal plane.
• Door detection is not affected by the presence of numerous elements in ceilings such as lamps or pipe
facilities. However, the method applies just to doors traversed during the acquisition.
• Space labelling is not restricted to Manhattan-World structures and it is robust to the presence of some clutter although most of it is easily removed by selecting the most populated cells, which correspond to vertical elements (mostly walls).
• Space labelling is robust under the presence of windows since they are typically located in exterior walls. Therefore, rays could not intersect with other indoor spaces when studying visibility through windows.
• From door detection and space labelling, semantic and topologic information is already derived.
• Scene reconstruction, based on region growing and adjacency analysis, is applied to individual building rooms. Since it depends on data quality, it is not fully automatic.
• In contrast to scene reconstruction, door detection and space labelling are fully automatic.
Future work will test the methodology in different building configurations. Corrective actions will be explored in case of not all traversed doors are detected. Future work will extend the space labelling to 3D. Energy minimization will be explored for determining the configuration of building structures (walls, ceilings and floors) to conform individual building room. Indoor navigation models will be derived from the models.
ACKNOWLEDGEMENTS
This research is founded by the Xunta de Galicia (human resources grant no. ED481B 2016/079-0), the Ministerio de Economía y Competitividad -Gobierno de España- (project no. TIN2016-77158-C4-2-R), the Netherlands Organization for Scientific Research (project no. 13742, NWO/STW M4S – SIMS3D) and the European Union (project ENGINENCY). The statements made herein are solely the responsibility of the authors.
REFERENCES
Bailey, T., and Durrant-Whyte, H., 2006. Simultaneous Localization and Mapping (SLAM), Update, vol. 13, no. September, pp. 108–117, 2006
Barbacan, K., Jung, J., Wichmann, A., Jahromi, B.A., Shahbazi, M., Sohn, G., Kada, M. 2016. Towards object driven floor plan extraction from laser point cloud. International Archives of the Photogrammetry, Remote Sensing and Spatial Information Sciences, XLI-B3, pp. 3-10
Budroni, A., Boehm, J., 2010. Automated 3D reconstruction of interiors from point clouds. International Journal of Architectural Computing 8(1), 55-73
Broersen, T., Fichtner, F. W., Heeres, E. J., de Liefde, I., Rodenberg, O. B. P. M., Verbree, E., and Voûte, R., 2016. Project pointless. Identifying, visualising and pathfinding through empty space in interior point clouds using an octree approach. 19th AGILE Conference on Geographic Information Science, 14-17 June, 2016
Photogrammetry, Remote Sensing and Spatial Information Sciences, XLI-B4, 275–281.
Díaz-Vilariño, L., Khoshelham, K., Martínez-sánchez, J., Arias, P., 2015. 3D Modeling of Building Indoor Spaces and Closed Doors from Imagery and Point Clouds. Sensors 15, 3491–3512.
Díaz-Vilariño, L., Martínez-Sánchez, J., Lagüela, S., Armesto, J.,Khoshelham, K. 2014. Door recognition in cluttered building interiors using imagery and LiDAR data. International Archives of the Photogrammetry, Remote Sensing and Spatial Information Sciences, 40 (5), pp. 203-209
Filgueira, A., Laguela, S., Arias, P., Bueno, M., 2016. Novel inspection system, backpack-based, for 3D modelling of indoor scenes. in: 2016 International Conference on Indoor Positioning and Indoor Navigation (IPIN). 4–7 October, 2016 (Madrid)
Khoshelham, K., Díaz-Vilariño, L., 2014. 3D modeling of interior spaces: learning the language of indoor architecture, International Archives of Photogrammetry, Remote Sensing and Spatial Information Sciences, 40 (5), pp. 321-326
Nuchter, A., Elseberg, J. and Borrmann, D., 2013. Irma3D – An Intelligent Robot for Mapping Applications. In: Proceedings of the 3rd IFAC Symposium on Telematics Applications (TA ’13), Seoul, Korea, pp. 119–124.
Ochmann, S., Vock, R., Wessel, R., Klein, R. 2016. Automatic reconstruction of parametric building models from indoor point clouds. Computer and Graphics, 54, pp. 94-103
Oesau, S., Lafarge, F., Alliez, P., 2014. Indoor scene reconstruction using feature sensitive primitive extraction and graph-cut. ISPRS Journal of Photogrammetry and Remote Sensing 90(0), 68-82.
Okorn, B., Xiong, X., Akinci, B., Huber, D. 2010. Toward automated modelling of floor plans. In: Proceedings of the symposium on 3D data processing, visualization and transmission, vol. 2.
Quintana, B., Prieto, S.A., Adán, A., Quintana, B., Prieto, S., Adan, A., 2016. Door Detection in 3D Colored Laser Scans for Autonomous Indoor Navigation, in: 2016 International Conference on Indoor Positioning and Indoor Navigation (IPIN). 4–7 October, 2016 (Madrid)
Rodenberg, O. B. P. M., Verbree, E., and Zlatanova, S., 2016, Indoor A* pathfinding through and octree representation of a point cloud, ISPRS Ann. Photogramm. Remote Sens. Spatial Inf. Sci., IV-2/W1, 249-255
Sanchez, V., Zakhor, A., 2012. Planar 3D modeling of building interiors from point cloud data, 19th IEEE International Conference on Image Processing (ICIP), Orlando, FL, pp. 1777-1780
Verbree, E., van Oosterom, 2003. Better surface representations by Delaunay tetrahedronized irregular networks. ESRI international conference, San Dieg, July 2003.
Volk, R., Stengel, J., Schultmann, F., 2014, Building Information Modeling (BIM) for existing buildings — Literature
review and future needs, Automation on Construction 38 (2014) 109-127