Volume 26, Number 2, 2011, 156 – 175
CONVERGENCE OF GDRP PER CAPITA AND ECONOMIC GROWTH
AMONG INDONESIAN PROVINCES, 1988-2008
Diah Setyorini Gunawan
Universitas Jenderal Soedirman ([email protected])
ABSTRACT
In this paper, we analyze the condition among province in Indonesia especially about the convergence or divergence in gross domestic regional product. This research used secondary data for the 1988-2008 periods. We divide the periods as four episodes, based on the presidential terms. They are 1988-1999, 1999-2001, 2001-2004, and 2004-2008. Entrophy Theil index, coefficients of variation, Kuznets’ hypothesis test, absolute convergence, and conditional convergence were used in this research. This research found that the convergence in gross domestic regional product happened in every period of the presidential leadership in Indonesia. We also found that regional economic growth in Indonesia is determined by gross domestic regional product per capita, oil and gas resources, general allocation funds and revenue sharing funds.
Keywords: convergence, regional economic growth, gross domestic regional product
INTRODUCTION
Regional development is an integral component of national development. Regional development is intended as an effort to ensure equal distribution of regional development with the sole purpose to balance and harmo-nize or reduce the disparity of growth between regions in order to support the overall success of national development (Sibero, 1985: 4). The fact that each region has its own natural resources, human resources and geographical conditions, therefore each region owns the potential to grow rapidly and vice versa, some regions lack the ability to develop due to the several limitations they must bear with.
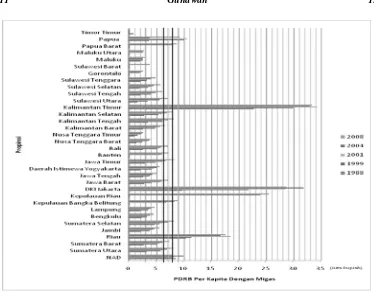
In the 1988-2008 period, four provinces have a GDRP per capita which is dominated by on oil and gas. These provinces comprise of Riau, Islands of Riau, DKI Jakarta, and East Kalimantan. DKI Jakarta has the highest GDRP per capita although it is not an oil and
gas producer; however it is the capital city which establishes itself as the centre for all economic activity. The province of Riau, Islands of Riau, and East Kalimantan have a dominant GDRP per capita since these provinces are oil and gas producers. The Islands of Riau is the 32nd province that was established based on Law No. 25 Year 2002 (Provincial government of Islands of Riau, 2009). This is displayed in Figure 1 that presents the GDRP per capita of oil and gas producing provinces in Indonesia.
GDRP per capita for oil and gas above average since the establishment of those provinces.
Based on the data of GDRP per capita for non-oil and gas, it is apparent that from the period 1988-2008, three provinces are domi-nant in non-oil and gas GDRP per capita. These provinces include the Islands of Riau, DKI Jakarta, and East Kalimantan. Domina-tion of these three provinces, namely the Islands of Riau, DKI Jakarta, and East Kalimantan is presented in Figure 2.
Overall, it can be stated that no differ-ences are evident for each period. The provinces that owned a non-oil and gas GDRP per capita above average for each period includes North Sumatera, DKI Jakarta, Central Kalimantan, East Kalimantan, and Papua
along with other new provinces for example the Islands of Bangka Belitung and the Islands of Riau. The Islands of Bangka Belitung (established in 2000) and the Islands of Riau (established in 2002) always indicated a GDRP per capita for non-oil and gas above average since the establishment of those provinces.
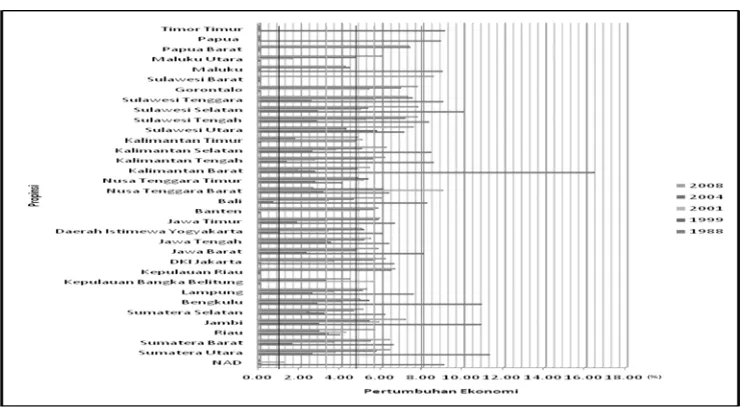
With regard to economic growth of Indonesian provinces for the period 1988-2008, fluctuations are apparent for regional economic growth. Regional economic growth has even reached the negative level. This was particularly evident in the post economic crises (year 1999). Regional economic growth fluctuation is displayed in Figure 3.
Source: Processed from BPS (1988-2008)
Source: Processed from BPS (1988-2008)
Figure 2. GDRP per Capita for Non-Oil and gas producing provinces in Indonesia Period 1988-2008
Source: Processed from BPS (1988-2008) Description: 1. Data for oil and gas
2. Negative economic growth is not evident in the graphic
Provinces with GDRP per capita above average do not guarantee economic growth above average. Conversely, the provinces with GDRP below the average do not automatically indicate economic growth below average. This demonstrates that less developed provinces are able to catch up with the progress of advanced provinces.
Disparities between regions constitute a serious problem. Recent studies indicate that disparities between regions exist, whether between countries or between regions within a country. The lower levels of disparities between regions imply that convergence has taken place, or conversely, larger disparities imply divergence.
Based on these elaborations, the re-searcher aims to analyze the disparities and convergence of GDRP per capita of the provinces in Indonesia during five presidential terms. By using these periods as a point of reference, disparities between provinces in Indonesian between each presidential term can be determined.
LITERATURE REVIEW
Studies concerning disparities between regions have been conducted both abroad and in Indonesia itself. The studies include Barro and Sala-i-Martin (1995); Quah (1996); Arifin and Kuncoro (2002); Hill, et al. (2009), and etc. Matrix of the literature review of regional disparities is displayed in Table 1.
Table 1. Empirical Study on Inter-Regional Disparities
Researcher Method Period Findings
Barro and Sala-i-Martin (1995); ”Empirical Analysis of a Cross Section of Countries”.
Cross-section analysis 1965-1985 - Positive correlation between GDP growth with the variables initial GDP per capita, educational level, life expectancy, investment in education, investment ratio.
- Negative correlation between growth level with government spending, market distortion, political instability, birth rate, and population growth.
Quah (1996); ”Regional Convergence Clusters Across Europe”.
Cross-section analysis 1980-1989 Geographical factors are more likely to influence the dynamics of income distribution between regions in Europe.
Haryanto (2001); ”Indonesia Regional Economic Development: A Neoclassical Growth Analysis”.
Coefficients of variation, absolute
convergence, and
conditional convergence
1983-1998 Convergence of GDRP per capita in Indonesia supported by the increase of capital accumulation in impoverished regions, provision of infrastructure, increasing the quality of the workforce through investment in education, technological transfer towards small scale industries, and control on population growth
Arifin and Kuncoro (2002); “Spatial Concentration and the dynamics of
Manufacturing Industries in East Java”.
Geographical information system,
logistic regression. Panel data analysis, convergence analysis
1994-1999 - Industrial growth in east Java is not distributed equally between each district.
- Convergence analysis demonstrates that the speed of convergence in East Java is as large as 6,18% per year.
Todaro and Smith (2003); “Evidence on the Inverted-U Hypothesis”.
Kuznets Hypothesis Tests
1996 The Kuznets Hypothesis proven on developing countries consisting of Bangladesh, Kenya, Sri Lanka, Indonesia, Philippines, Jamaica, Paraguay, Costa Rica, Malaysia, and Brazil.
Wibisono (2003); “Convergence in Indonesia: Some Initial Findings and its Implications”.
Absolute convergence
and conditional convergence
1975-2000 - Convergence of GDRP per capita in Indonesian at a low speed.
- Presence of supporting variables of convergence results in a faster level of convergence.
Kuncoro (2004a); “Are There Changes in Spatial Concentration of Manufacturing
Industries in Indonesia, 1976-2001?”
Entropy Theil Index and Chow Tests
1976-2001 - The pattern of spatial disparity forms a “U” curve which reflects a period of dispersion of manufacturing activities which have been replaced by a period of increased geographical concentration. - In the Javanese Island, the trend of
spatial concentration is strongly explained by the degree of differences between the workforces in the districts/cities within a particular province.
- Chow tests provide evidence that structural changes have been made following the year 1997.
Lee, et al. (2005); “Income Disparity between Japan and ASEAN-5 Economies: Converge, Catching Up or Diverge?”.
ADF unit root test 1960-1997 Divergence of income between Japan and each member of ASEAN-5 (Indonesia, Malaysia, Singapore, Philippines, and Thailand).
Hill, et al. (2009); “Economic Geography of Indonesia: Location, Connectivity, and Resources”.
Coefficients of variation and absolute
convergence
1975-2002 - Diverse economic and social outcomes, however growth and social progress is taking place.
- High regional disparities with tendencies of declining.
- Bali, DKI Jakarta, East Kalimantan, and Riau constitute the provinces with good performance; these provinces are diverse with respect to their location size and social and economic characteristics.
The matrix above allows the researcher to draw the differences and similarities of the current study with the recent studies that have been conducted. The current study is similar with respect to the analysis methods that are used. These analyses methods include the
divergence for each Indonesian presidential term. Accordingly, these periods are divided as 1988-1999 (President Soeharto and Presi-dent B.J. Habibie), 1999-2001 (PresiPresi-dent Abdurrahman Wahid), 2001-2004 (President Megawati Soekarnoputri), and 2004-2008 (President Susilo Bambang Yudhoyono). The presidential term of Soeharto and B.J. Habibie are combined since B.J. Habibie only served one year as the Indonesian president. Conver-gence analysis cannot be performed on periods of one year because the result of the estimations will be biased. By using these period, differences of inter-regional disparities can be observed based on each presidential term.
METHODOLOGY
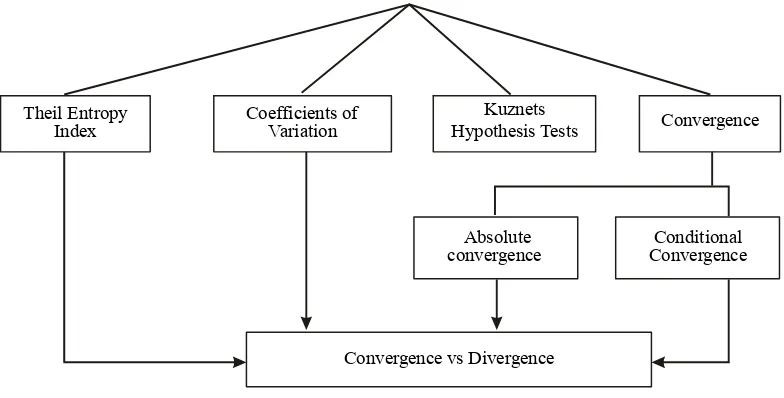
The analysis methods used in this study comprises of analysis of the Theil entrophy index, coefficients of variation, Kuznets hypothesis tests, absolute convergence, and conditional convergence (see Figure 4).
1. Theil Entrophy Index Analysis
The Theil entrophy index is used to meas-ure economic disparity. The Theil entrophy index allows the researcher to discover the
degree of economic disparity in Indonesia. The concept of entrophy was introduced by Henri Theil. This concept basically serves as an application towards the concept of informa-tion theory in measuring economic disparity and industrial concentration (Kuncoro, 2002: 87).
The Theil entrophy index is calculated using the following formula (Theil and Friedman, 1973: 533):
I(y) = ∑(yj / Y) x log[(yj/Y) / (xj/X)] (1)
Given that:
I(y) = Theil entrophy index
yj = GDRP per capita for province j
Y = average GDP per capita of Indonesia
xj = total population of province j
X = total population of Indonesia
2. Coefficients of Variation Analysis
The coefficients of variation are made by calculating the dispersion of the GDRP per capita between provinces in Indonesia. Barro and Sala-i-Martin (1995: 31) suggested that dispersion is measured with the following variance estimations:
Absolute
convergence ConvergenceConditional
Convergence vs Divergence Theil Entropy
Index
Coefficients of
Variation Convergence
Kuznets Hypothesis Tests
[
]
given that Dt represents the dispersion or disparity of income per capita for period t, t
represents the logarithm for the average GDRP per capita for the provinces in Indonesia for period t, and log yt represents the logarithm of
GDRP per capita for province i on period t, N refers to the total number of provinces.
3. Kuznets Hypothesis Tests
The data of GDRP per capita and Theil entrophy index is used to prove the validity of the Kuznets Hypothesis in Indonesia for the period 1988-2008. The Kuznets hypothesis suggests that the preliminary phases of econo-mic growth is marked by poor econoecono-mic growth and income distribution and that income distribution in the subsequent stages would be better. Income distribution in the early stages is due to the natural characteristics of structural change. In line with Lewis’s model, the preliminary stages are concentrated on modern industrial sectors, where work opportunity is limited but wage and produc-tiveness is high (Todaro, 2003: 214-215).
4. Absolute and Conditional Convergence Analysis
This study will analyze the absolute con-vergence and conditional concon-vergence. The equations used in the absolute convergence analysis adopt the model from Barro and Sala-i-Martin (1995). The equations are as follows:
∆yi,t,t+T = α – log(yi,t) + єi,t (3)
∆yi,t,t+T = log(yi,t+T/yi,t) / T (4)
given that y indicates the Gross Domestic Regional Product (GDRP) per capita, i indi-cates the province, and t as well as t+T indicates the observation from two time periods.
Absolute convergence analysis is also accompanied with the conditional convergence
analysis. This is because economic growth is not merely influenced by GDRP per capita. If only the absolute convergence analysis was performed, the model would be biased towards the issue of specificity bias.
The equation that is used on the condi-tional convergence analysis is as follows:
∆yi,t,t+T = α – log(yi,t) + OIL +
ηDAUt + DBHt + єi,t (5)
∆yi,t,t+T = log(yi,t+T/yi,t) / T (6)
given that y indicates the Gross Domestic Regional Product (GDRP) per capita; i indicates the province; t and t+T indicates the observation of two time periods; OIL indicates the dummy variable (1 referring to provinces with oil and gas resources while 0 refers to the provinces without oil and gas resources); DAU indicates the proportion of general fund allocation towards the balanced funds; and DBH indicates the proportion of revenue sharing towards the balanced funds. Funds from revenue sharing that are used in this study refer to the total funds of revenue sharing, which is a combination of revenue sharing funds from tax and non-tax resources (natural resources). The rationale for using these variables in estimation is based on Classical and Neo-Classical economic per-spectives that economic growth is influenced by natural resources and the total stock of capital goods. The oil and gas dummy variable represents natural resources, while general allocation funds and revenue sharing funds represent total stock of capital goods. The current study hypothesizes that the oil and gas dummy variable, general allocation funds, and revenue-sharing funds will positively influ-ence regional economic growth.
tax and non-tax revenue sharing was used (Kuncoro, 2004b: 12). In the current study the term general allocation funds and revenue sharing funds were used for each research period.
The β value or speed of convergence and the half-life of convergence (time required to cover half of the initial disparity) are obtained from the following calculations (Barro and Sala-i-Martin, 1995):
Analysis in the study was initiated using the theil entrophy index and coefficients varia-tion analysis. The results of the coefficients variation analysis was expected to support the results of the Theil entrophy index analysis concerning disparity. In addition, the Kuznets Hypothesis tests were performed. Absolute convergence and conditional convergence analysis was subsequently performed using cross-section analysis. Conditional conver-gence analysis was also conducted by using panel data analysis, considering the weak-nesses that are frequently apparent in cross-section analysis. The conclusion concerning convergence and divergence will be based on the results of these analyses.
ANALYSES RESULTS
1. Analyses Results for the Theil Entrophy Index
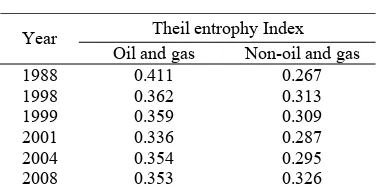
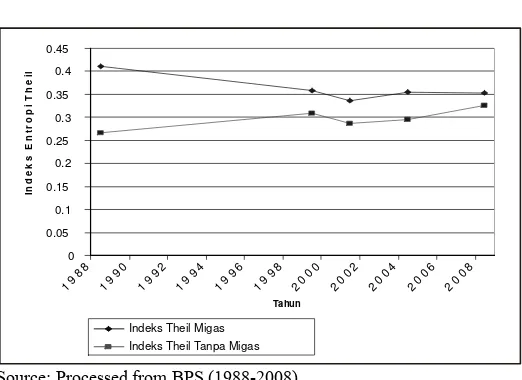
Table 2 indicates the Theil entrophy index that represents the disparity of GDRP per capita for oil and gas and non-oil and gas in Indonesia during the period 1988-2008. Based on the data of GDRP per capita for oil and gas, the disparity tends to decrease in Indonesia for the period 1988-2008. The value of the theil entrophy index in 1988 is as large as 0,411 and declines to 0,352 on 2008. The Theil entrophy index have once experienced an increase in
2004, however it remains below the Theil entropy index in 1988.
Table 2. Indonesian Theil Entrophy Index, 1988-2008
Theil entrophy Index Year
Source: Processed from BPS (1988-2008)
The results of the analyses confirm studies conducted by Akita and Lukman (1995) and Wibisono (2003). Akita and Lukman (1995) analyzed the Theil entrophy index for the period 1975-1992 and found that disparities in Indonesia have continuously declined. A similar suggestion was made by Wibisono (2003) who analyzed the Theil entrophy index for the time period 1975-2000. He found that the disparities in this period had continuously declined.
In contrast with the Theil entrophy index for the GDRP per capita for oil and gas, the Theil entropy index for GDRP per capita for non oil and gas tends to increase for the period 1988-2008. The Theil entrophy index on 1988 is as large as 0,267 and rises to 0,326 in 2008. Although having a tendency to increase, the Theil entrophy index for GDRP per capita for non-oil and gas have smaller values compared to the Theil entrophy index for the GDRP per capita for oil and gas.
The value of the Theil entrophy index which tends to decrease indicates the lower disparity. The lower disparity is likely to be caused by the efforts of accelerating development in less developed regions, although the results are not fully enjoyed by those regions. Less developed regions still face some problems like human resources with low education rate, lack of infrastructure, and social conflicts. The problems caused by some inappropriate policy which didn’t support development in less developed regions.
For the period 1988-2008, the Theil entrophy index for GDRP per capita for non oil and gas tends to increase. However, the Theil entrophy index for GDRP per capita for non-oil and gas is smaller compared to the Theil entrophy index for GDRP per capita for oil and gas. This finding demonstrates that oil and gas resources expand the disparities of GDRP per capita in Indonesia. Provinces with more oil and gas resources enjoy higher GDRP per capita compared to the provinces lacking oil and gas resources. In general, mining sector still as important sector for many provinces. In case of non-oil and gas, mining sector still faces many problems which is related with social, politic, and regulation
problems (Ministry of Energy and Mineral Resources, 2007). These problems cause the contribution of mining sector for non-oil and gas not optimal. In this case, mining sector for oil and gas more dominant than mining sector for non-oil and gas.
2. Results of Coefficients of Variation Analysis
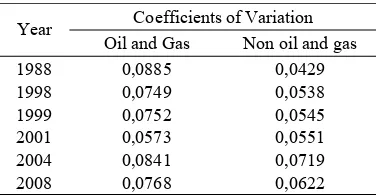
The results of the coefficients of variation analysis demonstrate the dispersion of GDRP per capita in Indonesia. The dispersion of GDRP per capita for oil and gas in Indonesia for the period 1988-2008 tends to decline. Dispersion from year 1988 was as large as 0,0885 and declined to 0,0768 in 2008. The dispersion of GDRP per capita once experienced an increase in 2004, nevertheless it remained below the dispersion value in 1988. The increase of dispersion of GDRP per capita in 2004 was in line with the increased disparities in Indonesia on that period. For the year 2001, GDRP per capita dispersion for oil and gas and non-oil and gas indicate values that are not largely different. Such findings demonstrate that on those periods, disparities in Indonesia were not only influenced by factors of oil and gas resources, but they were
0
Indeks Theil Tanpa Migas
Source: Processed from BPS (1988-2008)
also influenced by other economic factors. The results of coefficients of variation analysis are presented in Table 3.
Table 3. Coefficients of Variation for GDRP per capita in Indonesia, 1988-2008
Coefficients of Variation Year Source: Processed from BPS (1988-2008)
The results of the coefficients of variation analysis are consistent with the Theil entrophy index analysis. There is a tendency to decline with regard to dispersion and disparities of GDRP per capita for oil and gas for the period 1988-2008.
Opposite conditions were evident for dispersion of GDRP per capita for non-oil and gas in Indonesia. Dispersion for the period 1988-2008 tended to increase. This was also the case for the Theil entrophy index, although
tendencies of increasing were evident, the value of the coefficients of variation for GDRP per capita for non-oil and gas remains below the coefficients of variation value for GDRP per capita for oil and gas. This difference indicates that the presence of oil and gas resources in particular provinces increase the dispersion of GDRP per capita in Indonesia. Figure 6 presents the tendencies of the dispersion of GDRP per capita for oil and gas to reduce and the dispersion of GDRP per capita for non oil and gas to increase.
Dispersion of GDRP per capita is influenced by economic growth and other national macroeconomic conditions. Fluctuating economic growth encourages dispersion of GDRP per capita’s fluctuation. Figure 7 demonstrates the fluctuation of economic growth in Indonesia for the period 1988-2008.
Based on Figure 7, during Soeharto’s presidential term, Indonesia’s economic growth always reached above 5% and could even reach 8%. The initial phases of the economic crisis were marked by declining economic growth. The economic growth in
0
1988 1990 1992 199 4
1996 1998 2000 2002 2004 2006 2008
Year CV for Non-Oil and Gas
Source: Processed from BPS (1988-2008)
1996 was 8,62% (based on GDRP for oil and gas) and 8,16% (based on GDRP for non oil and gas) and then experienced a reduction in 1997 to 4,7% (based on GDRP for oil and gas) and 5,23% (based on GDRP for non oil and gas). In 1998, Indonesia experienced negative economic growth of -13,13% (based on GDRP for oil and gas) and -14,22% (based on GDRP for non oil and gas). This period was marked by the transition from the President Soeharto to B.J. Habibie. At the presidential terms of B.J. Habibie, Abdurrahman Wahid, and Megawati Soekarnoputri, of which marked the post economic crisis period, positive economic growth was evident although remain below 5%. Economic growth above 5% was only achieved at the leadership of President Soesilo
Bambang Yudhoyono-although economic growth had yet to achieve pre-crisis standards.
Based on the Theil entrophy index and the coefficients of variation analysis, we can see the consistency between the two analysis. Figure 8 demonstrates the consistent results of the Theil entrophy index and the coefficients of variation for GDRP per capita for non oil and gas. This consistency implies that when the dispersion of GDRP per capita increases therefore disparities will also increase, and vice versa. When the dispersion of GDRP per capita increases and the disparity declines, this means that inconsistency has taken place. Inconsistency has taken place in the year 1999, 2001, and 2008 for the data GDRP per capita for non oil and gas.
-20 -15 -10 -5 0 5 10 15
Year
E
c
ono
m
ic
G
row
th
Economic Growth for Oil and Gas 6 7 7 7 6 7 8 8 9 5 -13 1 5 3 4 4 5 6 6 6 6 Economic Growth for Non-Oil and
Gas
7 8 8 7 8 8 8 9 8 5 -14 1 5 4 4 5 5 5 5 6 4 88 89 90 91 92 93 94 95 96 97 98 99 00 01 02 03 04 05 06 07 08
Source: Processed from BPS (1988-2008)
Figure 7. Indonesian Economic Growth, 1988-2008
Source: Processed from BPS (1988-2008)
Based on the Pearson correlation analysis, the Pearson correlation for the Theil entrophy index and the coefficients of variation for oil and gas is as large as 0,760 with a significance level of 0,068, which is significant at α=10%. The results demonstrate a positive relationship between the disparity and dispersion of GDRP per capita for oil and gas. Currently, while the dispersion of GDRP per capita rises, the disparity also increases. Conversely, when the dispersion of GDRP per capita declines, the disparity also declines.
The results of the Pearson analysis for the variable Theil entrophy index and the coefficients of variation for non oil and gas indicates no correlation between the Theil entrophy index and the coefficients of variation for the data non oil and gas. This is indicated by the Pearson correlation value as large as 0,566 with a significance of 0,160 therefore not significant on α=10%. The insignificance between the Theil entrophy index and the coefficients of variation for non oil and gas demonstrates the inconsistency between disparity and dispersion of GDRP per capita for non oil and gas. In some periods, increases in dispersion of GDRP per capita is not accompanied by increases in disparity, in contrast, the disparity rather declines.
3. Kuznets Hypothesis Tests
Data from GDRP per capita and the Theil entrophy index can be utilized to prove the validity of the Kuznets hypothesis in Indonesia for the period 1988-2008. By using the cubic regression method without a constant in the equation, Figure 9 is obtained which indicates the relationship between GDRP per capita and the Theil entrophy index for the oil and gas data. The curve forms a U-inverse. The cubic regression method without a constant in the equation produces an estimation of the higher R-squared value compared to the cubic regression method using a constant in the equation, or the linear regression method with or without a constant in the equation (results of the estimation are attached).
The curve above indicates that the Kuznets hypothesis applies in Indonesia. The Kuznets hypothesis states that in the early stages of economic growth, the distribution of income tends to be poor and the following stages will indicate more favourable distribu-tion of income. Distribudistribu-tion of income will be poor in the early stages because of the natural characteristics of structural change (Todaro and Smith, 2003: 214-215).
Based on the intersection between the assisting lines with the maximum point of the
GDRP per Capita
10000000 9000000 8000000 7000000 6000000 5000000 4000000 3000000
T
hei
l E
nt
rophy
I
ndex
.42
.40
.38
.36
.34
.32
Rsq = 0.9986 thru origin
Source: Processed from BPS (1988-2008)
curve, the level of the GDRP per capita where disparities begin to decline can be determined. Disparity will decline when the GDRP per capita is larger than Rp 3.958.337,00. If the GDRP per capita remained below Rp 3.958.337,00, the disparity will not decline.
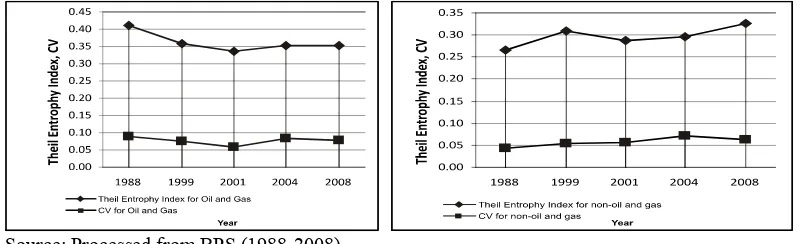
Similar to proving the Kuznets hypothesis for the oil and gas data, proving the validity of the Kuznets hypothesis for the non oil and gas data also uses the cubic regression without a constant in economics. By using cubic regression without a constant in the equation the Figure 10 is obtained of which indicates the relationship between GDRP per capita and the Theil entrophy index for the non oil and gas data.
The cubic regression without a constant in the equation produces an estimation with a R-squared value higher than the value when using the cubic regression with a constant or linear regression with or without a constant (results of the estimation are attached). Although a smooth U-inverse is not apparent, nevertheless this curve indicates a non-linear correlation therefore allowing the researcher to accept the notion that the Kuznets hypothesis is proven.
Based on the intersection between the assisting line and the maximum point of the curve, the GDRP level where disparity will begin to decline can be determined. Disparity will decline when the GDRP per capita is as large as Rp 4.797.889,00. If the GDRP per capita remains below Rp 4.797.889,00, the disparity will not decline.
4. Results of the Absolute Convergence and Conditional Convergence Analysis
The convergence analysis in this study comprises of absolute convergence and conditional convergence. Table 4 presents the results of the absolute convergence analysis. Based on the results of the absolute convergence analysis, in 1988-1999 and 2004-2008, convergence took place in Indonesia. Convergence in Indonesia demonstrates that less developed provinces were developing more rapidly than already advanced provinces and therefore able to chase the progress of the more advanced provinces. The result of the analysis for the period 1988-1999 is consistent with the analysis of Hill et. al. (2009). Based on Hill et al’s study (2009), 1986-1992 and 1992-1997 period, convergence occured in Indonesia.
PDRB Per Kapita
9000000 8000000 7000000 6000000 5000000 4000000 3000000 2000000
In
d
e
k
s
E
n
tr
o
p
i
T
h
e
il
.36
.34
.32
.30
.28
.26
.24
Rsq = 0.9978 thru origin
Source: Processed from BPS (1988-2008)
Convergence in 1988-1999 took gradually as large as 1,32% per year. Based on the speed of convergence, it would require 52 years to cover half of the disparities that existed. The speed of convergence for 2004-2008 was more rapid compared to convergence in 1988-1998. The speed of convergence in 2004-2008 was as large as 1,61% per year. Based on the speed of convergence, it would require 43 years to cover half of the disparities that existed. Table 5 indicates the speed of convergence and the half-life of convergence (time required to cover half of the initial disparity) for each period where convergence had taken place.
Table 5. Speed of Convergence and the Half-Life of Convergence
Period Speed of
Source: Processed from BPS (1988-2008) Description:
1. Results of the estimation for 1999-2001 did not indicate convergence or divergence in Indonesia because the results of the esti-mation did not pass significance tests. 2. Results of the estimation for the period
2001-2004 indicate that divergence had taken place in Indonesia.
Divergence occurred in 2001-2004. Diver-gence implies that less developed provinces have not been able to chase the progress of already advanced provinces. In order to eradicate inter-provincial divergence, the role of the central government is vital. The central government must explicitly appoint the regions as targets of development. According to the theory of planned adjustment, diver-gence occurs because the competitive powers of the market have failed to create the distri-bution of economic activity according to the optimal organization of space (Soepono, 1991: 181).
Table 4. Results of the Absolute Convergence Analysis
Independent variable Estimation results 1988-1999
Estimation results 1999-2001
Estimation results 2001-2004
Estimation results 2004-2008
R-squared 0,151683 0,062295 0,108566 0,095431
Adjusted R-squared 0,116337 0,023223 0,076729 0,065278
F-statistic 4,291319** 1,594391 3,410061* 3,164957*
Source: Processed from BPS (1988-2008) Description:
The result of the absolute convergence analysis for 2001-2004 requires further ana-lysis using conditional convergence. Regional economic growth is not merely influenced by GDRP per capita and therefore further analysis is required by inserting additional explanatory variables beyond GDRP per capita.
It is difficult to know for certain whether convergence or divergence had taken place in 1999-2001. This is because the results of the estimation did not pass significance testing. The insignificant results indicate that the other variables beyond the model have greater influence towards economic growth. In addi-tion, the insignificant results of the estimation can also be due to volatile national macro-economic conditions.
Table 6 indicates the results of the conditional convergence analysis in Indonesia for the period 1988-1999, 1999-2001, 2001-2004, and 2004-2008. Based on the results of the conditional convergence analysis, in 1988-1999, 1999-2001, and 2004-2008, conver-gence had occurred in Indonesia. Converconver-gence in Indonesia indicates that disadvantaged
provinces were developing more rapidly compared to already advanced provinces and therefore are able to persue the progress of advanced provinces.
Convergence in 1988-1999 occurred with a speed of 2,51% per year. Based on the speed of convergence, 27 years would be required to cover half of the disparities that existed. In this period, the variable GDRP per capita and revenue sharing funds significantly influenced regional economic growth. Revenue sharing funds positively influenced regional economic growth. This confirms Classical and Neo-classical economical perspectives that stock of capital goods influences economic growth. Other variables-for example oil and gas resources and general allocation funds-did not influence regional economic growth. Table 7 indicates the speed of convergence and the half-life of convergence (time required to cover half of the initial disparity) for each period where convergence had taken place.
Speed of convergence in 1999-2001 was as large as 14,37%. Based on the speed of convergence, 5 years would be required to
Table 6. Results of Conditional Convergence Analysis
Independent Variable Estimation Results 1988-1999 Dummy variable oil
and gas
R-squared 0,452660 0,320585 0,181686 0,307734
Adjusted R-squared 0,343192 0,184703 0,018024 0,157242
F-statistic 4,135085** 2,359277* 1,110126 2,044846*
Source: Processed from BPS and Department of Finance (1988-2008) Description:
cover half of the disparity. The results of the conditional convergence analysis demonstrates that regional economic growth in 1999-2001 was not only influenced by the variable GDRP per capita but influenced by other variables, for example oil and gas resources (represented by the dummy variable oil and gas in the estimation). The presence of the oil and gas resources supports regional economic growth. Provinces which own oil and gas resources will have higher economic growth compared to provinces wich have less oil and gas resources. This confirms Classical and Neo-classical economic perspectives that natural resources serve as factors which influence a regions economic growth.
Table 7. Speed of Convergence and the Half-Life of Convergence
Period Speed of
Source: Processed from BPS and Department of Finance (1988-2008)
Description:
The estimation results for 2001-2004 cannot indicate whether convergence or divergence had occurred in Indonesia because the estimation results did not pass significance tests.
In 2004-2008, speed of convergence was 2,51% per year. Based on the speed of convergence, 27 years would be required to cover half of the disparities. Economic growth in 2004-2008 was influenced by the variable GDRP per capita and revenue sharing funds. Revenue sharing funds positively influenced regional economic growth. Increased revenue sharing funds distributed for each region will push economic growth in each region.
In 2001-2004, it cannot be identified whether convergence or divergence occurred. This was indicated by the results of the estimation which did not pass significance
tests even with the insertion of additional explanatory variables. Insignificant estimation results are frequently encountered in cross sectional regressions, as was found in Wibisono (2003). The common difficulties encountered in cross-section regression are due to the explanatory variables which are vulnerable to measurement errors. This is influenced by volatile national macroeconomic conditions.
With regard to the difficulties in cross-section regression, conditional convergence analysis was also conducted using panel data. By using panel data, the additional sample information is provided. Information which is in chronological order is useful for variables that are highly diverse between different periods of time.
The conditional convergence analysis using panel data is performed by dividing the research period to the 1988-2000 period and 2001-2008 period. This division is based on the enactment of Government Regulation No 84 Year 2001 to replace Government Regula-tion No 104 Year 2000 concerning Balance Funds. The enactment of Government Regula-tion No 84 Year 2001 resulted in the different methods of calculating balance funds (Kuncoro, 2004b: 30).
The result of the conditional convergence analysis using the panel data for 1988-2000 indicated that convergence had occurred in Indonesia and therefore allowing the variables influencing regional economic growth to be determined. These variables comprise of general allocation funds and revenue-sharing funds. The dummy variable of oil and gas does not influence economic growth for 1988-2000. The result of the conditional convergence analysis for 1988-2000 is presented in Table 8.
period 1988-2000, these variables comprise of general allocation funds and revenue-sharing funds. The dummy variable of oil and gas does not influence economic growth. Otherwise, the dummy variables of oil and gas, general allocation funds, and revenue sharing funds influenced regional economic growth for the period 2001-2008.
Table 8. Results of Analysis for Conditional Convergence Analysis (Panel Framework, 1988-2000)
Independent Variable Pooled
Log (Real GDRP Per Capita) -0.112811*** (-15,53734) Dummy Variable Oil and Gas -0,079923 (-1,389470) General Allocation Funds 1,99*** (3,518476)
Revenue Sharing Funds 1,55**
(3,224997) R-squared 0,571124
Adjusted R-squared 0,543154
F-statistic 20,41905*** Source: Processed from BPS and Department of
Finance (1988-2008)
Description:
The regression uses the GLS method with
cross section weights without using intercepts for estimation to obtain an estimation model that would pass significance tests. The figures in the parentheses indicate the t-Statistic. *** indicates that the independent variable is significant at α=1% and ** indicates that the independent variable is significant at α=5%.
The significance of general allocation funds variable and revenue sharing funds variable indicate that the existence of general allocation funds and revenue sharing funds that are distributed to each province will push economic growth in those provinces. General allocation funds and revenue sharing funds for each province serves as capital to develop the region. The estimation results are consistent with Classical and Neoclassical economic perspectives that the total stock of capital
goods serve as factor that influence economic growth of a region. The insignificance of the dummy variable oil and gas indicates that the assumption that provinces with oil and gas resources will have higher economic growth compared to provinces with less oil and gas resources is not valid for the period 1988-2000. On the contrary, the significance of the dummy variable of oil and gas indicates that the existence of oil and gas resources pushes regional economic growth, therefore confirm-ing the hypothesis that provinces ownconfirm-ing oil and gas resources will have higher economic growth compared to the provinces without oil and gas resources.
Based on the conditional convergence analysis, the speed of convergence and the half-life of convergence (time required to cover half of the initial disparity) can be determined. Table 9 indicates the speed of convergence and the half-life of convergence for the period 1988-2000 and 2001-2008.
Table 9. Speed of convergence and The Half-Life of Convergence
Period Speed of
Source: Processed from BPS and Department of Finance (1988-2008)
Speed of convergence for the period 1988-2000 was as large as 0,99% per year. Based on the speed of convergence, it requires 69 years to cover half of the disparities that exist. The period 2001-2008 indicates a more rapid convergence compared to the period 1988-2000. The speed of convergence for the period 2001-2008 was as large as 1,15%. Based on the speed of convergence, it requires 60 years to cover half of the disparities that exist.
influenced regional economic growth for each period. This shows the dominant role of general allocation funds and revenue sharing funds on regional economic growth. In addition, this also indicates that no different roles exists between general allocation funds and revenue sharing funds towards regional economic growth for the period 1988-2000 (before the enactment of Government Regulation No. 84 Year 2001) or the period 2001-2008 (after the enactment of Govern-ment Regulation No. 84 Year 2001).
CONCLUSIONS AND POLICY IMPLICATIONS
1. Conclusions
The Theil entrophy index analysis allows the researcher to identify that disparities of GDRP per capita for oil and gas for the period 1988-2008 tended to decline, while disparities for GDRP per capita for non oil and gas tended to increase. Although having a tendency to increase, the level of disparity of the GDRP per capita for non-oil and gas were smaller compared to disparity of GDRP per capita for oil and gas.
The results of the coefficients of variation analysis is consistent with the results of the Theil entrophy index, which indicates a tendency of declining with regard to disper-sion and disparity of GDRP per capita for oil and gas for the period 1988-2008. Opposite conditions are evident for the dispersion of GDRP per capita of non oil and gas in Indonesia. Dispersion for the period 1988-2008 tended to increase.
The results of the Kuznets hypothesis tests indicate that for the period 1988-2008, the Kuznets hypothesis is valid in Indonesia. In the initial stages of economic growth, the distribution of income was poor and the following stages indicated more favourable outcomes of income distribution.
Based on the absolute convergence analysis and the conditional convergence
analysis, it can be concluded that in each presidential term in Indonesia, convergence of GDRP per capita had occurred. The absolute convergence analysis for the period 2001-2004 indicates divergence of GDRP per capita. The results of the absolute convergence analysis for those periods cannot be simply concluded this way because regional economic growth is not solely influenced by GDRP per capita, but also other explanatory variables that also contribute in influencing regional economic growth. Therefore, the conclusion of this study is drawn from the conditional convergence analysis using panel data. The conditional convergence analysis using the panel data is more favourable to analyze a region’s convergence compared to absolute convergence and conditional convergence using the cross-section method. This is because conditional convergence using panel data also involves other explanatory variables beyond GDRP per capita and therefore making the analysis more accurate in resembling actual conditions, in addition to overcoming problems that are frequently encountered within cross-section analysis. The results of the conditional convergence analysis using panel data, indicates that convergence took place in Indonesia during the observation period. Overall, the variables that influence regional economic growth in Indonesia include GDRP per capita, oil and gas resources, general allocation funds, and revenue sharing funds.
2. Policy Implications
Tenggara with 28 districts, Maluku 15 districts, and Papua 35 districts. Almost 70% of disadvantaged regions are located on East Indonesia (Ministry for Development of Disadvantaged Region, 2010). With regard to the managing the problem of disadvantaged regions, the programs formulated by the government should meet the actual conditions and needs of each region. Development programs would succeed in a region when the policies are appropriate for the conditions of the particular region.
The variable of oil and gas, general allocation funds, and revenue sharing funds positively influence regional economic growth. The provinces that own more oil and gas resources are said to have more capital for regional development compared to provinces lacking oil and gas resources. In light of this, provinces lacking oil and gas resources should receive the attention of the central government. Need more programs to encourage financial independence of oil and gas resource-poor provinces.
REFERENCES
Arifin, Z. and M. Kuncoro, 2002. “Konsen-trasi Spasial dan Dinamika Pertumbuhan Industri Manufaktur di Jawa Timur” [Spatial Concentration and the Dynamics of Industrial Growth in East Java]. Empirika 11(1): 49-64.
Barro, R.J. dan X. Sala-i-Martin, 1995. Eco-nomic Growth. New York: McGraw-Hill, Inc.
Forbes, K., 2000. “A Reassessment of the Relationship Between Inequality and Growth”. The American Economic Review 90(4): 869-887.
Haryanto, 2001. “Indonesian Regional Econo-mic Development: A Neoclassical Growth Analysis”. Majalah Perencanaan Pemba-ngunan Bappenas 24: 1-11.
Hill, H., B.P. Resosudarmo, dan Y. Vidyattama, 2009. “Economic Geography of Indonesia: Location, Connectivity, and
Resources”. Reshaping Economic Geo-graphy in East Asia. Washington, D.C.: The World Bank.
Jones, B., 2002. “Economic Integration and Convergence of Per Capita Income in West Africa”. African Development Bank. Oxford: Blackwell Publishers.
Kementerian Energi dan Sumber Daya Mineral [Ministry of Energy and Mineral Resources], 2007. “Peranan Sektor Pertambangan Dalam Mendorong Perekonomian Nasional” [The Role of Mining Sector in Boosting the National Economy], accessed on May 8th, 2010.
Available at http://www.esdm.go.id/index.php?
Kementerian Pembangunan Daerah Tertinggal [Ministry of Development of Left Behind Regions], 2010. “70 Persen Daerah Tertinggal di Kawasan Timur” [70 Percent of Left Behind Regions are from Eastern Regions], accessed on May 8th, 2010.
Available at http: //kemenegpdt.go.id/uploads/artikel.
Kuncoro, M., 2002. Analisis Spasial dan Regional [Spatial and Regional Analysis]. Yogyakarta: UPP AMP YKPN.
Kuncoro, M., 2004a. “Adakah Perubahan Konsentrasi Spasial Industri Manufaktur di Indonesia [Is There a Change of Spatial Concentration of Manufacturing Industries in Indonesia?], 1976-2001?”. Jurnal Eko-nomi dan Bisnis Indonesia 19(4): 1-20. Kuncoro, M., 2004b. Otonomi dan
Pembangunan Daerah: Reformasi, Perencanaan, Strategi, dan Peluang [Autonomy and Regional Development; Reforms, Planning, Strategy, and Opportunity]. Jakarta: Penerbit Erlangga. Lee, H.A., K.P. Lim, dan M. Azali, 2005.
“Income Disparity between Japan and ASEAN-5 Economies: Converge, Catching Up or Diverge?” Economics Bulletin 6(13): 1-20.
“Gambaran Umum Propinsi Kepulauan Riau” [General Description of the Islands of Riau], accessed on May 7th, 2010. Available at http: //kepriprov.go.id.
Quah, D.T., 1996. “Regional Convergence Clusters across Europe”. European Economic Review 40: 951-958.
Sibero, A., 1985. “Peningkatan Kemampuan Perencanaan dan Pelaksanaan Pemba-ngunan Daerah” [Improving Abilities of Planning and Implementing Regional Development]. Prisma 12: 3-14.
Soepono, P., 1991. Pengantar Ekonomi Regional: Teori Lokasi dan Pembangunan Regional [Introduction to Regional Eco-nomics: Theory of Location and Regional Development]. Yogyakarta: Pusat Antar Universitas – Studi Ekonomi Universitas Gadjah Mada.
Theil, H. dan Y. Friedman, 1973. “Regional Per Capita Income Inequalities: Point Estimates and Their Standard Errors”.
Journal of the American Statistical Association 68(343): 531-539.
Todaro, M.P. dan S.C. Smith, 2003. “Eco-nomic Development”. (eight edition). Essex: Addison Wesley.
Wibisono, Y., 2001. “Determinan Pertum-buhan Ekonomi Regional: Studi Empiris Antar Propinsi di Indonesia” [Deter-minants of Regional Economic Growth: An Empirical Study between Indonesia Provinces]. Jurnal Ekonomi dan Pembangunan Indonesia 1(2): 52-83.
Wibisono, Y., 2003. “Konvergensi di Indonesia: Beberapa Temuan Awal dan Implikasinya” [Convergence in Indonesia: A Number of Preliminary Findings and its Implications]. Ekonomi dan Keuangan Indonesia 51(1): 53-82.