Dachriyanus et al., (2014) Int. J. Res. Pharm. Sci., 5(4), 282‐285
282 ©JK Welfare & Pharmascope Foundation | International Journal of Research in Pharmaceutical Sciences
Quantification of α‐mangostin in Bark Extract of
Garcinia cowa
Roxb
Roslinda Rasyid1,2, Fatma Sri Wahyuni 1, Yanwirasti2 and Dachriyanus*1,3 1
Kandis, Garcinia cowa Roxb, traditionally has been used for many purposes. Many parts of G. cowa have been used in traditional folk medicine as antipyretic and anti‐inflammatory. α‐mangostin represents the majority of the clinical benefits of this herbal medicine. It is reasonable and logical to determine the concentration of α‐ mangostin as a chemical marker for the quality control of G. cowa and its products. The aim of this study was to set up a validated and stability‐indicated isocratic reverse phase high performance liquid chromatographic (RP‐ HPLC) method for quality control and quantity determination of α‐mangostin from ethanol extract of G. cowa. The assay was fully validated and shown to be linear (r2 = 0.999), sensitive (LOD = 0.04 μg/ml and LOQ = 0.16 μg/ml) and precise (intra‐day variation ≤ 1.6 %, inter‐day variation ≤ 4.3%). Accuracy of the method was determined by a recovery study conducted at 3 different levels, and the average recovery was 86.67%. Total analysis was ~ 15 min. The present method should be useful for analytical research and for routine quality control analysis of α‐ mangostin in ethanol extract of G. cowa.
Keywords: High performance liquid chromatography; α‐Mangostin; Garcinia cowa
INTRODUCTION
Kandis, Garcinia cowa Roxb, traditionally has been used for many purposes. Many parts of Garcinia cowa have been used in traditional folk medicine as antipyretic and anti‐inflammatory (Lim, 2012). Previous phytochemical investigations of G. cowa resulted in the isolation of tetraprenyltoluquinone ([2E, 6E, 10E]‐(+)‐ 4b‐hydroxy‐3‐methyl‐5b‐(3,7,11,15‐tetramethyl‐2, 6, 10, 14‐hexadecatetraenyl‐ 2‐cyclohexen‐ 1‐one), xanthones (Wahyuni et al., 2004), benzophenones (Trisuwan and Ritthiwigrom, 2012), dihydrobenzopyran (Siridechakorn et al., 2012), acylphloroglucinol (Xu et al., 2010), depsidone (Cheenpracha et al., 2011). The phenolic constituents have been reported to possess a wide range of biological and pharmacological properties, such as antibacterial (Siridechakorn et al., 2012, Auranwiwat et al., 2014), antioxidant (Dachriyanus et al., 2003), antiinflammatory (Panthong et al., 2009) and cytotoxic activities (Xu et al., 2010). Previous study found that a‐mangostin was one of the
component of the skin bark of G. cowa. This compound represents the majority of the clinical benefits of this traditional medicine. Therefore, the aim of this study is to set up a reverse‐phase HPLC–UV method at 243 nm for quality control and quantity determination of α‐ mangostin from G. cowa bark extract. Thus ,it can be applied for routine measurement of α‐mangostin in any product preparations, as well as in crude extract of
G. cowa. This method was fully validated according to International Conference on Harmonization (ICH) of note for guidance on validation of analytical proce‐ dures (ICH, 1995).
MATERIALS AND METODS Chemicals and reagents
Standard α‐mangostin was purchased from Wuxi Gorunjie Natural‐ Farma Co LTD (China), Ethanol (Merck), Acetonitrile (HPLC grade) and formic acid (AR grade). The water was purified using a Milli‐Q system (Milford, MA).
Instrumentation and chromatographic condition
The HPLC system (Shimadzu, Kyoto, Japan) consisted of a quaternary solvent delivery system (LC‐10ADvp), autosampler (SIL‐10ADvp), solvent degasser (DGU‐ 14A), and UV detector (SPD‐10ADvp). The UV spectra were recorded in the 200–400 nm range, with a PDA (Agilent 1100 HPLC system), and the quantification
Dachriyanus et al., (2014) Int. J. Res. Pharm. Sci., 5(4), 282‐285
©JK Welfare & Pharmascope Foundation | International Journal of Research in Pharmaceutical Sciences 283
wavelength was set at 243 nm. Chromatographic separation was carried out at room temperature using a Hypersil BDS C18 analytical column Shimadzu ®Shimp‐ pack VP‐ODS (250 × 4.6 mm i.d., 5 μm) with C18 guard column. The isocratic mobile phase consisted of 0.4% formic acid–acetonitrile (20:80, v/v), which was pumped at a flow rate of 1 ml/min. The injection volume was 20 μL.
Preparation of plant materials
The bark of G. cowa were collected from Batu busuk, Limau manis, West Sumatera. The plants sample were identified by taxonomist from Herbarium ANDA , Andalas University. The bark were dried at 50°C, powdered, and extracted by ethanol 70%. The ethanolic extract of bark were then concentrated under reduced pressure. The sample was prepared by accurately weighing 10 mg of cowa bark extract and put it into a 100‐ml volumetric flask. Approximately 60 ml of ethanol was added, and the solution was sonicated for 15 min. The solution was allowed to cool to room temperature before being filled up to the final volume of 100.0 ml. After centrifugation for ~ 10 min, 10 ml of the supernatant was diluted to 100 ml, in a
volumetric flask by acetonitrile and filtered through a 0.45‐μm filter membrane before analysis. Twenty microliters of the sample solution was directly injected into the HPLC column and separated under described chromatographic conditions.
Preparation of standards and calibration standard solution
The standard stock solutions of α‐mangostin were prepared by dissolving their accurate amount of compounds in methanol to produce a final concentration of 100 μg/ml, and it was stored at 4°C until use. These solutions were then serially diluted with methanol then to produce standard solutions of 0.5, 1, 1.5, 2, and 2.5 μg/ml.
Quantitative Analysis of α Mangostin Content
Twenty microliter of 1 µg/ml bark extract solution was injected into HPLC column was run using the proposed method. The quantity of α‐mangostin in the extract was calculated using calibration curve. Each determination was carried out in triplicate.
Validation of the method
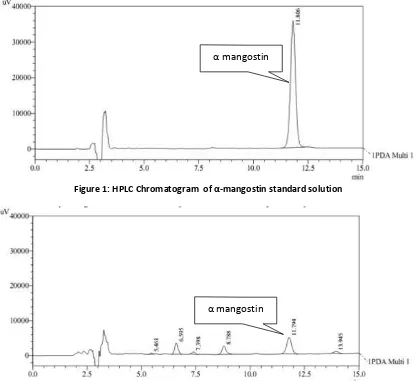
Figure 1: HPLC Chromatogram of α‐mangostin standard solution
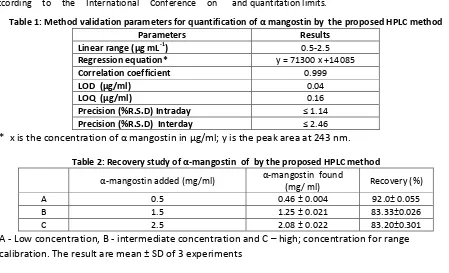
Figure 2: HPLC Chromatogram of Garcinia cowa bark extract
α mangostin
α mangostin
Dachriyanus et al., (2014) Int. J. Res. Pharm. Sci., 5(4), 282‐285
284 ©JK Welfare & Pharmascope Foundation | International Journal of Research in Pharmaceutical Sciences
Validation of the analytical method was done according to the International Conference on
Harmonization guideline (ICH, 1995). The method was validated for linearity, precision, and accuracy, limit of detection (LOD) and limit of quantitation (LOQ).
Linearity and calibration curve
Standard α‐mangostin solutions in the concentration 0.5; 1.0; 1.5; 2.0 and 2.5 μg/ml were injected into the HPLC system. The calibration curve was analyzed using the linear least‐squares regression equation. Calibration curves were constructed by plotting peak area against the concentration of standards. A correlation coefficient above 0.999 was acceptable.
Precision
The precision was determined by analyzing 0.5: 1.5 and 2.5 μg/ml of standard solution of α mangostin (n=3) . Intra‐ and inter‐day assay precision were determined as relative standard deviation (RSD). Intra‐day precission(repeatability) carried out in triplicates per day and inter‐day (intermediate) precission were performed on three separate days.
Accuracy
Determined recovery studies at three different concen‐ tration (0.5: 1.5 and 2.5 mg/m/) of the standard solution in methanol were added to the sample solution (1.32 μg/ml) and analyzed by the proposed HPLC method. The recovery and average recovery were calculated. Three determinations were performed for each concentration level.
Limits of detection and quantitation
According to ICH (1995), technical requirements for the registration of pharmaceuticals for use recommenda‐ tions, the approach based on SD of the response and
the slopes were used for determining the detection and quantitation limits.
RESULTS AND DISCUSSION
HPLC method with isocratic elution was developed for the quantification of α mangostin in the bark extracts of G. cowa. Its chromatogram showes similar pattern with a peak of α mangostin at retention time of 11.79 min (Figure 3). The identity of the peak of α mangostin was confirmed by spiking with its standard and its retention time.
Linearity of the method was confirmed by preparing standard curves of α mangostin in the range of 0,5–2,5 μg/ml. The equation for the resultant calibration curve was y = 71300 x + 14085; it showed a good correlation between analyte peak area and concentration of the α‐ mangostin with a linear regression coefficient was 0.999.
The results of LOD and LOQ were found to be 0.04 and 0.16 μg/ml, indicated sensitivity of method. The system suitability and validation parameters were given in (Table 1).
The intra‐day precision (repeatability) of the assay was determined by analysis of three difference concentration (0.5, 1.5, and 2.5 μg/ml) of standard α mangostin at the same day. For determination of inter‐ day (intermediate) precision, the samples were analysed on three difference days.The percentage relative standard deviation of the peak area of α mangostin is shown in Table 1. These values were within limits (<5%) as required by AOAC, 2002.
The accuracy of the method was determined by adding known amount of α mangostin standard in known extract samples. The mean values of the percentage analytical recoveries for the concentration of 0.5, 1.5 and 2.5 μg/ml of α mangostin were 92.0, 83.3 and
Table 1: Method validation parameters for quantification of α mangostin by the proposed HPLC method
Parameters Results
Linear range (µg mL‐1) 0.5‐2.5
Regression equation* y = 71300 x +14085
A 0.5 0.46 ± 0.004 92.0± 0.055
B 1.5 1.25 ± 0.021 83.33±0.026
C 2.5 2.08 ± 0.022 83.20±0.301
Dachriyanus et al., (2014) Int. J. Res. Pharm. Sci., 5(4), 282‐285
©JK Welfare & Pharmascope Foundation | International Journal of Research in Pharmaceutical Sciences 285
83.20% (Table. 2) and conform with the recommendations of AOAC (Feldsine et al., 2002).
The RSD values for precision studies obtained was less than 5% which revealed that developed method was accurate and precise. The limit of detection and limit of quantification for α‐mangostin was found to be 0.04 and 0.16 μg/ml, indicates the sensitivity of the method.
α‐Mangostin content in the samples in the bark extracts G. cowa was 10.06% w/w. HPLC chromatograms of extracts showed similar pattern with a peak α mangostin at retention time of 11.79 min (Figure. 2). The identity of the peak of α mangostin in the sample chromatograms was confirmed by spiking with its standard and determination of retention time.
CONCLUSION
The proposed HPLC method promoted high precision, sensitivity and accuracy for quality control of extract of bark G. cowa. This proposed method will be useful for quantitative analysis in standardization and quality assessment of extract of bark G.cowa for pharmaceutical uses.
Acknowledgments
This research was supported by Doctoral scheme of Directorate of Higher Education, Ministry of Education and Culture, Republic Indonesia
REFERENCES
Auranwiwat C, Trisuwan K, Saiai A, Pyne SG, Ritthiwigrom T. Antibacterial tetraoxygenated xanthones from the immature fruits of Garcinia cowa, Fitoterapia 2014; 98:179‐83.
Cheenpracha S, Phakhodee W, Ritthiwigrom T, Prawat U, Laphookhieo S. A new depsidone from the twigs of
Garcinia cowa, Heterocycles 2011; 83: 1139‐1144.
Dachriyanus, Dianita R, Jubahar J. Isolasi senyawa anti‐ oksidan dari kulit batang Garcinia cowa Roxb, Jurnal Matematika dan Ilmu Pengetahuan Alam 2003; 12(2): 67‐72.
Feldsine P, Abeyta C, and Andrews WH. AOAC Interna‐ tional Methods Committee Guidelines for Validation of Qualitatitive and Quantitatif Food Microbiological Official Methods of Analysis, Jurnal of AOAC Int 2002; 85(5): 1187‐1200.
International converence on Harmonization of note for Guidence on validation of analytical procedures, text and methodology. Step 5 of ICH. 1995.
Lim TK. Edible Medicinal and Non‐Medicinal Plants, Vol. 2: Fruits, Springer Science and Business Media B.V., London, 2012, pp.29‐34.
Panthong K, Towatana NH and A. Panthong A. Cowaxanthone F, a new tetraoxygenated xanthone, and other anti‐inflammatory and antioxidant com‐
pounds from Garcinia cowa, Can J Chem 2009; 87: 1636‐1640.
Siridechakorn I, Phakhodee W, Ritthiwigrom T, Promgool T, Deachathai S, Cheenpracha S, Prawat U, Laphookhieo S. Antibacterial dihydrobenzopyran and xanthone derivatives from Garcinia cowa stem barks, Fitoterapia 2012; 83:1430‐4.
Trisuwan K, Ritthiwigrom T. Benzophenone and Xan‐ thone Derivatives from the Inflorescent of Garcinia cowa, Arch Pharm Res 2012; 35: 1733‐1738.
Wahyuni FS, Byrne LT, Dachriyanus, Dianita R, Jubahar J, Lajis NH, Sargent MV. A New ring‐reduced tetraprenyltoluquinone and a prenylated xanthone from Garcinia cowa, Aust J Chem 2004; 57: 2263‐ 2266.
Xu G, Kan WLT, Zhou Y, Song JZ, Han QB, Qiao CF, Cho CH, Rudd JA, Lin G and Xu HX. Cytotoxic acylphloroglucinol derivatives from the twigs of