227
Gadjah Mada International Journal of Business
Vol. 19, No. 3 (September-December 2017): 227-246
* Corresponding author’s e-mail: [email protected]
Can Backward-looking and Forward-looking Information
Debias the Prospect Effect in Earnings Announcements?
Jogiyanto Hartono,
1*and
Sri Wahyuni
21Faculty of Economics and Business, Universitas Gadjah Mada, Indonesia 2 Institute of Economic Science (STIE) Mahardhika Surabaya, Indonesia
Abstract: This study examines the important issue of whether additional pieces of information about the earnings’ characteristics (their quantitative description and predicted earnings) can debias the prospect effect of the earnings’ announcement. The prospect effect bias can be mitigated by the availability of clear information and an integrated disclosure. Additional information that is included with the previous infor-mation will make the investors’ beliefs stronger and it will debias any psychological effects.This research confirms the prospect effect’s bias that investors react more negatively when evaluating a company’s performance after a negative earnings information disclosure rather than react positively in evaluating the performance for a positive earnings information disclosure. The results also show that when additional pieces of information, such as a quantitative description and predicted earnings are added, they can mitigate the prospect effect’s bias. Additional information of predicted earnings as forward-looking oriented information has a stronger debiasing effect than that of additional information of a quantitative description as backward-looking oriented information.
Keywords:backward-looking oriented information; debias; forward-looking oriented information; mitigating bias; predicted earnings; prospect theory; quantita-tive description
Introduction
The prospect effect is confirmed when investors react more negatively in evaluating a company’s performance after its negative earnings information disclosure rather than when they react positively to evaluate the same company’s performance for its positive earnings information disclosure (Schrand and Walther 2000; Krische 2005). Previous re-search already showed that a single account-ing information disclosure can cause the pros-pect effect’s bias when used by investors to make their investment decisions. Examples are studies by Ferris et al. (1988), Lakonishok and Seymour (1989) and Odean (1998).
Since the prospect effect’s bias reflects irrational investors’ inaccurate decision mak-ing, it is important to conduct research to mitigate this bias. Schrand and Walther (2000) and Krische (2005) indicated that investors adjust for the prior-period event when an additional clear quantitative description is presented in the current-period announce-ment. Using this idea, this study attempts to use additional pieces of information that are believed to revise investors prior beliefs, to reduce the decision-making bias.
This research tries to test single and multiple pieces of information in earnings announcements, based on the prospect theory (Kahneman and Tversky 1979). The single earnings information announcement is used to test the prospect effect’s bias. While the multiple pieces of information in earnings announcements are used to test the debiasing effect of the prospect effect’s bias.
The underlying assumption is the pres-ence of bounded rationality (Bazerman 1994), which is the condition of an individual who has limitations on the information, memory, capacity, time, and other things
available to him/her, so the individual does not have backward- and forward-looking ori-ented prospectus information, unless the in-formation is expressed in any current an-nouncements (Wahyuni and Hartono 2010). The involvement of the psychological aspect in this study is in line with Bernard (1989) and Hartono (2004) who suggested that the research should adopt a new way to think about the market by considering the cogni-tive-psychological aspect.
In contrast to previous empirical re-search, this study uses the prospect theory to explain characteristics of the earnings’ infor-mation disclosures in a company’s perfor-mance evaluation setting. Studies into the characteristics of earnings information dis-closures are not frequently carried out, but there have been studies by Schrand and Walther (2000) and Krische (2005). They are pioneers in studying the characteristics of the earnings’ information disclosure. The char-acteristic of the earnings’ information disclo-sures they used is the transitory gain or loss on the disposal of Property, Plant and Equip-ment (PPE) in the current period’s announce-ment of the earnings. They show that every item that is disclosed in the earnings’ an-nouncements is expected to affect the per-ception of potential investors.
announcement can clarify any previous quan-titative information, thus reducing the occur-rence of the perception bias (Schrand and Walther 2000; Krische 2005, Wahyuni and Hartono 2012).
Predicted earnings information is the management’s guidance about future infor-mation. King et al. (1990) used management earnings forecasts as an earnings’ prediction. Widely, Baginski et al. (2004) stated that management often explains its earnings’ pre-diction through an attribution related to esti-mated performance. Such an attribution can be about the company’s internal activities (e.g. products and services, and organizational issues) or the company’s external activities (e.g. economic conditions, or government regulations). The attribution potentially helps investors to interpret the management’s fore-cast, even more so in the event of a possible negative forecast (bad news forecast). Not only does the management’s guidance con-tains information (Patell 1976; Penman 1980; Waymire 1984), but it is also seen to have better quality information about the foreseeable future than that contained in many analysts’ forecasts (Ajinkya and Gift 1984; Patell 1976; Baginski et al. 2004). Therefore, this study uses predicted earnings as manage-ment guidance information to proxy the for-ward-looking information (Hartono and Wahyuni 2014).
There are some matters that motivate this research as follows: first, this study not only uses single information but also uses multiple pieces of information to test the prospect effect. Second, this study is one of the few studies that use additional pieces of information, in terms of a quantitative de-scription as backward-looking information, and an earnings’ prediction as forward-look-ing oriented piece of information. Third, this
study uses an experimental research design with real investors as the exeriment’s subjects, which is rare in market based accounting re-search and is expected to inspire the devel-opment of experimental research in this field. The contributions of this research in-clude theoretical, methodological, practical, and policy contributions. The theoretical con-tribution is given by providing evidence on the debiasing prospect effect in an account-ing environment. This research supports the prospect effect and how to debias the effect. The results of this research are expected to trigger further research into the behavioral aspects of accounting.
The methodological contribution in this research relates to the use of the experimen-tal design. Experimenexperimen-tal research itself into the behavioral aspects of accounting research is not a new thing, but it is rare in accounting capital market research. Experimental mate-rial, with the setting of investors’ behavior about performance evaluations, will further inspire the development of experiment ma-terial in the field of capital market research. This study is expected to contribute to how firms determine their announcement strategies to avoid any decision-making bias in the reactions of their investors. Firms can use additional pieces of information to miti-gate the investors’ bias when they disclose a negative earning’s announcement.
forward-looking oriented information, to re-duce and even to mitigate the bias.
In the experiment, investors interpret a company’s earnings announcement and fore-cast the next period’s earnings. First, the in-vestors receive the company’s business de-scription, manipulated between subjects to be either positive or negative information. This study further manipulates, within the subjects, whether the investors used the char-acteristics of the information as a basis for evaluating the company’s performance (three types of cases) and determining the estimated earnings for the coming year. Then the sub-jects are given information of an increase or a decrease in the estimated earnings com-pared with the amount of current earnings. The subjects also answer questions about the manipulation check.
Consistent with Schrand and Walther (2000), Krische (2005) and Wahyuni and Hartono (2010, 2012), this result indicates that additional information, which is inte-grated with previous information, will make investors’ beliefs stronger, and it will debias the psychological effects, which in turn helps investors to evaluate the company’s perfor-mance. This study provides evidence that single information in an earning’s announce-ment produces a bias of the prospect effect, and any additional characteristics’ disclosure of earnings information of a quantitative description as backward-looking information, and predicted earnings as forward-looking information can mitigate the prospect effect’s bias.This study also finds that forward-look-ing oriented information is better at debiasforward-look-ing the prospect effect’s bias than backward-look-ing oriented information is.
Theory and Hypotheses
Development
Prospect Theory
The prospect theory is one of the main pillars of the behavioral finance literature. This theory was introduced by Kahneman and Tversky (1979) as a decision-making theory in uncertain or risky conditions. The prospect theory explains how selections are framed and evaluated in the decision-making process.
The prospect theory states that individu-als focus more on the prospect of gains and losses, not on total wealth. Their reference point is the status quo and assumes that ev-eryone who uses it is familiar with it. The prospect theory predicts an individual would avoid risk (risk averse) when evaluating a choice above the reference point (gain do-main) and tends to be risk seeking when evaluating choices under the reference point (loss domain). The prospect theory can ex-plain the trade-off between two parameters when evaluating organizations, namely risk and return (Fiegenbaum and Thomas 1988; Fiegenbaum 1990; Jegers 1991; Sinha 1994). In particular, organizations below their tar-get levels are found to be risk-takers, while organizations above their target levels are risk-averters. Kliger and Tsur (2011) explain the relationship between risk and return at the organization level; that firms with returns above their reference levels take less risks than do firms with returns below their reference levels.
a constant utility function, but it depends on the situation, and the expectations and norms of the individual, which develop from the basic psychology of human intuition. Stracca (2002) explains that the prospect theory is based on three assumptions as follows: first, organisms always adapt to their circum-stances. Individuals determine that gain or loss is based on a reference point, not an absolute value. Investors’ utility is assumed to be a function of the gains and losses relative to a benchmark, not a function of absolute wealth. Second, the marginal response is di-minishing. The distance of the gains and losses from the reference point shows the decreasing sensitivity. Third, pain is more ur-gent than pleasure. Therefore, people are more sensitive to losses than gains, which means a reluctance to lose.
Most researchers who examined the risk-return association under the prospect theory assumed a common reference point at the industry level, usually measured by the indus-try median or mean of returns. Fiegenbaum and Thomas (1988) and Fiegenbaum (1990) justified this selection. Lev (1969) and Frecka and Lee (1983) found that firms periodically adjust their performance and financial ratios to their industry means. Lehner (2000) found the validity of industry benchmarks to be ref-erence level proxies.
Quantitative Description and
Predicted Earnings Information
Quantitative description information is additional information, such as the manage–
ment’s explanation (management guidance) about events which have occured in one ac-counting period. The quantitative description information in this study is the management’s explanation regarding an increase (decrease) in sales stated in a positive (negative) earn-ings’ announcement. A quantitative descrip-tion disclosure in the earnings’ announcement can clarify the previous quantitative informa-tion, thus reducing the occurrence of the per-ception bias (Schrand and Walther 2000; Krische 2005, Wahyuni and Hartono 2012). A quantitative description is considered as backward-looking oriented information. It provides historical information to support the earnings’ announcement information.1
Predicted earnings information is management’s guidance about future infor-mation.2 Empirical studies about predicted
earnings information have been conducted and obtained different results. A study by Han and Wild (1987) and Pownall and Waymire (1989) showed that earnings forecasts are assumed to be less credible than other sources of information, while other studies docu-mented that earnings forecasts have an in-formation content (Patell 1976; Penman 1980; Waymire 1984). The next development is related to the study of management guid-ance that is considered to have better quality future information than an analyst’s forecast (Ajinkya and Gift 1984; Patell 1976; Baginski et al. 2004; Han and Tan 2007).
Baginski et al. (2004) explained an earning’s forecast, as a type of prospectus information, related to the estimation of the
1Prior archival evidence (Schrand and Walther 2000) and an experimental setting (Krische 2005) provides evidence
that investors evaluate a company more favorably when a clear, quantitative description of a prior-period gain is included in the current announcement and less favorably when a clear, quantitative description of a prior-period loss is included. Similarly, Wahyuni and Hartono’s (2010, 2012) experiment results suggest that a quantitative description of the prior-period gain or loss influences the investors’ judgments.
2For more information about management earnings forecasts see King et al. 1990. In this study, ‘management
performance of both a company’s internal activities (e.g. product and service issues, organizational issues) and its external activi-ties (e.g. economic conditions, or government regulations). Han and Tan (2007), by using an experiment, tested the disclosure of dif-ferent forms of management guidance and indicated that investors tend to choose guid-ance in a range of forms, rather than in an absolute form. Both the study of earnings forecasts and the study of management guid-ance usually still focus on a single reference point.
Hypotheses Development
Prospect Effect of Single
Information Hypothesis
According to Kahneman and Tversky (1979), the prospect theory predicts that an individual will avoid risks (risk averse) when evaluating choices above the reference point (gain domain) and tends to be risk seeking when evaluating choices below the reference point (loss domain). Schrand and Walther (2000), as well as Krische (2005) offer the support that investors often remember prior-period gains more in a loss condition. This research result is strengthened by Wahyuni and Hartono (2012) who state that investors will process prior-period information, ex-pressed in the current announcement, differ-ently between information containing gain and loss transitories.
Boldt (2001) found that an individual behaves more/less favorably because of the fixation effect. Individuals would be fixated by historic earnings that contain loss/profit transitories when estimating future earnings. Similarly when it is related to the phenom-enon of earnings characteristics’ information disclosure, it is believed that positive
earn-ings information disclosures will tend to make investors evaluate a company’s performance higher, while negative earnings information will tend to cause investors to evaluate the company’s performance lower, but the evalu-ation scale would be higher for negative earn-ings rather than positive earnearn-ings.
Kahneman and Tversky (1979) showed that psychologically people will react more to a loss situation than to a gain situation. Krische (2005) and Wahyuni and Hartono (2010) examined whether investors evaluate a company more favorably when information about a transitory prior-period gain, as posi-tive information, is repeated in the current-period announcement and less favorably when information about a transitory prior-period loss, as negative information, is repeated. Those results suggest that the prospect effect’s bias occurred, as the negative infor-mation caused a greater reaction than the positive information did.
Stracca (2002) explains that one of the three assumptions of the prospect theory is that pain is more urgent than pleasure, so people are more sensitive to losses than gains. Therefore, the prospect effect bias is hypoth-esized as follows.
H1: Investors will react more negatively in evaluat-ing a company’s performance based on a nega-tive earning’s information disclosure rather than react positively in evaluating the company’s per-formance based on a positive earning’s infor-mation disclosure.
Debiasing Prospect Effect of
Additional Multiple Pieces of
Information Hypothesis
repetition of information about transitory prior-period events in the current earnings announcement affect investors’ adjustments to the events, and their evaluations of earn-ings performance. Krische (2005) indicated that investors adjust for the prior-period event when a clear, quantitative description is pre-sented in the current-period announcement, but not when the description is absent, even though investors had previously identified the event. The experiment’s results by Wahyuni and Hartono (2012) suggested that the stra-tegic disclosure of prior-period benchmarks influences the investors’ judgments when evaluating performance.
Individuals tend to make their decisions based on the information which exists in their memories. The availability of information is deduced from a heuristic concept (Simon 1957; Kahneman and Tversky 1979). Based on this assumption, it can be explained that a quantitative description of prior-period gains or losses, and predicted earnings included in the current earnings announcement, will serve as clues and help investors to recall pieces of information already in their memories, which can be of great help to individuals in calcu-lating the adjusted earnings (Krische 2005; Wahyuni and Hartono 2010, 2012).
A quantitative description information disclosure, as backward-oriented informa-tion, is management’s explanation regarding the increase or decrease in sales provided in an earning’s announcement. Additional quan-titative description disclosures in earnings announcements can clarify the quantitative information, and thus can reduce the occur-rence of perception bias (Schrand and Walther 2000; Krische 2005, Wahyuni and Hartono 2012). Similarly, recent research into compre-hensive income disclosures (Maines and McDaniel 2000), and the accuracy of prior
estimates (Hirst et al. 2003) has also docu-mented that the presentation format used can affect analysts’ and individual investors’ evaluations of performance.
Predicted earnings information, as for-ward-oriented information, was examined by Baginski et al. (2004) and Han and Tan (2007). Baginski et al. (2004) stated that managers often explain their earnings fore-casts through attributions related to their es-timations of performance, both for the company’s internal activities (e.g. product and service issues, organizational issues) and its external activities (e.g. economic conditions, or government regulations). The predicted earnings information in this study is defined as the earnings’ forecast by the company’s management, which is expressed as a percent-age of the earnings, accompanied by a quali-tative explanation of the concrete steps taken by the management to achieve their predicted earnings.
H2: The additional pieces of information of the earnings’ characteristics announcement (the quan-titative description as backward-looking infor-mation and predicted earnings as forward-look-ing information) will debias the prospect effect of earnings announcement disclosure.
Research Method
Experiment Design
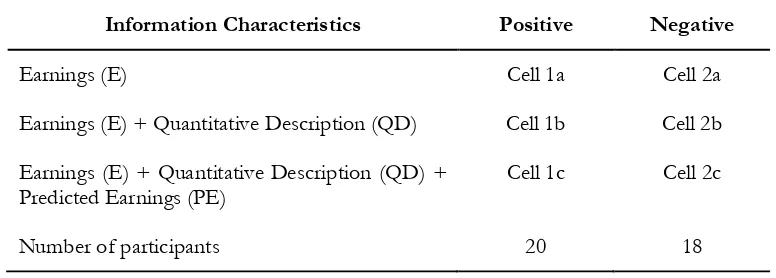
This research uses an experiment to test causality relations with some manipulated variables to answer the research problems. The experimental method is chosen for use in this study because it can control any tested and extraneous variables affecting the cau-sality relations. The experiment in this study uses a combination of between-subjects and within-subjects designs, with a 2 x 3 mixed factorial design, as seen in Table 1. The 2 x 3 experimental method in this research in-cludes: (1) earnings information (two condi-tions: positive earnings and negative earn-ings); (2) earnings characteristic disclosure [three conditions: earnings information (E), earnings information (E) plus quantitative description (QD), and earnings information
(E) plus quantitative description (QD) plus predicted parnings (PE)].
A between-subjects design compares earnings information between positive and negative earnings with subjects in different groups, to test the prospect effect’s bias (H1). The within-subjects design compares the ef-fects of different treatments on the same sub-jects in a group. The different treatments are the information’s content (earnings, earnings plus quantitative description and earnings plus quantitative description plus predicted earnings) which are used to test the debias prospect’s effect (H2).
In a between-subjects design, each sub-ject gets a case description, while in the within-subjects design, each subject gets more than one case descriptions (Harsha and Knapp 1990). Moreover, it is explained that the use of the between-subjects experiment is based on the reason that the method is able to test the effect of any interaction from the inde-pendent variable toward the deinde-pendent vari-able, and to avoid the occurrence of the de-mand effect that occurs when the subjects know the direction, from the conditions given to them.
Table 1. Experiment Design 2 x 3
Signs of Earnings Information
Information Characteristics Positive Negative
Earnings (E) Cell 1a Cell 2a Earnings (E) + Quantitative Description (QD) Cell 1b Cell 2b Earnings (E) + Quantitative Description (QD) +
Experiment Participants
This research uses an 2 x 3 mixed ex-perimental design with 38 investors consist-ing of 15 males and 23 females as the experiment’s participants. On average, the subjects are 27 years old. Out of the original 55 subjects, 6 of them could not be analyzed because of incomplete data and 11 people were declared to have failed the manipula-tion check. Of the 38 subjects, 20 subjects were assigned randomly to the positive earn-ings group and the other 18 to the negative earnings group.
This experiment was conducted using a personnel based approach, on a voluntary basis and dependent on the willingness of the subjects. Experiments using this approach are conducted on a one-by-one basis for each subject, in contrast to a laboratory experiment which is conducted in a specific room with all the subjects at once. The personnel based approach makes it easy for each subject to determine the time and location, according to his/her availability, for the execution of the experiment.
Recruitment was done through coopera-tion with the stock exchanges, educacoopera-tional institutions, and various already established relationships in Yogyakarta.3 The criteria for
the participants in this study are they should be investors who have undertaken some in-vestment activities and have knowledge of, and at least five years experience in, the fields of investment, the capital markets and the analysis of financial statements. The experi-ment was done by a paper and pencil test.
Research Variables and Their
Measurements
In this experiment, the dependent vari-able is the investors’ evaluations of the company’s performance, measured by the in-vestors’ earnings forecasts. The investors are asked to interpret an earnings’ announcement, and then make an earning’s forecast for the next year. This study uses earnings forecasts as a measure of the investors’evaluations of performance, because they are important components for value determinations (Ohlson 1995; Lee 1999).
The independent variables in this study are the factors of the treatment of the 2x3 mixed design, which are between-subjects for earnings information disclosure (two levels: Positive earnings and negative earnings) and within-subjects for any additional pieces of information when evaluating the company’s performance (three levels: Earnings, earnings plus quantitative description, and earnings plus quantitative description plus predicted earnings). First, investors receive a descrip-tion of the company’s business, manipulated for the between-subjects to be either posi-tive or negaposi-tive information. Investors were also asked to identify the amount of histori-cal earnings, including nonrecurring events (prior-period gain/loss from the sale of fixed assets). This allows the researcher to verify that the investors had previously identified the information needed to adjust for that event when asked later to forecast the earn-ings.
3 Time for the data’s collection for a personnel based approach experiment is longer than for a laboratory
This study further manipulated for the within-subjects, whether the investors used the characteristics of the information as a basis for evaluating the company’s perfor-mance (three types of cases) and determin-ing the amount of the earndetermin-ings’ estimation for the coming year. Then the subjects were given information of an increase or a decrease in the estimated earnings compared with the amount of the current earnings. The subjects also answered questions about the manipu-lation check.
In this study, quantitative description information is the management’s explanation regarding the increase or decrease in sales stated in the earnings’ announcement, which occurred during one accounting period. Pre-dicted earnings are defined as the earnings forecast by the company’s management, which is expressed as a percentage of the earnings, accompanied by a qualitative explanation of the concrete steps taken by the management to achieve the predicted earnings.
Experiment Material
The experiment’s material uses material taken from Krische’s study (2005), with some adjustments to the story’s context in order to make it realistic for the Indonesin setting. The case setting is a manufacturing company pro-ducing snacks. In this case, an earnings’ an-nouncement, either positive or negative, is presented to each group. The positive earn-ings group was provided with case materials with the initial earnings’ value set at Rp530,000.00, and the negative group was provided with case materials with an initial earnings’ value of Rp525,000.00.
Experiment Task and Procedure
The subjects in this study were ran-domly assigned to two groups, one of which
received positive earnings information and the other received negative earnings informa-tion. Each participant was given written in-structions and case material developed from the study by Krische (2005). All the partici-pants had access to their own calculator.
There were four steps in this experi-ment. First, the participants were given a de-scription of the company’s business. In this step, they were also provided with initial earn-ings values of Rp530,000.00 and Rp525,000.00 for the positive and negative earnings announcements, respectively.
Second, the participants were given one of three treatments. These were earnings (E); earnings (E) + quantitative description (QD); and earnings (E) + quantitative description (QD) + predicted parnings (PE) pieces of information. Earnings information (E) con-tains information about the current and pre-vious years’ earnings balances, and their earn-ings’ components. Quantitative description (QD) information is the management’s expla-nation regarding the increase or decrease in sales stated in their earnings announcement, which occurred during one accounting period. Predicted earnings (PE) is the earnings’ fore-cast by the company’s management, expressed as a percentage of the earnings accompanied by a qualitative explanation of the concrete steps taken by the management to achieve the predicted earnings. Step three was the de-mographic data’s collection, and the last step was a debriefing for the subjects.
Manipulation Check
of the estimation that they made, whether it is higher or lower than the current earnings. The magnitude of the estimation is said to be higher when there is an increase of Rp10,000.00 or its multiples, and it is said to be lower if there is a decrease of Rp10,000.00 or multiples thereof. If a sub-ject did not answer as instructed, then the subject was declared as being unqualified. The estimation magnitude of Rp10,000.00 or its multiples is either a positive or nega-tive change to the earnings’ forecast, which were allowed when the subjects evaluated the firm’s performance in the experiment.
Hypotheses Testings
The data’s analysis technique used in this experiment is the Analysis of Variance (ANOVA). The reason to use this analysis method is to compare some of the means dif-ferences among the subjects’ estimations of the earnings.
Research Results
Hypotheses Testing Results
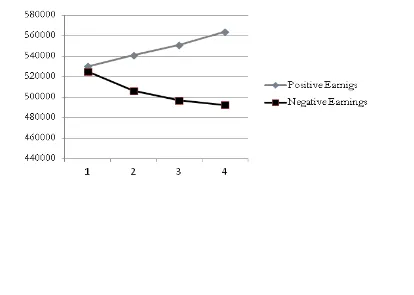
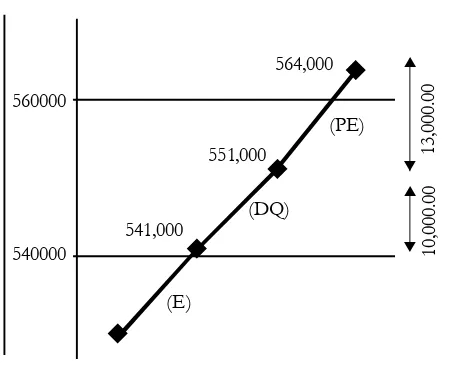
Table 3 shows the means of the inves-tors’ earnings forecasts for the 2x3 mixed design. The subjects responded positively from Rp530,000.00 to Rp541,000.00 for positive Earnings (E) information, which in-creased to Rp 551,000.00 for positive Earn-ings (E) + Quantitative Description (QD) information, and increased again to Rp564,000.00 for positive Earnings (E) + Quantitatve Description (QD) + Predicted Earnings (PE) pieces of information.
Table 3 also shows the subjects re-sponded negatively to negative information. The subjects had a negative response from Rp525,000.00 to Rp506,111.11 for negative Earnings (E) information, decreasing to Rp496,666.67 for negative Earnings (E) + Quantitatve Description (QD) pieces of
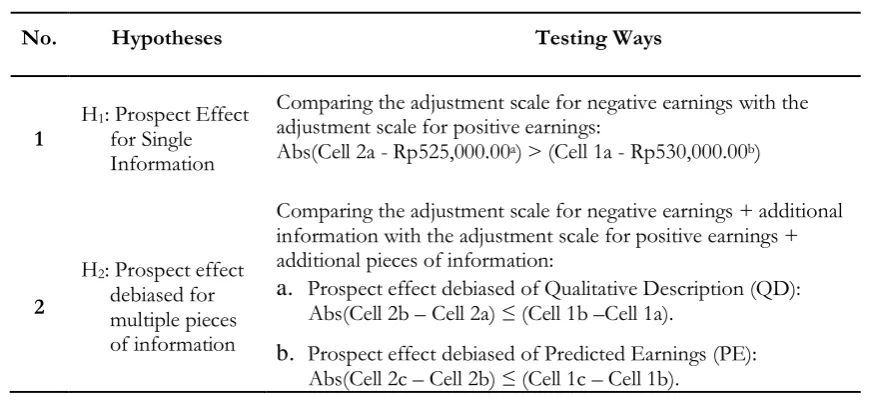
in-No. Hypotheses Testing Ways
1 H1: Prospect Effect for Single Information
Comparing the adjustment scale for negative earnings with the adjustment scale for positive earnings:
Abs(Cell 2a - Rp525,000.00a) > (Cell 1a - Rp530,000.00b)
2
H2: Prospect effect
debiased for multiple pieces of information
Comparing the adjustment scale for negative earnings + additional information with the adjustment scale for positive earnings + additional pieces of information:
a. Prospect effect debiased of Qualitative Description (QD):
Abs(Cell 2b – Cell 2a) ≤ (Cell 1b –Cell 1a).
b. Prospect effect debiased of Predicted Earnings (PE):
Abs(Cell 2c – Cell 2b) ≤ (Cell 1c – Cell 1b).
Table 2. Hypotheses Testing
Notes:
formation, and decreasing again to Rp492,222.22 for negative Earnings (E) + Quantitatve Description (QD) + Predicted Earnings (PE) pieces of information.
Subjects’ estimation means for positive and negative pieces of information can be graphically presented as in Figure 1.
Characteristic Disclosure
Earnings Information Positive Earnings (in Rp)
Initial reference point is Rp530,000.00
Negative Earnings (in Rp) Initial reference point is
Rp525,000.00
Earnings (E) 541,000.00 Cell 1a: (3,077.94)
Cell 2a:
506,111.11 (7,583.95)
Earnings (E) +Quantitative Description (QD)
Cell 1b:
551,000.00 (5,525.06)
Cell 2b:
496,666.67 (7,859.05) Earnings (E) + Quantitative
Description (QD) +Predicted Earnings (PE)
Cell 1c:
564,000.00 (6,069.77)
Cell 2c:
492,222.22 (7,519.04) Total Means 552,000.00 498,333.29
Table 3. The Average of Investor’s Evaluation (Standard Deviation)
Prospect Effect for Single
Earnings Information
Hypothesis (H
1)
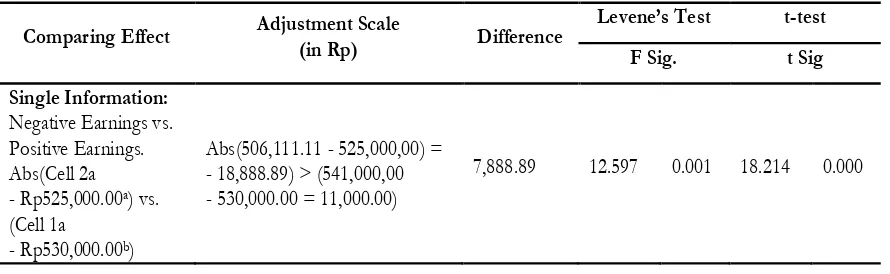
The first hypothesis (H1) tests the pros-pect effect which is the difference in the sub-jects’ reaction towards positive vs. negative earnings information in a single disclosure. The prospect effect is measured by the abso-lute difference between the earnings’ estima-tion reacestima-tion by the negative earnings group (cell 2a) and the reaction of the positive earn-ings group (cell 1a). From Table 4, this study shows that the scale average of the subjects’ estimation of the earnings for a negative earn-ings’ information disclosure is abs(-18,888.89), which is higher than the scale average of the earnings’ estimation for a posi-tive information disclosure, which is abs(11,000.00). The result supports H1.
Prospect Effect Debiased of
Multiple Pieces of Information
Hypothesis (H
2)
The second hypothesis (H2) examines the debiasing prospect effect in a situation with multiple pieces of information. It is hy-pothesized that the additional pieces of in-formation, of a quantitative description and predicted earnings nature, can debias the prospect effect. The research results show the adjustment scale of the subjects’ estimation of the earnings for the positive Earnings (E) plus Quantitative Description (QD) informa-tion group is Rp10,000.00 (Rp551,000.00 – Rp541,000.00), which is a little higher than that of the subjects’ estimations for the nega-tive Earnings (E) plus Quantitanega-tive Descrip-tion (QD) informaDescrip-tion group which has a mean of Rp9,444.44 (Rp496,222.22 -Rp506,111.11).
Table 4. Prospect Effect Hypothesis Testing for Single Information
Notes: aInitial value of earnings for negative earnings group; b Initial value of earnings for positive earnings group. Comparing Effect Adjustment Scale (in Rp) Difference Levene’s Test t-test
F Sig. t Sig
Single Information:
Negative Earnings vs. Positive Earnings. Abs(Cell 2a - Rp525,000.00a) vs.
(Cell 1a - Rp530,000.00b)
Abs(506,111.11 - 525,000,00) = - 18,888.89) > (541,000,00 - 530,000.00 = 11,000.00)
The hypothesis tested the result by us-ing an independent sample t-test, which showed a t-value of 24.402 and p = 0.000 (see Table 5). It means that no prospects ef-fect occurred in the future earnings estima-tion due to the subjects’ adjustment scale in the positive earnings group, which is Rp10,000.00 higher than the subject’s re-sponse in the negative earnings group for a mean of Rp-9,444.44. Thus, additional pieces of information on the characteristics of the earnings’ announcement (quantitative description) may reduce the prospect effect when investors are only given information about positive or negative earnings announce-ments. Therefore, Hypothesis 2 is supported. Table 5 shows the testing results of the debiasing prospect effect for multiple pieces of information in the positive Earnings (E) plus Quantitative Description (QD) plus Pre-dicted Earnings (PE) information group. The results of the adjustment scale of the sub-jects’ earnings estimations for the positive Earnings (E) plus Quantitative Description (QD) plus Predicted Earnings (PE) information group is Rp13,000.00 (Rp564,000.00 -Rp551,000.00), which is higher than the
ad-justment scale of the subjects’ estimations for the negative Earnings (E) plus Quantita-tive Description (QD) plus Predicted Earn-ings (PE) information group which has a mean of minus Rp4,444.45 (Rp492,222.22 – Rp496,222.22). This difference is tested using an independent sample t-test and is sta-tistically significant at 0.001. The result shows that the disclosure of additional pieces of information of a Quantitative Description (QD) plus Predicted Earnings (PE) nature can further debias the prospect effect. Again, Hypothesis 2 is supported.
Discussions
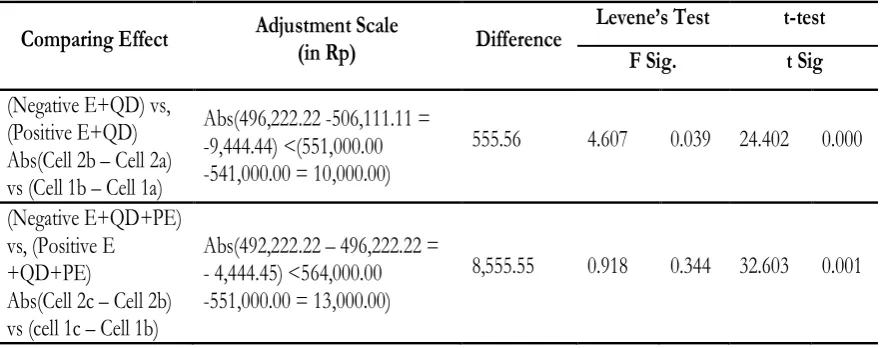
How the additional pieces of quantita-tive description and predicted earnings infor-mation can mitigate the prospect effect bias in earnings announcements can be explained in detail by Figure 2.
The prospect effect occurs when people’s response to negative information is greater than their response to positive infor-mation. In this study, the prospect effect is found for single earnings information. But, when additional information about the
earn-Comparing Effect Adjustment Scale (in Rp) Difference Levene’s Test t-test F Sig. t Sig
(Negative E+QD) vs, (Positive E+QD) Abs(Cell 2b – Cell 2a) vs (Cell 1b – Cell 1a)
Abs(496,222.22 -506,111.11 = -9,444.44) <(551,000.00 -541,000.00 = 10,000.00)
555.56 4.607 0.039 24.402 0.000
(Negative E+QD+PE) vs, (Positive E +QD+PE)
Abs(Cell 2c – Cell 2b) vs (cell 1c – Cell 1b)
Abs(492,222.22 – 496,222.22 = - 4,444.45) <564,000.00 -551,000.00 = 13,000.00)
8,555.55 0.918 0.344 32.603 0.001
ings’ characteristic is added, the prospect ef-fect is mitigated.
Instead of creating a greater response, additional information about the negative Quantitative Description (DE) over earnings information has a lesser response (-Rp9,444.45) than additional information about a positive Quantitative Description (DE) has (Rp10,000.00). The magnitude of the debiasing effect is Rp555.55 (Rp10,000.00 - Rp9,444.45) as seen in Fig-ure 2.
Similarly, additional information about a negative Predicted Earnings (PE) over earn-ings information and quantitative description has a lesser response (-Rp4,444.45) than ad-ditional information of a positive Predicted Earnings (PE) has (Rp13,000.00). The mag-nitude of the debiasing effect is Rp8,555.55 (Rp13,000.00 – Rp4,444.45) as seen in Fig-ure 2. The total debiasing effects is Rp9,111.10 (Rp555.55 + Rp8,555.55).
It can be concluded that the additional pieces of information about the Quantitative Description (QD) and Predicted Earnings (PE) both mitigate the prospect effect in earn-ings announcements with different magni-tudes. The debiased effect occurs because additional information that is integrated with the previous information will make the in-vestors’ belief stronger, and it will decrease the irrational psychological effect. Clear quan-titative description and predicted earnings information, disclosed in the earnings’ an-nouncements, would ensure that investors had sufficient information available to them to compute the adjusted earnings, and that is expected to affect the perception of the in-vestors which would then be reflected in their behavior when they make their business de-cisions.
The debiasing effect of additional in-formation of Quantitative Description (QD) as backward-looking information is smaller than that of additional information of Pre-dictive Earnings (PE) as forward-looking in-formation.
(a) Positive Information (b) Negative Information
Conclusion and Implication
The research results indicate that the prospect effect occurs in the single tion and any additional pieces of informa-tion in earnings announcements (quantitative description and predicted earnings) can miti-gate the prospect effect’s bias. Furthermore, the findings indicate that predicted earnings information can mitigate the bias in the pros-pect effect to a greater degree than quantita-tive description information can in evaluat-ing a company’s future performance. Over-all, this study supports Hypotheses H1and H2. The first hypothesis tests whether inves-tors evaluate a company’s performance more negatively when they evaluate negative earn-ings announcements than they do when they evaluate a positive earnings information dis-closure. Consistent with H1, the scale aver-age of investors’ estimations of earnings for negative earnings information disclosure is higher than the scale average of earnings es-timations for a positive information disclo-sure. This result indicates that the prospect effect occurs in the single information dis-closure.The second hypothesis examines the debiasing of the prospect effect by additional multiple pieces of information. Consistent with H2, the adjustment scale of investors’ evaluations for the positive information group (earnings plus quantitative description) is a little higher than that of investors’ evalua-tions for negative earnings. Further, the test-ing results of the prospect effect’s debiastest-ing for multiple pieces of information show that the adjustment scale of the investors’ evalu-ations for the positive group is higher than the adjustment scale of investors’ evaluations for negative earnings. The result shows that the disclosure of additional pieces of infor-mation (quantitative description plus pre-dicted earnings) can debias the prospect ef-fect. The findings confirmed the prospect theory (Kahneman and Tversky 1979; Barberis 2013). These results for the debiasing of the prospect effect are expected to trigger fresh research into the behavioral aspects of accounting.
The results suggest that predicted earn-ings information can mitigate the prospect effect’s bias to a greater extent than quanti-tative description information is able to
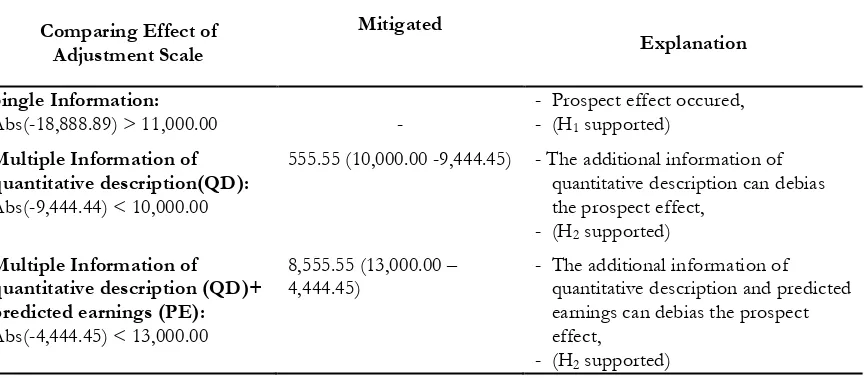
evalu-Comparing Effect of
Adjustment Scale Mitigated Explanation
Single Information:
Abs(-18,888.89) > 11,000.00 - - Prospect effect occured, - (H1 supported)
Multiple Information of quantitative description(QD):
Abs(-9,444.44) < 10,000.00
555.55 (10,000.00 -9,444.45) - The additional information of quantitative description can debias the prospect effect,
- (H2 supported)
Multiple Information of quantitative description (QD)+ predicted earnings (PE):
Abs(-4,444.45) < 13,000.00
8,555.55 (13,000.00 –
4,444.45) - The additional information of quantitative description and predicted earnings can debias the prospect effect,
- (H2 supported)
ate a company’s future performance. Prior research, such as the study by Baginski et al. (2004) documents that managers often ex-plain their earnings forecasts by linking the forecasted performance to their internal ac-tions and the acac-tions of parties external to the firm. These explanations (or attributions) are potentially important information for in-vestors who engage in strategic analysis of the information in financial statements. Stra-tegic financial analysis involves understand-ing both a company’s internal strategies and competencies, and its external competitive and regulatory environment, to generate prof-itability forecasts (Palepu et al. 2000). If the attributions are credible, they can enhance the usefulness of the accompanying earnings forecasts by either providing additional infor-mation on known links between factors and profitability, or by identifying additional fac-tors to consider in forecasting profits.
This study has important practical im-plication for firms. Usually, companies are afraid to announce negative information, es-pecially negative earnings information. The reason is because investors will react more irrationally to negative than to positive
earn-ings information (the prospect effect’s bias). This will disadvantage the companies by de-creasing their stock prices. To mitigate this bias, firms can use additional pieces of in-formation. Forward-looking oriented infor-mation, such as predictive earnings informa-tion, will better mitigate the prospect effect’s bias than backward-looking oriented informa-tion such as quantitative descripinforma-tion infomation.
The limitations of this study are because it used only a small number of participants. This limitation was caused by the difficulty in finding real investors with time to partici-pate in the experiment. The recruitment of the participants was done through coopera-tion with the stock exchanges, educacoopera-tional institutions, and various relationships.
There are some improvements that can be made by future studies, one being to in-crease the sample size of the participants. Future research can also use web-based ex-periments using internet technology. Web-based experimentation can allow for partici-pants from various groups with a wide geo-graphical distribution.
Reregences
Ajinkya, B., and M. Gift. 1984. Corporate Managers, earnings forecasts and symmetrical adjustment of market expectations. Journal of Accounting Research 22 (2): 425-444.
Baginski, J., M. Hassell, and M. D. Kimbrough. 2004. Why do managers explain their earnings forecasts?
Journal of Accounting Research 42 (1 March): 1-29.
Barberis, N. C. 2013. Thirty years of prospect theory in economics: A review and assessment. Journal of Economic Perspectives 27: 173-196.
Bazerman. 1994. Judgment in Managerial Decision Making. Willey & Sons. Inc.
Boldt, M. N. 2001. The effects of functional fixation on relative performance evaluations. Academy of Strategic and Organizational Leadership Journal 5 (1): 17-30.
Boles, T. L., and D. M. Messick. 1995. A reverse outcome bias: The influence of multiple reference points on the evaluation of outcomes and decisions. Organizational Behavior and Human Decision Processes 61 (3): 262-275.
Cooper, D. R., and P. S. Schindler. 2006. Business Research Methods. Singapore, McGraw-Hill/Irwin. Easton, P., and M. Zmijewski. 1989. Cross-sectional variation in the stock market response to accounting
earnings announcements. Journal of Accounting and Economics. 11: 117-141.
Feltham, G. A., and J. A. Ohlson. 1995. Valuation and clean surplus accounting for operating and financial activities. Contemporary Accounting Research 11 (2): 689-731.
Fiegenbaum, A., and Thomas, H. 1988. Attitudes towards risk and the risk-return paradox: Prospect theory explanations. Academy of Management Journal 31: 85-106.
Fiegenbaum, A., and Thomas, H. 1990. Prospect theory and the risk-return association: An empirical examination of 85 industries. Journal of Economic Behavior and Organization 14:187-203.
Foster, G. 1977. Quarterly accounting data: Time-series properties and predictive-ability results. The Ac-counting Review. 52: 1-21.
Freeka, T. J., and C. F. Lee. 1983. Generalized financial ratio adjustment processes and their implication.
Journal of Accounting Research 21: 308-316.
Freeman, R. and S. Tse. 1992. A nonlinear model of security price responses to unexpected earnings.
Journal of Accounting Research. 30: 185-209.
Han. J., and J. Wild. 1987. Incremental information in the components of managements’ forecasts. Work-ing Paper (March). Michigan State University.
Han. J., and H. Tan. 2007. Investors’ Reactions to Management Guidance Forms: The Influence of Multiple Benchmarks. The Accounting Review 82 (2): 521-543.
Harsha, P. D., and M. C. Knapp. 1990. The use of within-and between-subjects experimental designs in behavioral accounting research: A methodological note. Behavioral Research in Accounting 2: 50-62. Hartono, J. 2004. How, Why and When Investors Revise Their Beliefs to Company Information and Their Implications
to Firms Announcement Policy. ANDI Yogyakarta.
Hartono, J., and S. Wahyuni. 2014. Implementation of multiple reference points theory in management guidance information disclosure. Working Paper. Universitas Gadjah Mada.
Hirst, D. E., K. E. Jackson, and L. Koonce. 2003. Improving financial reports by revealing the accuracy of prior estimates. Contemporary Accounting Research 20 (1): 165-193.
Jegers, M. 1991. Prospect theory and the risk-return relation: Some Belgian evidence. Academy of Manage-ment Journal 34: 215-225.
Kahneman, D., and A. Tversky. 1979. Prospect theory: An analysis of decision under risk. Econometrica 47 (2 March): 263-291.
King, R., G. Pownall, and G. Waymire. 1990. Expectations adjustments via timely management forecasts: Review, synthesis, and suggestions for future research. Journal of Accounting Literature 9: 113-144. Klinger, D., and Tsur, I. 2011. Prospect theory and risk-seeking behavior by troubled firms. The Journal of
Kormendi, R. and R. Lipe. 1987. Earnings innovations, earnings persistence, and stock return. Journal of Business. 60: 323-345.
Krische, S. D. 2005. Investors’evaluations of strategic prior-period benchmark disclosure in earnings announcements. The Accounting review 80 (1): 243-268.
Lakonishok, J., and S. Seymour. 1989. Past price changes and current trading volume. Journal of Portfolio Management, 15: 18-24.
Lee, C. M. C. 1999. Accountings-based valuation: Impact on business practices and research. Accounting Horizons 13 (4): 413-425.
Lehner, J. M. 2000. Shifts of reference points for framing of strategic decisions and changing risk-return associations. Management Science 46: 63-76.
Lev, B. 1969. Industry averages as targets for financial ratios. Journal of Accounting Research 7: 290-299. Libby, R., R. J. Bloomfield, and M. W. Nelson. 2002. Experimental research in financial accounting.
Accounting, Organizations and Society 27 (8): 775-810.
Libby, R., H. T. Tan, and J. E. Hunton. 2006. Does the form of managements’ earnings guidance affect analysts’ earnings forecasts? The Accounting Review 81 (1): 251-270.
Maines, L. A., and L. S. McDaniel. 2000. Effect of comprehensive-income characteristics on nonprofes-sional investors’judgments: The role of financial-statement presentation format. The Accounting Re-view 75 (2): 179-207.
Odean, T. 1998. Are investors reluctant to realize their loss? Journal of Finance 53: 1775-1798.
Ohlson, J. A. 1995. Earnings, book values, and dividends in security valuation. Contemporary Accounting Research 11 (2): 661-687.
Palepu, K., P. Healy, and V. Bernard. 2000. Business Analysis and Valuation. Secon Edition, Mason, OH: South-Western College Publishing.
Pattel, J. 1976. Corporate forecasts of earnings per share and stock price behavior: Empirical tests. Journal of Accounting Research (Autumn): 246-276.
Penman, S. 1980. An empirical investigation of the voluntary disclosure of corporate earnings forecasts.
Journal of Accounting Research (Spring): 132-160.
Pownall, G., and G. Waymire. 1989. Voluntary Disclosure Credibility and Securities Prices: Evidence from management earnings forecasts, 1969-73. Journal of Accounting Research 27 (2 Autumn): 227-245. Pownall, G., C. Wasley, and G. Waymire. 1993. The stock price effects of alternative types of
manage-ment earnings forecasts. The Accounting Review 68 (October): 896-912.
Schrand, C. M., and B. R. Walther. 2000. Strategic Benchmarks in Earnings Announcements: The Selective Disclosure of Prior-Period Earnings Components.The Accounting Review 75 (2): 151-177.
Sinha, T. 1994. Prospect theory and risk return association: Another look. Journal of Economic Behavior and Organization 24: 225-231.
Stracca, L. 2002. Behavioral finance and aggregate market behavior: Where do we stand? Working Paper. European Central Bank.
Wahyuni, S., and J. Hartono. 2010. Strategic disclosure of multiple benchmarks in earnings announce-ments: An examination of investor behavior based on internal and external factors in the perfor-mance evaluation. The Indonesian Journal of Accounting Research 13(Mei): 149-166.
Wahyuni, S., and J. Hartono. 2012. Reminder effect and anchoring-adjustment in earnings announcement. Implementation of prior-period benchmark disclosure strategy. Journal of Indonesian Economy & Business 27 (September): 390-405.
Waymire, G. 1984. Additional evidence on the information content of management earnings forecast.