Dynamics of prokaryotic community in Boka Kotorska Bay
(South-eastern Adriatic Sea)
Aleksandra REDŽIĆ
1, Nada KRSTULOVIĆ
2, Mladen ŠOLIĆ
2, Danijela ŠANTIĆ
2and Marin ORDULJ
3*1Institute for Marine Biology, Dobrota bb, P.o.box 69, 85330 Kotor, Montenegro 2Institute of Oceanography and Fisheries, Šetalište Ivana Meštrovića 63, 21 000 Split, Croatia
3University of Split, University Department of Marine Studies, Livanjska 5/III, 21 000 Split, Croatia
*Corresponding author e-mail: krstulovic@izor.hr
Key words: heterotrophic bacteria, HNA, LNA, bacterial production, heterotrophic nanoflagellates, Boka Kotorska Bay
The dynamics of the prokaryotic picoplankton community were studied at six stations of three embayments in Boka Kotorska Bay from January 2010 to January 2011. The abundance of non-pig-mented bacteria, high nucleic acid content (HNA) bacteria, low nucleic acid content (LNA) bacteria, bacterial production and heterotrophic nanoflagellates was determined, as well as the chlorophyll a, physical and chemical factors of the water column. It seems that freshwater input has the ability to control bacterial abundance as well as the proportion of HNA cells in bacterial community and thus the abundance of HNF cells. During the warmer seasons, in the investigated area, which is mainly oligotrophic, we found an increase in values and domination of the LNA group in the bacte-rial population. The dominance of the HNA group was found only during the colder seasons. Weak coupling between bacteria and HNF suggests that predation (top down control) is not dominant in controling of bacterial abundance in studied area.
INTRODUCTION
Picoplankton is the dominant component of the planktonic food webs in a large number of marine ecosystems (CHRISTAKI et al., 2001). Non-pigmented bacteria are generally the most abundant component of the 0.2–2 μm size frac -tion and a major pathway in the flux of material and energy in pelagic marine ecosystems (AZAM & CHO, 1987; GASOL et al., 1997).
The introduction of flow cytometry into the
analysis of prokaryotic community (LI et al., 1995; MARIE et al., 1997) enables discovery of bacterial groups based on different contents of DNA and different amounts of fluorescence: a high nucleic acid content group with a high amount of fluo-rescence (HNA) and a group with low nucleic acid and low amount of fluorescence (LNA) content (GASOL & MORÁN, 1999; GASOL et al., 1999). The general conclusion from the literature is that HNA bacteria are larger and more active on a cell basis than LNA bacteria, but the
contri-bution of LNA cells to total bacterial production is still a subject of much debate (LONGNECKER
et al., 2005; MORÁN et al., 2010). Among bacterial predators, heterotrophic nanoflagellates (HNF) have been identified as a major source of bacte-rial mortality in aquatic ecosystems (CHRISTAKI
et al., 2001; ŠOLIĆ & KRSTULOVIĆ, 1994), but preda-tion pressure was found to be dependent on the trophic state of the studied area (KRSTULOVIĆ et al., 1997; ŠOLIĆ et al., 1998, 2001).
The aim of the present study was to describe the seasonal cycles and areal distributions of total bacterial abundances and HNA and LNA bacterial groups. Furthermore, it aimed to indi -cate the role of HNA and LNA bacteria in bacte-rial activity and to identify the role of hetero-trophic nanoflagellates in controlling the bacte-rial population in the area of Boka Kotorska Bay (southern Adriatic Sea, Montenegro). The accu -rate determination of picoplankton abundance, its activity and relationship with HNF is thus essential for understanding the functioning of aquatic ecosystems such as a semi-enclosed bay.
MATERIAL AND METHODS
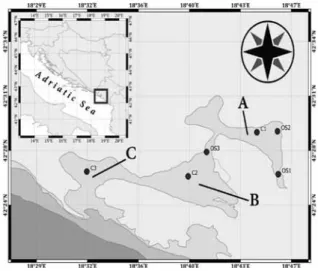
Study areaBoka Kotorska Bay is a relatively large (87 km2) semi-enclosed karstic bay situated in the south-east part of the Adriatic Sea. It is formed by three embayments where freshwater input can strongly modify temperature, salinity and current patterns. Karst is present elsewhere, particularly in Kotor Bay, where subaerial and submarine springs, among them Sopot and Ljuta, can reach peak discharges as large as 200 m3/s in a very short time. Slow circulation of seawater is another very important characteristic of this area (RADULOVIĆ, 2006) with surface out-flow circulation and bottom inout-flow. According to hydrodynamic processes in Boka Kotorska Bay, BELLAFIORE et al. (2011) classified Kotor Bay differently from the outermost area, Tivat and Herceg Novi Bay. This generally indicates a slow rate of water exchange between Kotor Bay and the open sea reaching a residence time (RT) of around 70 days during the period of minimum
freshwater discharge. The other interesting char -acteristic is the anticyclone circulation in the central bay – Tivat Bay (BELLAFIORE et al., 2011) – which has RT values of 25 days at the surface and 15 days in the deep layers. Some areas near to the open sea maintain RT values of 5 days at the surface and lower values in the deep layers (BELLAFIORE et al., 2011). From the along-channel section in the Verige Strait the presence of a sill controls the bottom water exchange between Kotor Bay and Tivat Bay.
Sampling
Sampling was carried out monthly from January 2010 to January 2011. Niskin bottles (5 L) were used for sampling between the sur -face and the near bottom layer at six stations in three embayments: Kotor Bay (A), Tivat Bay (B) and Herceg Novi Bay (C) (Fig. 1). Samples were collected from a small ship at six depths: at the surface, 2 m, 5 m, 10 m, 20 m and 30 m for coastal stations and at the surface, 5 m, 10 m, 20 m, 30 m and 40 m depths at central bay stations. For bacterial production, samples were taken seasonally at the innermost part of Boka Kotorska Bay (OS1) and at central bay stations (C1, C2, C3).
Temperature and salinity were recorded
Fig. 1. Study area with sampling stations in the Bay of Kotor (Embayment A) the Bay of Tivat (embayment B) and the Bay of Herceg Novi (embayment C)
in situ with a universal meter (Multiline P4; WTW). Chl a was determined as absorbance with a Parkin/Elmer UV/VIS spectrophotometer and calculated according to JEFFREY et al. (1997).
Flow cytometry
Abundances of non-pigmented bacteria were determined using flow cytometry (MARIE et al., 1997). For flow cytometry counts of bac -teria samples were preserved in 2% formalde-hyde and stored at 4 ºC until analysis. Samples of 1 ml were stained with SybrGreen I and without replicas were analysed on a Beckman Coulter EPICS XL-MCL with a high flow rate of between 1 and 1.2 µL sec-1, and the analysed volume was calculated by acquisition time. To standardize the fluorescence intensity of the cells, 1.0 µm yellow-green beads were added (Level-III Epics Division of Coulter Corpora -tion Hialeah, Florida). Two groups of bacteria were distinguished according to their relative green fluorescence as a proxy for the nucleic acid content (JOCHEM, 2001), referred to as high nucleic acid (HNA) and low nucleic acid (LNA) bacteria and light scattering.
Bacterial cell production was measured from DNA synthesis based on incorporation rates of 3H-thymidine (FUHRMAN & AZAM, 1982). Con-version factors (CF) for bacterial production were calculated from bacterial cell numbers and 3H-thymidine incorporation during bacte-rial growth in 1-µm pre-filtered seawater (RIE -MANN et al., 1987): CF=(N2-N1)/ 3H where N1 andN2 are the numbers of bacteria at the begin-ning and the end of the experiment, and 3H is the integrated 3H-thymidine incorporation rate during the experiment.
Samples for heterotrophic nanoflagellate (HNF) cell counts were preserved with formal -dehyde that was filtered in 0.2 μm polycarbonate membranes to a 2% final concentration. In the laboratory samples were stained with 4′-6-dia -midino-2-phenylindole (DAPI) for 10 min and filtered through polycarbonate filters with 0.8 µm pore diameters (Millipore, Ireland). The number of HNF was estimated using epifluo-rescence microscopy. Microscope slides were
examined with an Olympus microscope under UV light at a magnification of 1,000 X (PORTER & FEIG, 1980).
Methods for determination of regulation mechanisms of non-pigmented bacteria
To examine the regulation of bacteria by predation, data were analysed using an empirical model (GASOL, 1994). The simultaneous observa-tions of the abundance of bacteria and hetero-trophic nanoflagellates (HNF) are plotted on a log-log graph, which provides information about coupling between bacterial and HNF abundance. The graph includes an empirically determined maximum attainable abundance (MAA) line and a mean realized abundance (MRA) according to the framework proposed by GASOL (1994). The points close to the MAA line indicate strong coupling between the bacteria and HNF, which, according to GASOL (1994), could be interpreted as strong predation on bacteria. The point that lies well below the MRA line indicates condi-tions when bacterial abundance was not con-trolled by HNF grazing. Therefore, D values (distances between the maximum and realized HNF abundances at different bacterial concen-trations) represent a good indicator of the impor -tance of HNF predators in controlling bacterial abundance. Low D values mean strong coupling between the abundance of bacteria and HNF, while high D values mean no or low coupling between bacteria and HNF.
Differences in each dependent variable of the data set were established using the analysis of variance (ANOVA) technique and consid -ered for factor F1 – embayments (A versus B versus C). All variables were logarithmically transformed to comply with the assumptions of ANOVA. The relationship between abiotic and biotic factors and the abundance of heterotroph-ic prokaryotes were determined using Pearson’s rank correlation index.
Principal component analysis (PCA) was applied to the multivariate chemical, physical and biological data set. This multivariate analy -sis rotates a cloud of data points such that the maximum variability is visible to identify the
most important gradient over the study period. Varimax rotation was applied to optimize the interpretation of the PCA results. Analyses were performed with STATISTICA software.
RESULTS AND DISCUSSION
During the investigation period the water temperature showed a regular seasonal fluctua-tion without marked differences among stafluctua-tions and embayments, ranging at the surface from 12.3 ± 1.5 in winter to 24.8 ± 2.6 in summer. The thermal stratification of the water column began in June and lasted until September when the isothermal period began. The exception was the coastal station OS1 where thermal stratification lasted until October due to the influence of the river Škurda. A strong vertical salinity gradient with a flow of fresh water at the surface is seen in the inner part of the bay, particularly for the station OS2 where the salinity varied from 0.6 to 36.4 at the surface. The lowest values and widest ranges of temperature and salinity in Kotor Bay were recorded mostly due to the influence of the river Škurda and the streams Ljuta and Sopot. Applying PCA analysis to the temperature and salinity in Kotor Bay we have separated the sur-face and subsursur-face layer (Table 1). Changes intemperature and salinity in the surface layer are connected (r=0.60, p< 0.001), suggesting a sig -nificant effect of freshwater inflow. According to the salinity, Tivat Bay is also characterized by two layers, but the surface layer is deeper than in Kotor Bay, reaching up to 10 m in depth (Table 2). Herceg Novi Bay, according to salinity, has three layers: the surface, subsurface and bottom layer at 40 m depth (Table 3).
In previous studies changes in physical, chemical and biological parameters were mainly dependent on natural factors such as the pat-tern of rainfall, and according to the Chl a and nutrient concentration it can be described as oligo-mesotrophic (KRIVOKAPIĆ et al., 2011). The obtained values of chlorophyll a in this study were in a range from 0.07 to 3.51 chl a mg/m3 with a mean value of 0.93 ± 0.45 mg chl a/m3, which describes the investigated area accord-ing to KRSTULOVIĆ et al. (1998) as a “moderate” chlorophyll area.
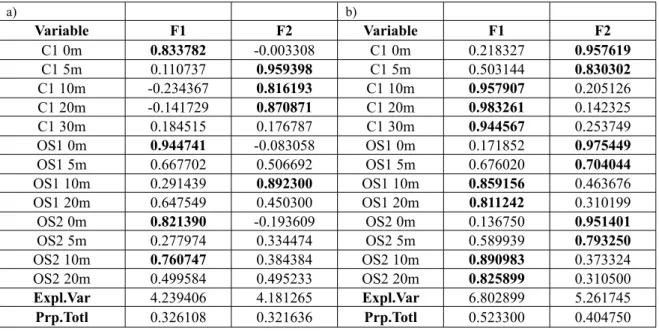
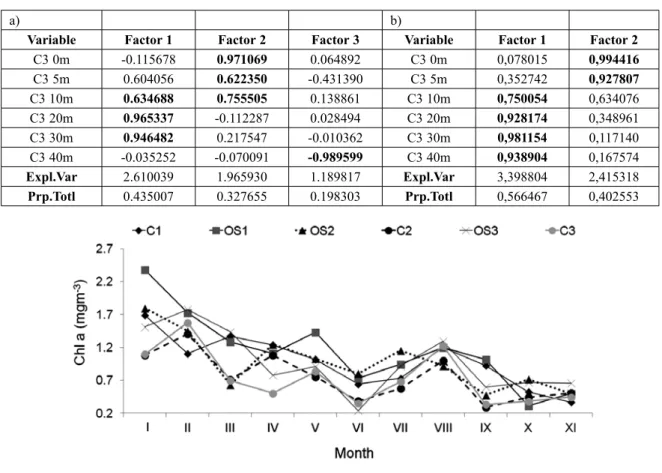
Decreasing values of chlorophyll a were determined from January to May with minimum values in June, with the highest average concen-tration at coastal station OS1 of 2.38 mg/m3 of chlorophyll a (Fig. 2). a) b) Variable F1 F2 Variable F1 F2 C1 0m 0.833782 -0.003308 C1 0m 0.218327 0.957619 C1 5m 0.110737 0.959398 C1 5m 0.503144 0.830302 C1 10m -0.234367 0.816193 C1 10m 0.957907 0.205126 C1 20m -0.141729 0.870871 C1 20m 0.983261 0.142325 C1 30m 0.184515 0.176787 C1 30m 0.944567 0.253749 OS1 0m 0.944741 -0.083058 OS1 0m 0.171852 0.975449 OS1 5m 0.667702 0.506692 OS1 5m 0.676020 0.704044 OS1 10m 0.291439 0.892300 OS1 10m 0.859156 0.463676 OS1 20m 0.647549 0.450300 OS1 20m 0.811242 0.310199 OS2 0m 0.821390 -0.193609 OS2 0m 0.136750 0.951401 OS2 5m 0.277974 0.334474 OS2 5m 0.589939 0.793250 OS2 10m 0.760747 0.384384 OS2 10m 0.890983 0.373324 OS2 20m 0.499584 0.495233 OS2 20m 0.825899 0.310500 Expl.Var 4.239406 4.181265 Expl.Var 6.802899 5.261745 Prp.Totl 0.326108 0.321636 Prp.Totl 0.523300 0.404750
Table 1. Results of principal component analysis applied to the salinity (a) and temperature (b) at different stations and different depths in the Bay of Kotor. Varimax rotation was applied to optimize the interpretation of the results. Factor F1 describes the surface layer and factor F2 describes the subsurface layer
a) b)
Variable Factor 1 Factor 2 Variable Factor 1 Factor 2
OS3 0m 0,868628 -0,249661 OS3 0m 0,186179 0,975901 OS3 5m 0,863220 0,198300 OS3 5m 0,500050 0,834327 OS3 10m 0,618106 0,372749 OS3 10m 0,807056 0,583801 OS3 20m 0,212894 0,754548 OS3 20m 0,960338 0,241344 OS3 30m -0,269041 0,598880 OS3 30m 0,968796 0,213546 C2 0m 0,930439 -0,066441 C2 0m 0,144042 0,977825 C2 5m 0,909603 0,083886 C2 5m 0,718328 0,624540 C2 10m 0,934700 -0,013916 C2 10m 0,904543 0,392634 C2 20m 0,235048 0,751383 C2 20m 0,963811 0,226473 C2 30m -0,243161 0,851055 C2 30m 0,975755 0,149904 Expl.Var 4,680557 2,469109 Expl.Var 6,032837 3,667271 Prp.Totl 0,468056 0,246911 Prp.Totl 0,603284 0,366727
Table 2. Results of principal component analysis applied to the salinity (a) and temperature (b) at different stations and different depths in the Bay of Tivat. Varimax rotation was applied to optimize the interpretation of the results. Factor F1 for salinity describes the surface layer and factor F2 describes the subsurface layer. For temperature, factor F1 describes the subsurface layer and factor F2 describes the surface layer
a) b)
Variable Factor 1 Factor 2 Factor 3 Variable Factor 1 Factor 2
C3 0m -0.115678 0.971069 0.064892 C3 0m 0,078015 0,994416 C3 5m 0.604056 0.622350 -0.431390 C3 5m 0,352742 0,927807 C3 10m 0.634688 0.755505 0.138861 C3 10m 0,750054 0,634076 C3 20m 0.965337 -0.112287 0.028494 C3 20m 0,928174 0,348961 C3 30m 0.946482 0.217547 -0.010362 C3 30m 0,981154 0,117140 C3 40m -0.035252 -0.070091 -0.989599 C3 40m 0,938904 0,167574 Expl.Var 2.610039 1.965930 1.189817 Expl.Var 3,398804 2,415318 Prp.Totl 0.435007 0.327655 0.198303 Prp.Totl 0,566467 0,402553
Table 3. Results of principal component analysis applied to the salinity a) and temperature b) ) at different depths in the Bay of Herceg Novi. Varimax rotation was applied to optimize the interpretation of the results. For salinity, factor F1 describes the subsurface layer, factor F2 describes the surface layer and factor F3 describes the bottom layer. For temperature, factor F1 describes the subsurface layer and factor F2 describes the surface layer
Abundance of non-pigmented bacteria and percentage of HNA and LNA bacteria in
non-pigmented bacteria community The average monthly abundance of non-pigmented bacteria, obtained as the average value from the surface to the bottom layers, ranged from 0.5 x 10⁵ to 1.99 x 10⁶ cells mL-1 (mean value = 0.62 ± 0.32 x 10⁶ cells mL-1). The seasonal distribution of non-pigmented bacteria in all the investigated stations has shown an increased abundance during warmer seasons with maximum abundance in August and lower abundance during the colder seasons, which confirms previous reports for coastal areas on the central and southern Adriatic Sea (ŠANTIĆ et al., 2013; ŠOLIĆ et al., 2001) (Fig. 3).
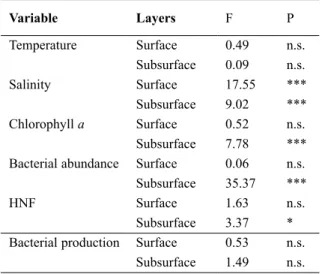
The outcome of the ANOVA carried out for testing the null hypothesis of equality among embayments for all physical and biological parameters is reported in Table 4. Differences among embayments were observed for all the considered variables except temperature and bacterial production.
The relationships among embayments in terms of bacterial abundance are analysed using PCA analysis. Only principal factors (PF) with eigenvalues > 1 are considered. In terms of bacterial abundance, PCA analysis shows a three-layer structure in the Bay of Kotor – sub -surface, surface and bottom layer described by factors F1, F2 and F3 (31%, 22% and 25%, respectively) (Table 5). The surface layer by
bacterial abundance coincides with the surface layer by salinity. The subsurface layer spreads from 5 m to 10 m and the bottom layer lies at 20 m for coastal stations and from 20 m to 30 m for the deeper central bay station. According to current patterns (BELLAFIORE et al., 2011), there is a three-layer structure in Tivat Bay that does not maintain estuarine flow but registers an inflow in the bay, both from the surface and the bottom layers. According to PCA analysis of bacte -rial abundance, the water column is stratified into two layers (F1 = 47% and F2 = 34%). The surface layer for station OS3 extends to 10 m, which is coincident with salinity of surface layer (Table 6) due to the strong influence of surface
Variable Layers F P Temperature Surface 0.49 n.s. Subsurface 0.09 n.s. Salinity Surface 17.55 *** Subsurface 9.02 *** Chlorophyll a Surface 0.52 n.s. Subsurface 7.78 *** Bacterial abundance Surface 0.06 n.s. Subsurface 35.37 ***
HNF Surface 1.63 n.s.
Subsurface 3.37 * Bacterial production Surface 0.53 n.s.
Subsurface 1.49 n.s.
Table 4. Results of the ANOVA (F-test and P) on surface and subsurface values of chemical, physical and bio-logical parameters among embayments
Fig. 3. Seasonal fluctuation of bacterial abundance (BA) the Bay of Kotor (A), the Bay of Tivat (B) and the Bay of Herceg Novi (C). Average values (line) and positive standard error (bars) are presented
outflow circulation through the Verige Channel. In Herceg Novi Bay there is a two-layer struc -ture (Table 7). Factor F1 describes the surface and bottom layer (38%) and factor F2 describes the subsurface layer (51%).
Besides total bacterial abundance, the per-centage of HNA bacteria also increased along the oligotrophic-mesotrophic gradient (Fig. 4A, C), and different temporal patterns were found for HNA and therefore for LNA bacte-rial groups. Seasonal distribution showed the
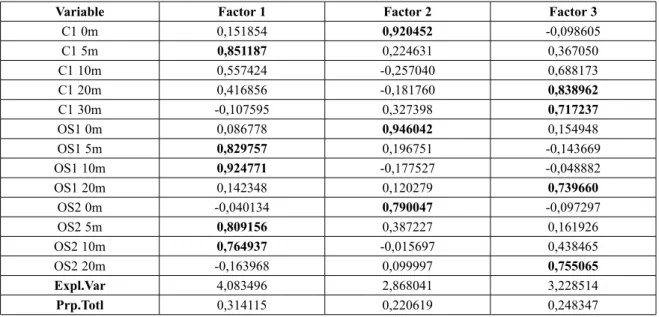
Variable Factor 1 Factor 2 Factor 3
C1 0m 0,151854 0,920452 -0,098605 C1 5m 0,851187 0,224631 0,367050 C1 10m 0,557424 -0,257040 0,688173 C1 20m 0,416856 -0,181760 0,838962 C1 30m -0,107595 0,327398 0,717237 OS1 0m 0,086778 0,946042 0,154948 OS1 5m 0,829757 0,196751 -0,143669 OS1 10m 0,924771 -0,177527 -0,048882 OS1 20m 0,142348 0,120279 0,739660 OS2 0m -0,040134 0,790047 -0,097297 OS2 5m 0,809156 0,387227 0,161926 OS2 10m 0,764937 -0,015697 0,438465 OS2 20m -0,163968 0,099997 0,755065 Expl.Var 4,083496 2,868041 3,228514 Prp.Totl 0,314115 0,220619 0,248347
Table 5. Results of principal component analysis applied to the bacterial abundance in the Bay of Kotor. Varimax rotation was applied to optimize the interpretation of the results. F1 describes the subsurface layer, factor F2 describes the surface layer and factor F3 describes the bottom layer.
Variable Factor 1 Factor 2
OS3 0m 0,976320 -0,096647 OS3 5m 0,903926 0,069171 OS3 10m 0,771852 0,496431 OS3 20m 0,592973 0,522679 OS3 30m3 0,593019 0,739373 C2 0m 0,748918 -0,414977 C2 5m 0,844495 0,300913 C2 10m -0,065189 0,938361 C2 20m -0,466491 0,756477 C2 30m 0,347073 0,786364 Expl.Var 4,685702 3,414337 Prp.Totl 0,468570 0,341434
Variable Factor 1 Factor 2
C3 0m 0,137270 0,936822 C3 5m 0,817917 0,535234 C3 10m 0,945698 0,101586 C3 20m 0,965092 -0,185316 C3 30m 0,719654 0,379606 C3 40m -0,010412 0,965183 Expl.Var 3,031590 2,284451 Prp.Totl 0,505265 0,380742
Table 6. Results of principal component analysis applied to the bacterial abundance in the Bay of Tivat. Varimax rotation was applied to optimize the interpretation of the results. F1 describes the surface layer and F2 describes the subsurface layer
Table 7. Results of principal component analysis applied to the bacterial abundance in the Bay of Herceg Novi. Varimax rotation was applied to optimize the interpre-tation of the results. F1 describes the subsurface layer and F2 describes the surface and bottom layers
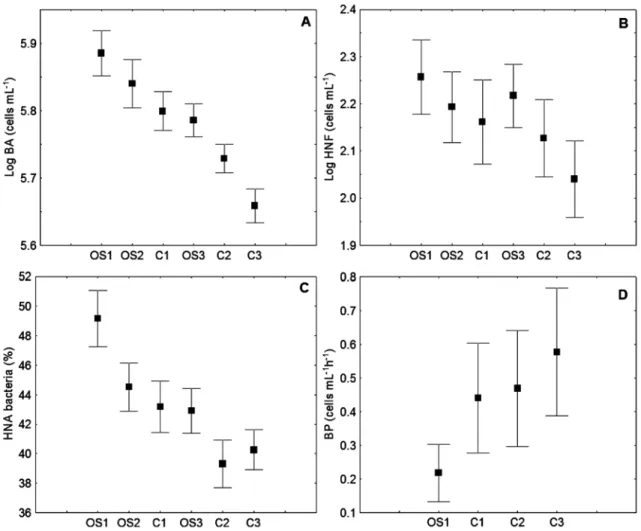
prevalence of the HNA group only during the first three months of 2010 and the prevalence of LNA bacteria, or almost equal proportions of the LNA and HNA groups in the bacterial community, during the rest of the investigated time (Fig. 5). Comparing all the stations with the annual average, variations in the proportion of HNA bacteria were the most pronounced at coastal station OS1 – Kotor Bay, which is under the strongest influence of the river Škurda. For other stations the annual average showed a per-centage of HNA bacteria of less than 50% (Fig. 4C). Thus, our findings are consistent with other research that found predominance of the LNA
Fig. 4. Mean values (± SE) of bacterial abundance (BA) (A),) heterotrophic nanoflagellate (HNF) (B abundance, percent-age of high nucleic acid (HNA) bacteria(C), and bacterial production (BP) (D) at different sampling stations for the period 2010–2011
group over HNA for other oligotrophic areas such as the Celtic Sea, Gulf of Mexico and open Adriatic Sea (JOCHEM et al., 2004.; ŠANTIĆ et al., 2013; ZUBKOV et al., 2001.), as well as dominance of the HNA group during the colder seasons (CALVO-DÍAZ & MORÁN, 2006; ŠANTIĆ et al., 2012)
Fig. 5. Seasonal fluctuation of HNA bacteria in the Bay of Kotor (A), the Bay of Tivat (B) and the Bay of Herceg Novi (C)
Although the proportion of HNA bacteria, regarded as the indicator of the activity struc-ture of the bacterial community (LEBARON et al., 2001; SERVAIS et al., 1999), was highest in most inner parts of the bay in station OS1 – Kotor Bay, the highest bacterial production was found in embayments directly connected to the open sea (Fig. 4C–D). The average monthly values of bacterial production in Boka Kotorska Bay ranged from 0.05 x 10⁴ to 1.93 x 10⁴ cells mL-1 h -1 with the maximum at the bottom in Herceg Novi Bay (3.85 x 10⁴ cells mL-1 h -1). Seasonal distribution shows increased bacterial productiv-ity during the autumn and for Herceg Novi Bay during the spring and autumn (Fig. 6), which is consistent with data obtained for the central and southern Adriatic Sea (ŠANTIĆ et al., 2013).
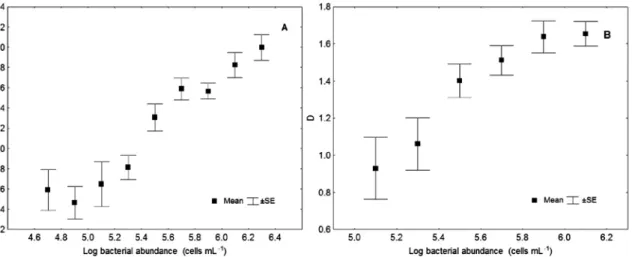
Bottom-up and top-down control of bacteria The relationship of HNF as the most important bacterial predators with bacteria we described by distance points (D) obtained by the GASOL (1994) model. Thus lower D values show higher predation pressure on the bacte-rial population. All pooled data showed that the average value of D increased with increasing bacterial abundance (Fig. 7A–B).. That uncou -pling between bacteria and HNF suggests the existence of strong grazing pressure on HNF by
Fig. 6. Seasonal fluctuation of bacterial production (BP). Average values (column, line with markers) and posi-tive standard error (bars) are presented
Fig. 7. Relationship between D values (the difference between the maximum and realized heterotrophic nanoflagellate (HNF) abundance at each bacterial concentration) and bacterial abundance (log values grouped in equidistant dis-crete categories) the Bay of Kotor(A), the Bay of Tivat(B) and the Bay of Herceg Novi
Fig. 8. Relationship between bacterial and het-erotrophic nanoflagellate (HNF) abundance at studied embayments, plotted in theoreti-cal model (Gasol, 1994). MAA: maximum attainable abundance, MRA: mean realized abundance for the Bay of Kotor (A), the Bay of Tivat (B) and the Bay of Herceg Novi (C)
ciliates. Similar results were found for the mid -dle Adriatic Sea (ŠOLIĆ et al., 2009). Looking at Fig. 8 (A–C), we can find points that fall close to and below the MRA line for all the studied embayments. Previous research of oligotrophic ecosystems in the Adriatic Sea showed that bac-terial abundance is mostly controlled by the sup-ply of nutrients (ŠANTIĆ et al., 2013). It seems that
freshwater input has the ability to control bacte-rial abundance as well as the proportion of HNA cells in the bacterial community and thus the abundance of HNF cells. In terms of the organic matter in Boka Kotorska Bay (DAUTOVIĆ et al., 2012), freshwater inputs that are relatively poor in dissolved organic carbon have the ability to purify the system. Due to the high reactivity of the organic matter present in the area DAUTOVIĆ
et al. (2012) suggest that organic matter could be removed from the water column fast enough to prevent major organic matter accumulation.
Based on the results obtained for bacterial abundance and mean D values, it seems that the studied area could be considered as oligotrophic with domination of BU control.
Influencing factors on bacteria In the investigated area, we found statisti -cally significant correlations between bacterial abundance and temperature (r= 0.43, p < 0.001). Also, we conclude that temperature and salinity were important factors in controlling bacterial abundance, and that temperature and the fresh-water substrate supply acted synergistically, or the substrate supply itself was a highly temper-ature-dependent seasonal phenomenon. During the investigated period, a positive correlation between bacterial abundance and concentration of chlorophyll a was determined for warmer
sea-sons (r=0.47, p<0.01), which implied that phy -toplankton-derived substrates supply also has an impact in controlling bacterial abundance. This is in accordance with the previous research for the Adriatic Sea (KRSTULOVIĆ et al., 1997; ŠANTIĆ
et al., 2013; ŠESTANOVIĆ et al., 2004). Comparing all the data for the surface layers (0 m – 5 m), where the temperature and salinity fluctuation was the highest, we found a significant relationship between LNA cell abundance and temperature and salinity (r = 0.58, r = 0.55 respectively for p< 0.001). We also found a weak but significant correlation between bacterial production and the abundance of HNA cells (r= 0.23, p <0.05).
CONCLUSIONS
According to data obtained for bacterial density with a mean value of 0.62 ± 0.22 x 10⁶
cells mL-1, which is consistent with data already published for the Adriatic and Mediterranean Sea, we can conclude that the trophic state in Boka Kotorska Bay is mainly oligotrophic. The present study showed a tendency for bacteria to be BU controlled in all three embayments. The predominance of the LNA group over the HNA group in the bacterial community during longer periods of the year and the prevalence of the HNA group during colder seasons are consist-ent with previous reports for other oligotrophic areas.
However, important factors that were not monitored in this study are the role of mix-otrophic flagellates with their contribution to total flagellate grazing on bacteria, particularly under nutrient-limited conditions, and grazing pressure on HNF by ciliates, which should be the subject of our future research.
REFERENCES
AZAM, F. & B. C. CHO. 1987. Bacterial utilization of organic matter in the sea. In: SGM41, Ecol -ogy of microbial communities. Cambridge University Press, Cambridge, pp. 261-281. BELLAFIORE, D., A. GUARNIERIB, F. GRILLIA,
P. PENNA, G. BORTOLUZZI, F. GIGLIO & N. PINARDI. 2011.
Study of the
hydrodynami-cal processes in the Boka Kotorska Bay with a finite element model. Dynam. Atmos. Oceans., 52: 298–321.CALVO-DÍAZ, A. & X. A. G. MORAN. 2006. Seasonal dynamics of picoplankton in shelf waters of the southern Bay of Biscay. Aquat. Micrb. Ecol., 42: 159-174.
CHRISTAKI, U., A. GIANNAKOUROU, F. VAN WAMBEKE & G. GRÉGORI. 2001. Nanoflagel-late predation on auto- and heterotrophic picoplankton in the oligotrophic Mediter-ranean Sea. J. Plankton Res., 23: 1297-1310. DAUTOVIĆ, J., S. STRMEČKI, B. PESTORIĆ, V.
VOJVODIĆ, M. PLAVŠIĆ, S. KRIVOKAPIĆ & B. ĆOSOVIĆ. 2012. Organic matter in the karstic enclosed bay (Boka Kotorska bay, South Adriatic Sea). Influence of freshwater input. Fresen. Environ. Bull., 21: 995-1006. FUHRMAN, J.A. & F. AZAM. 1982. Tymidine
incor-poration as a measure af heterotrophic bac-terioplankton production in marine surface waters. Mar. Biol., 66: 109-120.
GASOL, J.M. 1994. A framework for the assess-ment of top-down vs. bottom-up control of heterotrophic nanoflagellates abundance. Mar. Eco. Prog. Ser., 113: 291-300.
GASOL, J.M., P. A. DEL GIORGIO & C. DUARTE. 1997. Biomass distribution in marine planktonic communities. Limnol. Oceanogr., 42: 1353-1363.
GASOL, J.M. & X.A.G. MORÁN. 1999. Effects of fil-tration on bacterial activity and picoplankton community structure as assessed by flow cytometry. Aquat. Microb. Ecol., 16: 251-264.
GASOL, J.M., U.L. ZWEIFEL, F. PETERS, J. A. FUHR-MAN & A. HAGSTRÖM. 1999. Significance of size and nucleic acid content heterogeneity as measured by flow cytometry in natural
planktonic bacteria. Appl. Environ. Micro -biol., 65: 4475-4483.
JEFFREY, S.W., R. F. C. MANTOURA & S.W. WRIGHT. 1997. Phytoplankton pigments in Oceanogra-phy. UNESCO, Paris, 661 p.
JOCHEM, F. J. 2001. Morphology and DNA content of bacterioplankton in the nortern Gulf of Mexico: analysis by epifluorescence micro-scopy and flow cytometry. Aquat. Microb. Ecol., 25: 179-194.
JOCHEM, F. J., P. J. LAVRENTYEV & M. R. FIRST. 2004. Growth and grazing rates of bacteria groups with different apparent DNA con-tent in the Gulf of Mexico. Mar. Biol., 145: 1213-1225.
KRIVOKAPIĆ, S., B. PESTORIĆ, S. BOSAK, G. KUŠPILIĆ & R. WEXEL. 2011. Trophic state of Boka Kotorska Bay (South-Eastern Adriatic Sea). Fresen. Environ. Bull., 20: 1960-1969. KRSTULOVIĆ, N., M. ŠOLIĆ & I. MARASOVIĆ. 1997. Relationship between bacteria, phytoplank-ton and heterotrophic nanoflagellates along the trophic gradient. Helgöland. Meeresun -tersuch., 51: 433-443.
KRSTULOVIĆ, N., M. ŠOLIĆ & I. MARASOVIĆ. 1998. Regulation of bacterial abundance along the trophic gradient in the central Adriatic. Rapp. Comm. int. Mer Medit., 35: 352-353. .LEBARON, P., P. SERVAIS, H. AGOGUÉ, C. COURTIES
& F. JOUX. 2001. Does the high nucleic acid content of individual bacterial cells allow us to discriminate between active cells and inactive cells in aquatic systems? Appl. Environ. Microbiol., 67: 1775-1782.
LI, W. K. W., J. F. JELLETT & P. M. DICKIE. 1995. DNA distribution in planktonic bacteria stained with TOTO or TO-PRO. Limnol. Oceanogr., 40: 1485-1495.
LONGNECKER, K., B. F. SHERR & E.B. SHERR. 2005. Activity and phylogenetic diversity of bac-terial cells with high and low nucleic acid content and electron transport system activ-ity in a upwelling ecosystem. Appl. Environ. Microbiol., 71: 7737-7749.
MARIE, D., F. PARTENSKY, S. JACQUET & D.VAULOT. 1997. Enumeration and cell cycle analysis of
natural populations of marine picoplank-ton by flow cytometry using the nucleic acid stain SYBR Green I. Appl. Environ. Microb., 63: 186-193.
MORAN, X. A., A. CALVO-DIAZ & H. W. DUCKLOW. 2010. Total and phytoplankton mediated bot-tom-up control of bacterioplankton change with temperature in the NE Atlantic shelf waters. Aquat. Microb. Ecol., 58: 229.239. PORTER, K.G. & Y. S. FEIG. 1980. The use of DAPI
for identifying and counting aquatic micro-flora. Limnol. Oceanogr., 25: 943-948. RADULOVIĆ, M. 2006. Hydrogeological
character-istics of the Bokakotorska Bay (Serbia and Montenegro). In: 14th International karsto -logical school, Classical karst: Sustainable management of natural and envirnonmental resources on karst, 16-20.06. (Editor: Karst Research Institute, Scientific Research Cen -tre of the Slovenian Academy of Sciences and Arts) Postojna, Slovenia, 41-45.
RIEMANN, B., P. K. BJORSEN, S.NEWELL & R. FALLON. 1987.Calculation of cell production of coastal marine bacteria based on meas-ured incorporation of (H)thymidine. Limnol. Oceanogr., 32: 471-476.
SERVAIS, P., C. COURTIES, P. LEBARON & M. TROUSSELLIER. 1999. Coupled bacterial activity measurements with cell sorting by flow cytometry. Microb. Ecol., 38: 180-189. ŠANTIĆ, D., N. KRSTULOVIĆ, M. ŠOLIĆ & G.
KUŠPILIĆ. 2012. HNA and LNA in relation to the activity of heterotrophic bacteria. Acta Adriat., 53: 25-40.
ŠANTIĆ, D., N. KRSTULOVIĆ, M. ŠOLIĆ, M. ORDULJ & G. KUŠPILIĆ. 2013. Dynamics of prokaryo-tic picoplankton community in the central
and southern Adriatic Sea (Croatia). Helgo -land Mar. Res., 67: 471-481.
ŠESTANOVIĆ S, ŠOLIĆ M, KRSTULOVIĆ N. & Ž. NINČEVIĆ. 2004 . Seasonal and vertical dis-tribution of planktonic bacteria and hetero-trophic nanoflagellates in the middle Adri-atic Sea. Helgöland Mar. Res., 58: 83-92. ŠOLIĆ, M. & N. KRSTULOVIĆ. 1994. The role of
predation in controlling bacterial and hetero-trophic nanoflagellate standing stocks in the coastal Adriatic Sea: seasonal patterns. Mar. Ecol. Prog. Ser., 114: 219–235.
ŠOLIĆ, M., N. KRSTULOVIĆ, N. BOJANIĆ, I. MARASOVIĆ & Ž. NINČEVIĆ. 1998. Seasonal switching between relative importance of bottom-up and top-down control of bacterial and heterotrophic nanoflagellate abundanc-es. J. Mar. Biolog. Assoc. UK, 78: 755–766. ŠOLIĆ, M., N. KRSTULOVIĆ & S. ŠESTANOVIĆ. 2001. The roles of predation, substrate suply and temperature in controlling bacterial abun-dance: interaction between spatial and sea-sonal scale. Acta Adriat., 42: 35-48.
ŠOLIĆ, M., N. KRSTULOVIĆ, I. VILIBIĆ, N. BOJANIĆ, G. KUŠPILIĆ, S. ŠESTANOVIĆ, D. ŠANTIĆ & M. ORDULJ. 2009.
Variability in the
bottom-up and top-down controls of bacteria on
trophic and temporal scales in the middle
Adriatic Sea. Aquat. Microb. Ecol., 58:
15-29.
ZUBKOV, M. V., B. M. FUCHS, P. H. BURKILL & R. AMANN. 2001. Comparison of cellular and biomass specific activities of dominant bac-terioplankton groups in stratifies waters of the Celtic Sea. Appl. Environ. Microb., 67: 5210-5218.
Received: 25 February 2015 Accepted: 18 August 2015
Dinamika prokariotske zajednice u Bokokotorskom zaljevu
(Južni Jadran)
Aleksandra REDŽIĆ
1, Nada KRSTULOVIĆ
2, Mladen ŠOLIĆ
2, Danijela ŠANTIĆ
2i
Marin ORDULJ
3*1
Institut za biologiju mora, Dobrota bb, P.o.box 69, 85330 Kotor, Crna Gora
2Institut za oceanografiju i ribarstvo,
Šetalište Ivana Meštrovića 63, 21 000 Split, Hrvatska
3
Sveučilište u Splitu, Sveučilišni odjel za studije mora,
Livanjska 5/III, 21 000 Split, Hrvatska
* Kontakt adresa, e-mail: krstulovic@izor.hr
SAŽETAKRaspodjela i aktivnost prokariotskog pikoplanktona u crnogorskom dijelu južnog Jadrana je studirana na šest postaja Bokokotorskog zaljeva u razdoblju od siječnja 2010. do siječnja 2011. Istraživana je brojnost nepigmentiranih bakterija, udjeli bakterija s visokim (HNA) i niskim (LNA) sadržajem nukleinskih kiselina, bakterijska proizvodnja, heterotrofni nanoflagelati (HNF) te klorofil a i fizikalno kemijski čimbenici. Utvrđeno je da unos slatke vode u istraživano područje ima utjecaja na bakterijsku brojnost, na udjele HNA I LNA grupa bakterija kao i na brojnost HNF-a. U toplijem razdoblju godine u istraživanom je području utvrđen porast i prevladavanje LNA bakterija dok je prevladavanje HNA bakterija utvrđeno u hladnijem dijelu godine. Slaba povezanost između bak -terija i HNF ukazuje da predacija nije prevladavajući mehanizam kontrole bakterijske abundancije u istraživanom području.
Ključne riječi: heterotrofne bakterije, HNA, LNA, bakterijska proizvodnja,