Facoltà di Farmacia e Medicina
Corso di dottorato in Scienze Immunologiche, Ematologiche e Reumatologiche.
Curriculum Ematologico.
T
ARGETING
L
EUKEMIA
C
ELL
M
ETABOLISM
Tesi di Dottorato
Relatore:
Candidato:
Prof. Agostino Tafuri
Simone Mirabilii
Correlatore:
Matricola:
dott.ssa Maria Rosaria Ricciardi
1181948
2
Content
Abstract
,
p.4
Chapter I –
Introduction
1.1.
Cancer cell metabolism: Introduction
,
p.5
1.1.1.
Glycolysis,
p.6
1.1.2.
Glutaminolysis,
p.7
1.1.3.
Fatty Acid Metabolism,
p.8
1.2.
Targeting Leukemia Cell Metabolism
,
p.9
1.2.1.
Glycolysis,
p.10
1.2.2.
Glutaminolysis,
p.12
1.2.3.
L-asparagine,
p.14
1.2.4.
Fatty Acid Metabolism,
p.16
1.2.5.
Pentose Phosphate Pathway,
p.17
1.2.6.
Oxidative Phosphorylation (OXPHOS),
p.18
1.3.
Traditional and Novel Technologies for Studying Cell Metabolism in
Hematological Malignancies
,
p.19
1.4.
Aim of The Study
,
p.23
Chapter II –
Targeting Glycolysis in AML Cells: Dichloroacetate
2.1
Introduction
,
p.24
2.2
Materials
,
p.26
2.2.1
Reagents,
p.26
2.2.2
Cell Culture and Primary Samples,
p.26
2.3
Methods
,
p.26
2.3.1
Apoptosis Analysis,
p.26
2.3.2
ROS Production,
p.26
2.3.3
Real-time Metabolic Analysis,
p.27
2.3.4
Data Analysis and Statistics,
p.28
2.4
Results & Discussion
,
p.28
3
Chapter III –
Targeting Glutaminolysis in AML Cells: Aminooxyacetate
3.1
Introduction
,
p.37
3.2
Materials
,
p.38
3.2.1
Reagents,
p.38
3.2.2
Cell Culture and Primary Samples,
p.39
3.3
Methods
,
p.39
3.3.1
Glutaminolytic Rates,
p.39
3.4
Results & Discussion
,
p.39
Chapter IV –
Targeting FAO in Leukemia Cells: ST1326
4.1
Introduction
,
p.45
4.2
Materials
,
p.46
4.2.1
Reagents,
p.46
4.2.2
Cell Culture and Primary Samples,
p.46
4.3
Methods
,
p.47
4.3.1
Cell Cycle and Apoptosis Analysis,
p.47
4.3.2
Mitochondrial Membrane Potential,
p.47
4.3.3
Functional FAO Assay,
p.48
4.3.4
Histomorphological Analysis,
p.48
4.4
Results & Discussion
,
p.49
Chapter V –
Conclusions
,
p.58
4
Abstract
Recent evidences show that malignant cell undergo a metabolic reprogramming, acquiring new bioenergetic phenotypes. These new metabolic features grant them the capability of sustaining expensive processes such as cell growth and proliferation. Among the metabolic pathways involved, an increased glycolytic flux, the exploitation of alternative carbon source like glutamine, and an increase in fatty acid metabolism may be included. Metabolic reprogramming is strictly related to aberrant activation of signal transduction pathways, but the causal relationship between altered signalling and redesigned metabolism is currently under review, based on recent works showing a feedback mechanism, in which metabolites are involved in controlling signal fluxes through specific sensor kinases which monitor the cell bioenergetic status. Therefore, cancer cell metabolism represents a potential target for therapeutic intervention that may be integrated with conventional chemotherapy and molecularly targeted agents. In solid tumors, a great number of studies supports the potential of this approach while only few are published in hematologic malignancies.
With the aim of extending the knowledge of leukemia cell metabolic phenotypes, we studied the role of the main catabolic pathways, such as glycolysis, glutaminolysis and fatty acid oxidation. This study involved the use of metabolic inhibitors, in order to identify novel molecular therapeutic strategies in hematological malignancies.
Dichloroacetate (DCA) is a pyruvate-mimetic molecule, which acts as pyruvate dehydrogenase kinase (PDHK) inhibitor, thus activating pyruvate dehydrogenase (PDH). This activation causes a shift in leukemic cell metabolism, from aerobic glycolysis to glucose oxidation. Our results documented that acute myeloid leukemia (AML) cells are characterized by higher rates of glycolysis compared to normal cells and that the use of DCA, an inhibitor of glycolysis, acts in a short time (30-60 minutes), increasing the levels of oxidative phosphorylation and, in a longer time, reducing cell growth and inducing apoptosis in cells of AML.
Aminooxyacetic Acid (AOA) is a cellular transaminase inhibitor. This compound is able to inhibit the conversion from glutamate to α-ketoglutarate, second step of the glutaminolytic process. ST1326 is an aminocarnitine derivative, able to block the activity of CPT1a, the enzyme which catalyze the rate-limiting step of fatty acid oxidation. The results obtained in our in vitro study showed a high pro-apoptotic activity of this inhibitor in models of cell lines and primary cells from acute leukemia.
Overall, these preclinical results demonstrate the role of cell metabolism as a potential therapeutic target in hematologic malignancies, warranting further extension of this strategy.
5
CHAPTER I
Introduction
1.1 Cancer cell metabolism: Introduction
It is currently known that the transformation from normal to neoplastic cells (tumorigenesis) is the result of a multistep process that starts with the emergence of genetic alterations [1]. These changes involve the acquisition of several functional advantages, allowing cancer cells to survive, proliferate and disseminate within tissues and organs.
In 2000 Hanahan and Weinberg observed that the vast repertoire of genetic alterations present in cancer cells is manifested through the acquisition of six major functional characteristics: independence from growth factors, insensitivity to anti-proliferative stimuli (e.g. contact inhibition), the ability to escape the mechanisms of programmed death (e.g. apoptosis), a practically unlimited replicative potential, increased angiogenesis, and the ability to invade and metastasize tissues [2].
In more recent years, several authors have shown that many of the Signal Transduction Pathways (STPs) aberrantly activated in cancer cells actually converge on the deregulation of common metabolic mechanisms, responsible for cell growth and survival [3-6]. In light of these findings, it has been proposed that alterations in cellular metabolism are further distinctive feature of cancer [7].
In neoplastic cells alterations of metabolic processes are necessary to fulfill three main basic needs: rapid production of ATP, an increased biosynthesis of macromolecules and an adequate cellular redox state [8]. To this end, tumors activate complex mutagenesis programs that induce drastic changes in levels and utilization of all biological macromolecules (carbohydrates, lipids, proteins, nucleic acids) [8]. The alterations of the metabolic processes, however, differ from tumor to tumor, because of the close interaction between the cells and the tumor microenvironment, where the concentrations of nutrients such as glucose and glutamine, or gas such as oxygen, are spatially and temporally heterogeneous [9].
In recent years a large number of studies have focused on the analysis of metabolic aspects that distinguish cancer cells compared to normal counterpart, highlighting a central role for glycolytic and glutamine metabolism, not only in the maintenance of STPs but also, and above all, their direct contribution in the process of tumorigenesis [10].
6
It is clear therefore that the study of metabolic changes that characterize neoplastic cells represent a very promising field of research for development of new therapeutic strategies capable of selectively targeting tumor cells [11]. The inhibition of metabolic processes, by blocking the catalytic activity of the enzymes involved, is configured as a strategy to reverse the neoplastic phenotype by inhibiting the growth, inducing apoptosis and inhibiting the neoangiogenic processes in invasive tumor cells [12].
The most successful example of antineoplastic strategy based on metabolic therapies is certainly represented by the class of antifolate drugs [13], such as 5-fluorouracil, methotrexate, gemcitabine and fludarabine, widely used in the treatment of several cancers. Another example is represented by the use of L-asparaginase in the treatment of Acute Lymphoblastic Leukemia (ALL) [14] and lymphomas [15]. In more recent years, thanks to the elucidation of the molecular basis of metabolic reprogramming, it has been possible to define new therapeutic strategies based on the administration of glycolytic inhibitors [16], compounds capable of reducing the excess lactic acid produced by the tumor cells. However, other strategies can be adopted, focused on alternative carbon source, such as glutamine [17] and fatty acids [18].
1.1.1 Glycolysis
In the beginning of the last century, Warburg’s work demonstrated that cancer cells consume more glucose and generate more lactate when compared to normal cells. This lactic fermentation, distinctive of an anaerobic process, is independent from oxygen availability [19]. This anaerobic glycolysis upregulation, called “Warburg Effect”, has subsequently been confirmed in most cancer types [20], with few exceptions. Ramanathan and colleagues showed that the process of carcinogenesis increases cellular dependence on glycolytic, while decreasing its dependence on mitochondrial energy production [21]. By using a fibroblast model transfected with the telomerase catalytic subunit (hTERT) in combination with simian virus 40 large T antigen (LT), small T antigen (ST), and with an oncogenic allele of H-ras, and exposing these transfected fibroblasts to different metabolic inhibitors, they observed an increase in glycolysis inhibition sensitivity and a parallel loss in sensitivity to OXPHOS targeted agents, thus suggesting a shift from an oxidative to a more glycolytic metabolism during carcinogenesis [21]..
For each glucose molecule the glycolytic process produces through lactic acid production 2 molecules of ATP and re-generates redox intermediates: 2 NAD+ [22]. Conversely, the complete oxidation of glucose, though OXPHOS, has a theoretical yield of 38 ATP per molecule of glucose. This inefficiency in energy generation by cancer cells that appears as a paradox, given the high
7
energy demand, can be overcome by increasing the glycolytic flux: GLUT1 glucose transporter has been reported as overexpressed in a variety of tumors, such as bladder, lung, colon, breast, ovarian and gastric cancers [23]. Glycolytic enzymes, such as hexokinase, phopshofructokinase and pyruvate kinase, are as well upregulated in most cancer histotypes [24]. It has been suggested that, in non-limiting glucose condition, lactate production grants a higher energy yield compared to OXPHOS [25, 26]. Moreover, coupling glycolysis to ATP generation would leave Tricarboxylic Acid cycle (TCA) cycle intermediates available for incorporation in biosynthetic pathways, increasing the anaplerotic functions of the latter process.
Furthermore, glucose itself can be used for biosynthesis of amino acids, lipids and nucleotides [27]. This observation is supported by data obtained by Nuclear Magnetic Resonance (NMR) focused on the carbon isotope 13 (13C), performed on glioblastoma cells, confirming Warburg effect and indicating that 10% of total glucose utilization is devolved to synthesis of fatty acids, amino acids and nucleotides [28]. In addition, the same work, along with others, underlines the importance of glutamine in tumor cell metabolism.
1.1.2 Glutaminolysis
Glutamine is a conditionally essential amino acid: normal cells are able to synthesize it, but in stress condition, such as sepsis, the increased demand is not met by biosynthesis [29]. Similarly to glucose, glutamine is fundamental in cancer cell metabolism. It acts as a carbon source, nitrogen donor, and as redox buffer, being the precursor of glutathione [30]. Glutamine catabolic process start with its deamination operated by the glutaminase enzyme, to form glutamate (Glu) and NH4. Glutamate is then converted by a deamination step to α-ketoglutarate (α-KG), a TCA cycle intermediate. The conversion of Glu to α-KG is catalyzed by Glu dehydrogenase or one of several transaminases, which convert α-keto acids into their corresponding amino acids [31]. Importantly, the flux of glutamine provide high rate of NADPH production used by cell for lipid and nucleotide biosynthesis [17].
8
Figure 1 – Metabolism of glutamine in cancer cells (from [32])
Thus, Glutamine can enter the TCA cycle directly (anaplerosis), or being diverted in peculiar series of reactions, termed reductive carboxilation: glutamine-derived α-ketoglutarate can be reductively converted into isocitrate, which is then isomerized to citrate to supply acetyl-CoA for de novo lipogenesis [33]. However, 13C tracking analysis on glioblastoma showed that 60% of glutamine is oxidized to lactate and alanine, while the remaining is used as an anaplerotic source, to replenish TCA cycle flux impaired by the diversion of glucose-derived pyruvate into lactic fermentation [28].
1.1.3 Fatty Acid Metabolism
The metabolic reprogramming of cancer cells leads to a re-arrangement that involves also the third major carbon sink, fatty acids (FA). Similarly to glycolysis and glutaminolysis, it’s long known that cancer cells up-regulates the synthesis of these molecules [34]. Since these early observations, most groups focused their efforts on dissecting the de novo synthesis of FA (FAS), as a way for cancer cells to produce cell membranes, signaling lipid molecules, protein
post-9
translational modifications and as energy supply to support rapid cell proliferation [35]. The overexpression of the Fatty Acid Synthase enzyme (FASN), the key enzyme of FAS, has been in fact reported in prostate, ovarian, breast, endometrial, thyroid, colorectal, bladder, lung, thyroid, oral, tongue, esophageal, hepatocellular, pancreatic and gastric carcinomas, malignant melanoma, mesothelioma, nephroblastoma and retinoblastoma, soft tissue sarcoma, gastrointestinal stromal tumor, Paget’s disease of the vulva and multiple myeloma (MM), as well as in some benign and pre-invasive lesions of prostate, breast, lung, stomach, colon and cutaneous nevi [36]. Interestingly, cancer cells prefer to synthesize new FA, instead of using available FA from bloodstream or from extracellular environment: Ookhtens and colleagues, using 14C labeled FA, demonstrated that 93% of FA is built de novo [37]. Moreover, a recent report from Scott and colleagues assessed the significant contribution of glutaminolysis, through the above mentioned process of reductive carboxilation, in providing the building blocks for FAS [38]. The established perturbations in FAS partially eclipsed the role of the oxidation process of these molecules (Fatty Acid Oxidation, FAO) in the bioenergetic balance of cancer cells, given that these two pathways are always been considerate as mutually exclusive. In fact, relatively few papers investigated FAO process in the tumor setting. However, a series of recent works focused on this process pinpointed the importance of FAO in supporting cancer cell survival and proliferation. Thompson’s group demonstrated that FAO can rescue cancer cells from glucose deprivation-induced apoptosis [39]. Nomura and colleague reported the overexpression of monoacylglycerol lipase (MAGL), a lipolytic enzyme that catalyzes the hydrolysis of monoacylglycerols, is highly expressed in aggressive tumors and controls the levels of free fatty acids (FFA) in cancer cells [40]. This mobilization of FA can then be exploited by tumor cell through β-oxidation. This process has been reported to be of high importance in glioblastoma [41, 42], prostate [43] and breast cancer [44]. Moreover, in breast cancer cells FAO appears to be activated by prolactin [45] and in recovering from stress conditions, such as loss of matrix attachment [46] and fluctuation of oxygen levels [47]. Combined, these evidences point thus toward a protective role for FAO in cancer cell metabolic stresses induced by microenvironment.
1.2 Targeting Leukemia Cell Metabolism
While in most solid tumors metabolism has been well characterized, few evidences have been reported on cell metabolism in hematological malignancies. However, in the last years the number of publications in this field increased. Results indicate that perturbations in metabolic
10
pathways are similar to what happen in solid tumors, paving the way for a therapeutic exploitation of these phenomena.
1.2.1 Glycolysis
Among the first metabolic alterations reported, an increase in glycolytic flux has been observed in leukemia cells. Using Akt-transfected immortalized hematopoietic cells, Thompson’s group demonstrated that Akt exerts a direct influence on glucose metabolism, inducing a dose-dependent stimulation of glycolysis that correlates with a more aggressive phenotype [48]. The increase in glycolysis is not correlated to an increase in oxygen consumption rates, i.e. a complete glucose oxidation through the TCA cycle and OXPHOS, indicating that Akt hyper-activation promotes the Warburg effect [48].
An increased glycolytic flux has been then reported in Acute Lymphoblastic Leukemia (ALL) cells [49]. The gene expression profile of ALL blasts from newly diagnosed pediatric patients shows an up-regulation of genes related to glycolysis, and a down-regulation of genes related to TCA cycle, when compared to normal CD34+ [49]. Moreover, ALL blasts show a higher protein expression of GLUT-1 transporter [49]. Importantly, GLUT-1 appears to be fundamental in maintaining cell growth and apoptosis resistance in Bcr-Abl positive B-ALL [50]. Additionally, glycolysis rate has been strongly linked to chemotherapeutic drugs resistance in ALL [51-54].
Aberrant signaling by Bcr-Abl seems implicated in increasing the glycolytic flux in Chronic Myeloid Leukemia (CML) cells, via the PI3K-Akt axis [55], and higher glycolysis in CML cell lines is related to imatinib resistance [56].
Evidences have been reported also in Acute Myeloid Leukemia (AML) cells. The aerobic glycolysis appears to be exacerbated in these cells by stromal interactions [57], and the extent of glycolytic flux seems to inversely correlate with patient prognosis [58]. More recently, Chen and colleague confirmed the enhanced glycolysis in AML cells, using mass spectrometry-based metabolomics [59]. In particular, they individuated a panel of 6 metabolites related to glucose metabolism (Lactate, 2-Oxo-glutarate, Pyruvate, 2-Hydroxy-Glutarate, Glycerol-3-phosphate, Citrate) having an independent prognostic value in cytogenetically normal AML patients [59].
Perhaps the most convincing proof of the importance of aerobic glycolysis in leukemogenesis is presented in a very recent work by Wang and colleagues [60]. They used genetically modified murine models to investigate the effects of deletion in the two last enzymes of aerobic glycolysis, pyruvate kinase (PK) and lactate dehydrogenase (LDH), in normal hematopoietic stem cells and in normal murine BM cells transfected with either BCR-ABL or MLL-AF9 genes, in order to simulate a CML-like or an AML-like disease, respectively. After serial transplantations, they
11
observed that the conditional deletion of PK or LDH profoundly affected viability of leukemic-like cells, even following the first transplantation, while the effects on normal hematopoietic stem cells were detectable only after multiple transplants, thus individuating a “therapeutic window” for glycolysis interfering in leukemogenesis [60].
Taken together, these results show that an increase in glycolytic flux is nearly universal in the different leukemia subtypes, pointing at the Warburg effect as a promising target for therapeutic intervention.
Given that aerobic glycolysis is the best characterized metabolic alteration in leukemia cells, it is not surprising that the vast majority of metabolic inhibition attempts has been aimed at this pathway. The most used inhibitor has been 2-deoxyglucose (2-DG), a glucose analog that is phosphorylated by hexokinase but cannot be further processed, and accumulates in the cytosol inducing a decrease in ATP production, cell cycle blockage, inhibition of cell growth and apoptosis [61]. As single agent, 2DG proved effective in inducing apoptosis in ALL cells [49] and in suppressing xenotransplanted AML tumor growth [62].
However, being a glucose agonist, 2-DG is active only at high concentrations (millimolar range), difficultly achievable in patients due to serious side effects, such as induction of hyperglycemia [63]. Nonetheless, the use of 2-DG appear promising when used in combination therapy, showing a high degree of synergism with conventional chemotherapeutic agents, such as glucocorticoids in ALL [52], ATO [64] and AraC [59] in AML.
Given the well-established impact of aberrant cell signaling on glycolytic flux, researchers focused on the possibility to target simultaneously the upstream kinase activity and the downstream effect on metabolism, in a two-level intervention aiming to overcome the resistance caused by bypassing mechanisms. Indeed, 2-DG is reported to sensitize leukemia cells to Bcl2 agonists [65, 66], Akt targeting agents [67] and death receptor activators [68, 69].
Figure 2 – Chemical structure of 2-Deoxyglucose (from www.sigma-aldrich.com)
12
The promising results obtained with 2-DG, together with its mentioned limitations, has led to the development of more potent glycolysis inhibitors, such as 3-bromopyruvate (3-BrPA) and its derivative, 3-bromo-2-oxopropionate-1-propyl ester (3-BrOP). 3-BrPA acts on Hexokinase, and it is reported to be effective in the micromolar range on AML cells, showing synergism with the main chemotherapeutic drugs [70, 71].
Figure 3 – Chemical structure of 3-bromopyruvate (from www.sigma-aldrich.com)
However, authors reported an instability for this compound, that led to the generation of a more stable form, 3-BrOP. 3-BrOP is an ester of 3-BrPA, which can permeate cell membrane and undergoes hydrolyzation by cellular esterases, releasing the active moiety of the compound, the 3-BrPA [72]. 3-BrOP has been reported to be more potent than its native form, inducing a reduction of cell proliferation in a panel of 15 different acute leukemia cell lines and primary blasts of myeloid and lymphoid origin, a drop in intracellular ATP levels and massive apoptosis; moreover, 3-BrOP showed high synergism when combined with an mTOR inhibitor, rapamycin [73].
1.2.2 Glutaminolysis
It’s long known that leukemia cells, as solid tumors cells, require glutamine as substrate. Some hints derive from lesson learned from cell culture: without the addition of this amino acid, leukemia cells show impaired nucleotide synthesis [74], reduction of proliferation and of DMSO-induced differentiation [75], decrease in ATP content [76], cell growth arrest and apoptosis [77]. Similarly to solid tumors, glutamine has been reported as anaplerotic substrate: diverting pyruvate into lactate, leukemia cells exploit glutamine to replenish TCA cycle and keep it active, in order to maintain the availability of this cycle intermediates for biosynthetic purposes [78].
Glutamine addiction assumes a particular meaning in AML cells. In fact, mutation in metabolic genes has been recently reported in approximately 20% of AML [79]. In particular, using massive parallel genomic DNA sequencing, mutation in Isocitrate dehydrogenase (IDH) genes has been
13
found, with a peculiar association to cytogenetically normal patients. These genes encode for proteins involved in the TCA cycle, catalyzing the conversion from isocitrate to α-ketoglutarate [80]. Mutations in the active sites of these proteins leads to a gain of function: the enzymes catalyze an inverted reaction, starting from α-ketoglutarate to produce 2-hydroxy-glutarate (2HG). It is still unclear how this metabolite contributes to the carcinogenesis; however, evidences suggest that it can compete with ketoglutarate, blocking the activity of α-ketoglutarate-dependent enzymes (i.e. dyoxigenases), or that 2HG can influence cellular epigenetic status interfering with histone demetylases, thus activating oncogenes or silencing tumor-suppressor [80].
The α-ketoglutarate used for 2HG production derives almost entirely from glutamine: through 13
C-labeled substrates and a liquid chromatography coupled to mass spectrometry (LC-MS)
14
approach, Dang and colleague demonstrated that cells transfected with mutant IDH produces high level of 2HG, using the carbon skeleton from glutamine [81].
Glutamine antagonists exert cytotoxic effects on leukemia cells. Lyons and colleague showed in 1990 that azaserine, acivicine and 6-diazo-5-oxo-L-norleucine block glutamine-dependent purine synthesis in murine leukemia cells, inbalancing the UTP/ATP ratio and causing accumulation of intermediate metabolites [82]. However, only recently additional reports underlined the promising effectiveness of targeting glutamine catabolism in leukemia cells.
Bis-2-[5-(phenylacetamido)-1,3,4-thiadiazol-2-yl]ethylsulfide (BPTES) is a small molecule inhibitor that acts on glutaminase, the enzyme that catalyze the conversion from glutamine to glutamate, releasing ammonia ions [83]. This compound has been reported to be effective on Burkitt’s Lymphoma cells, reducing their proliferation in normoxic condition while inducing apoptosis in hypoxic condition [84]. Moreover, it significantly slows tumor progression in xenografted mice [84]. More recently, BPTES has been applied to primary AML cells with IDH mutation, since their mentioned reliance on glutamine [85]. The high sensitivity of IDH1 mutant cells to this compound [85] prompts further study on the therapeutic role of glutamine metabolism targeting in this particular subclass of patients.
Figure 5 – Chemical structure of BPTES (from www.sigma-aldrich.com)
1.2.3 L-asparagine
Strictly biochemically related to glutamine, asparagine (Asn) is a non-essential amino acid. In the 1960s, the activity of asparagine synthetase (ASNS), the enzyme responsible for its synthesis from aspartate and glutamine, has been found impaired in some leukemia subtype, especially in ALL [86]. This reduced activity cause a dependence of these cells from exogenous source of Asn, and this dependence has been promptly exploited as a therapeutic target: treatment with L-asparaginase (L-ase) started in 1967, and since then L-ase has become of fundamental importance in childhood ALL treatment, inducing 40-60% of complete remissions as a single
15
agent, and nearly 95% of complete remissions when combined with vincristine and prednisone [88].
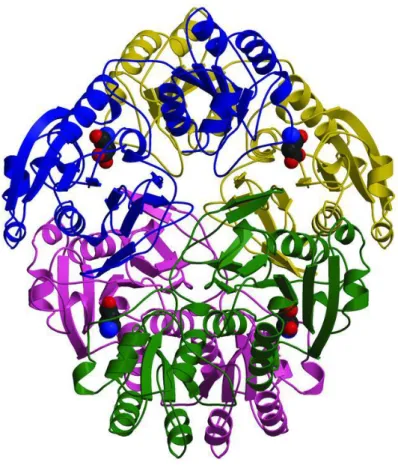
Figure 6 – E. coli L-asparaginase tetramer
Interestingly, a debate is currently ongoing in the scientific community about the actual mechanism of action of L-ase, since this enzyme has also a glutaminase activity. While some authors attribute to this activity the insurgence of serious side-effects [89], prompting the development of new L-ases with undetectable glutaminase activity [90, 91], others suggest that the effectiveness of this therapy is also due to glutamine depletion [92, 93]. Recent studies support this latter hypothesis: using an LC-MS approach on adherent cells, Purwaha and colleagues showed that the induction of apoptosis by L-ase exposure is more related to glutamine levels than to asparagine concentration [94].
Ehsanipur and colleagues reported that a possible resistance mechanism of ALL cells to L-ase may be caused by adipocytes releasing glutamine [95]. Bouscary’s group suggests that L-ase treatment may be useful in AML, since they reported mTORC1 inhibition, protein synthesis suppression and apoptosis induced by the glutaminase activity of L-ase in AML cell lines and
16
primary blasts [96]. A way to overcome resistance may be thus selecting for L-ases that can metabolize glutamine with higher affinity.
1.2.4 Fatty Acid Metabolism
While solid tumors often show an upregulation of FAS, evidences in leukemia for higher rates of this process are thus far very few. Some authors described an upregulation of FASN in AML [97, 98], but the vast majority described a system in which both FAS and FAO works in a nearly physiological manner. An early report noted that leukemia cells tend to incorporate free fatty acids (FFAs) into phospholipids without altering them, while part of this FFAs are β-oxidized [99]. Importantly, nearly no carbon atoms from glucose are used by leukemia cells to de novo synthesis of lipids [99]. Supporting these observations, Skrede and Iversen reported an increase in oxidation and incorporation into phospholipids of labeled palmitate in a murine model of Acute Promyelocytic Leukemia (APL) [100]. More recently, two works from Nitta’s group suggested that, in some AML subtype, represented by THP-1 and HL60 cell lines, FAO can be important in replenish TCA cycle, providing the acetyl-CoA to feed this central metabolic hub [101, 102]. Taken together, these results suggest a higher rate of FA metabolism in leukemia cells, with a balance between oxidation and synthesis. In effect, some author suggested that to meet bioenergetic and biosynthetic needs of cancer cells, these two mutually exclusive processes can occur at the same time, by compartmentalizing them in two different cellular environment (namely cytosol for FAS, mitochondria for FAO) [103]. Alternatively, it can be speculated that leukemia cells alternate cycles of FAS and FAO, based on different time points in the cell cycle, in order to satisfy both the need for replenish TCA cycle and the demand for membrane phospholipids.
Interfering with FA metabolism is a relatively new approach of targeting leukemia cell metabolism. As mentioned, the lack of extensive proofs on FAS leads researchers to focus on the β-oxidation process. Etomoxir is a well known FAO inhibitor: it blocks the import of FA in mitochondria, thus irreversibly inhibiting the first step of this process, catalyzed by carnitine-palmitoyl-transferase 1 [104]. Samudio et al. in 2010 reported that etomoxir can reduce AML cell proliferation, alone or in co-culture with stromal cells; moreover, it synergizes with ABT-737 in apoptosis induction [105]. More recently, etomoxir has been shown to potentiate the apoptotic effects of ATO and glycolysis inhibitors, such as 2DG, on HL60 cell line [106].
17
Figure 7 – Chemical structure of etomoxir (www.sigma-aldrich.com)
Following studies on MM confirmed the effectiveness of etomoxir-induced FAO inhibition in hematological malignancies [107]. Interestingly, in the same study FAS inhibition by orlistat seems to induce apoptosis as well [107], thus indicating that the whole machinery involved in FA can be a promising therapeutic target.
1.2.5 Pentose Phosphate Pathway
Early observations by Lengle and colleagues reported that pentose phosphate shunt (PPP) is upregulated in leukemic cells from a murine model [108]. However, authors concluded that, whether the flux was higher, the percentage of glucose metabolized by this pathway was comparable to that of normal thymocytes [108]. This high flux through the non-oxidative branch of PPP has been confirmed in Jurkat cells through 13C-NMR analysis: labeled glucose is partially diverted in PPP and metabolized for de novo synthesis of ribose-5-phosphate, an essential precursor of nucleotides [109]. Chemoresistance has been linked to high flux in PPP [110] and to overexpression of glucose-6-phosphate dehydrogenase, the key enzyme of this process [111]. Moreover, a recent report from Yamamoto and colleague showed an upregulation of PPP flux in U937 cell line when exposed to oxidative stress, and a concomitant reduction in glycolytic flux mediated by methylation of phopshofructokinase/fructose bisphosphatase 3 [112]. Some evidence of a hyperactivity of 6-phoshogluconate dehydrogenase, involved in the oxidative branch of PPP, has been reported in leukemia blasts [113], indicating that both the oxidative and non-oxidative branches of PPP may represent a potential target.
The effect of 6-Aminonicotinamide (6-AN), a 6-phoshogluconate dehydrogenase inhibitor, has been extensively investigated, showing a cytotoxic effect as single agent [114] and a sensitizing action when used in combination with chemotherapeutic drugs [115, 116]. Furthermore, 6-AN is reported to synergize with the Bcl2 inhibitor ABT-263 in inducing apoptosis in leukemia cells [117]. Additional studies are needed to fully explore the potentiality behind PPP interfering.
18
Figure 8 – Chemical structure of 6-Aminonicotinamide (from www.caymanchem.com)
1.2.6 Oxidative Phosphorylation (OXPHOS)
Recently, alterations of mitochondrial gene expression have been reported in CML stem cells. In particular, an upregulation of genes encoding for complex I, II, IV and V, and a deregulation of complex III gene transcription [118] which the authors correlated with the high amount of ROS usually found in those cell has been reported [119]. Several groups detected mutations on mitochondrial DNA in genes coding for complex I [120, 121], and complex IV [122] in AML patients. Although these studies lack of extensive functional characterizations, their results may partially explain the dependence of leukemic cells from glycolysis, at least in some subgroups. On the contrary, different evidences are emerging about Chronic Lymphoblastic Leukemia (CLL) cell metabolism, as these cells seem to rely more on oxidative phosphorylation than glycolysis. Jitschin and colleagues observed in CLL cells high levels of ROS derived by an enhancement in OXPHOS, caused by higher functional mitochondria biogenesis and increased respiratory rates [123]. If confirmed, these results place CLL in a different metabolic category compared to the other hematological malignancies, as these cells are not subjected to the Warburg effect.
The upregulation of glycolysis, and the diversion of pyruvate into lactate, does not completely shut down the OXPHOS. Thus, mitochondrial respiration could be a reliable target. Since the appearance of a report, observing a reduced incidence of cancer in metformin-treated diabetic patient [124], this molecule has been extensively studied as anti-neoplastic agent. Metformin is a biguanide derivative with a double action: it inactivates mTORC, through an AMPK dependent mechanism, and inhibits electron transfer chain complex I [125].
19
Figure 9 – Chemical structure of Metformin (from www.stressmarq.com)
This molecule appear to be effective in induce reduction of cell proliferation and apoptosis in CML [126], AML [127, 128] and ALL [126, 129, 130]. However, it is still unclear if metformin exerts its pro-apoptotic action through the mTORC inhibition or its effect on cell metabolism, prompting further study to understand and enhance its properties.
1.3 Traditional and Novel Technologies for Studying Cell Metabolism in
Hematological Malignancies
Cell metabolism has been investigated through a variety of instrumentation, from Clarke-type oxygen sensor to measure oxygen consumption, to spectrophotometric detection of metabolites through generation of fluorescent intermediates. However, three are the current technologies that allow the most comprehensive view of cell metabolism. While Nuclear Magnetic Resonance (NMR) and Mass Spectrometry (MS) are nowadays well established and widespread, Seahorse XF Analyzer is rapidly expanding as a cost-effective way to monitor in real-time metabolic rates of live intact cells.
NMR exploits nuclear spin of magnetic-field immersed atom nuclei: the emission of radiofrequencies allows to interact and detect specific atom groups, distinguishing up to 75 metabolites in a sample, with a sensitivity lower limit around 5µM [131].
Mass spectrometry is based on fragmentation of molecules and their separation based on mass/charge ratio. Typically, to increase resolution power, MS is coupled to purification system, such as liquid chromatography (LC) [132]. Combining these two technologies, LC-MS is able to identify from 200 to 500 metabolites, with a limit of detection in the picomolar order [131]. Usually, there are two kind of strategies related to both types of technology: an untargeted approach, aimed at the detection of all possible metabolites and in putative differences in
20
metabolite distributions between paired samples (i.e. normal vs. cancer, control vs. treated, time-series), and a targeted approach, in order to detect specific pathways and to quantify their fluxes [133]. Both these technology have been successfully applied to the biological characterization of hematological malignancies: NMR metabolomics on patient sera proved effective in distinguish between IGHV-mutated and unmutated in early-stage untreated CLL patients [134], while MS-based metabolomics has been able to show that glucocorticoids act by inhibiting glucose metabolism in ALL cells [53]. An untargeted approach, and a combination of NMR and MS, has been adopted by Tiziani and colleagues to detect differences between the bone marrow and peripheral blood compartments in pediatric ALL primary blast metabolism as well as the metabolic response to L-ase treatment, confirming high rates of aerobic glycolysis in these cells and that L-ase partially acts by depleting glutamine pool [135].
However, the main limitation of NMR and MS is the need for a metabolite extraction, which means that cells have to be destroyed in order to perform experiments.
On the other hand, Seahorse XF Analyzer is a new instrument able to simultaneously measure, in real time and on live cells, extracellular acidification rate (ECAR) and oxygen consumption rate (OCR). ECAR is proportional to lactate derived from glycolysis and excreted by cells in the extracellular medium [136]. OCR is proportional to mitochondrial respiration, and thus to OXPHOS [136]. The presence of drug injection ports (4 per well) allows to interact with cell metabolism, adding specific inhibitors to further dissect metabolic fluxes, or investigating metabolic response to a specific drug.
A typical XF experiment proceeds through a seeding phase, where cells are moved in the special multiwell designed for the XF; a switch in culture medium, replacing it with a non-buffered medium, in order to allow the acidification rate measurement; loading of chosen compound in the drug injection ports; calibration of XF fluorimetric sensors. Once started, the XF measures OCR and ECAR for about 120 minutes.
To measure glycolysis rate, only glutamine is added to the assay medium. The first three round of measurement gives the basal state. The first injection is composed of glucose 10mM, followed by 3 rounds of measurements to detect glycolytic rates. Measurements following injection of oligomycin A, an ATP-synthase inhibitor that shuts down mitochondrial energy production, reveal the maximal glycolytic rates. Finally, 2-DG is injected to block glycolysis and detect the lactate-independent acidification, to be subtracted during data processing. Fig 10 shows a representative glycolysis experiment on the XF analyzer.
21
Figure 10 – Typical experiment to measure cellular glycolytic capacity (from www.seahorsebio.com)
For mitochondrial respiration experiments, the assay medium is supplemented with glucose, pyruvate and glutamine. As for the measurement of glycolysis rate, the first three rounds of measurements give the basal respiration rate. Injection of oligomycin A and following measurements reveal the portion of oxygen consumption coupled to ATP synthesis. Then, the injection of FCCP, an agent that discharge the across membrane electrochemical gradient, allow the detection of maximal respiration rates. Finally, a mixture of complex I and complex III inhibitors, rotenone and antimycin respectively, completely shuts down the electron transfer chain and reveals the non-mitochondrial oxygen consumption. Fig 11 shows a representative mitochondrial respiration experiment with the XF analyzer.
22
Figure 11 – Typical experiment to measure cellular mitochondrial respiration (from www.seahorsebio.com)
By varying substrate composition in assay medium, it is possible to investigate the various contribution of each substrate to cell metabolism. For example, in order to study FAO the assay medium is supplemented with BSA-conjugated palmitate and L-carnitine [137]. The mitochondrial respiration experiment, conducted in this assay buffer, reveals the oxygen consumption only due to β-oxidation. In the same way, it is possible to measure glutamine contribution to cellular metabolism.
Seahorse XF analyzer has already been successfully applied in hematological malignancies, to investigate metabolic dependence [123, 138, 139] and in drug discovery [140-142]
23
1.4 Aim of the study
In recent decades a large number of studies have shown that genetic alterations acquired by tumors deeply reprogram basal metabolism, allowing these cells to acquire proliferative advantages, combining the energy demands of growth with the biosynthetic needs imposed by proliferation, and to significantly increase the cell survival even in adverse environmental conditions.
Initially described by the German scientist Otto Warburg, these alterations in cancer cells induce a purely glycolytic metabolic phenotype through increasing at both transcriptional and protein level the expression and the activity of enzymes involved in the glucose catabolism. At the same time, this metabolic program is able to strongly reduce the oxidative processes of tumor cells deflecting the normal carbon fluxes from the catabolic pathways to those biosynthetic. This effect appears as a result of the reduction of the expression and/or activity of mitochondrial enzymes, or following the expression of specific isoforms, differently regulated than those expressed in healthy cells. In addition, in certain tumor contexts amino acids such as glutamine or lipids such as FA are metabolized intensively for energetic and biosynthetic purposes, thus participating in the growth, proliferation and survival of cancer cells. In other tumor models (e.g. breast cancer, pancreatic tumors, glioblastoma, and acute leukemias) the metabolic program described above is associated with the use of β-oxidation process for energy purposes. The fatty acid oxidation in these cells may in fact represent an alternative source of carbon, capable of maintaining the Krebs cycle and other mitochondrial oxidative metabolism fully functional. Thus, the purpose of this work is to investigate the therapeutic potential of a metabolism-targeted approach, aimed at the three main catabolic pathways (glycolysis, glutaminolysis, and fatty acid oxidation) in leukemia models.
To this end we evaluated the effect of three specific inhibitors: i) Dichloroacetate, an agent able to reverse the Warburg effect and restore an oxidative phenotype; ii) Aminooxyacetate, a transaminase inhibitor that interfere with the glutaminolytic process; iii) ST1326, a FAO inhibitor that selectively and reversibly targets CPT1a, the key enzyme of this process.
The effects induced by the aforementioned compounds have been investigated with both traditional/functional approach (cell counts, flow cytometry) and cutting-edge technology (Seahorse XF Analyzer), in order to elucidate the mechanisms behind the action of these metabolic inhibitors on cell lines and primary samples from hematological malignancies.
24
Chapter II
Targeting glycolysis in AML cells: Dichloroacetate
2.1 Introduction
As reported by Chen and colleagues, AML cells actively uses aerobic glycolysis in order to produce the energy needed for survival and proliferation [59]. Thus, we chose to target this process with a metabolic modulator, the dichloroacetate (DCA).
Fig 12 – Chemical structure of DCA (from [143])
DCA is a pyruvate-mimetic molecule, which acts as pyruvate dehydrogenase kinase (PDHK) inhibitor, thus activating pyruvate dehydrogenase (PDH) [144]. DCA binds a site located in the N-terminal domain of PDHK, promoting a conformational change that inactivates this kinase [143].Thus, pyruvate derived from glucose catabolism is no longer diverted towards lactic acid generation, but it’s re-directed toward complete oxidation in mitochondrial TCA cycle. The net effect is the reversal of the Warburg effect, and a modulation of cell metabolism to adopt a more oxidative phenotype (fig. 13).
25
Figure 13 – DCA mechanism of action and metabolic repercussions (from [145])
For its action, dichloroacetate has been used to treat lactic acidosis in children [146], generally demonstrating a good tolerability and safety [147].
In the attempt to reverse Warburg effect, in 2007 Michelakis and colleagues reported that DCA induces a mitochondrial-dependent apoptosis in cancer cells [148]. Since then, DCA has been investigated in cancers with different origins: the anti-neoplastic effects of this molecule as single agent have been reported in glioblastoma [149], metastatic breast [150], endometrial [151], colorectal [152] and ovarian cancers [153]. Additionally, DCA has been shown to synergize with conventional chemotherapy [154-156] and with metformin [157, 158].
In hematological malignancies, the pro-apoptotic activity of DCA has been demonstrated in T-cell lymphoma [159], MM [160] and in chronic lymphocytic leukemia [161].
Chen and colleagues reported a DCA-induced apoptosis in a small panel of cell lines and in 3 primary samples of AML [59].
Here, we extend these observations, evaluating the effects of cell metabolism modulation, by DCA exposure, on a larger panel of AML cell lines and primary samples.
26
2.2 Materials
2.2.1 Reagents
DCA was purchased from Sigma-Aldrich (Gillingham, UK) and stored at +4°C until use.
2.2.2 Cell culture and primary samples
AML cell lines (HL60, KG1, MOLM-13, OCI-AML2, OCI-AML3, U937) were cultured under standard conditions (37°C in 5% CO2 humidified atmosphere), were harvested in log-phase growth for all experiments, and exposed for 24, 48, 72 hours to scalar concentrations of DCA (1 to 7.5mM). Normal mononuclear cells were obtained from peripheral blood (NPBLs) samples of volunteer donors. PB and/or bone marrow (BM) aspirates samples were obtained from 8 AML patients (Table 2), who provided written informed consent, in accordance with regulations and protocols sanctioned by the Human Subjects Committee of Helsinki and approved by the Institutional Review Board of the Sapienza University of Rome. Cells were suspended in complete medium to a starting concentration of 1.0x10⁶/mL and exposed to scalar concentration of DCA (1 to 7.5mM).
Following DCA exposure, cell lines and primary cells were evaluated for cell counts, viability, induction of apoptosis and ROS production
2.3 Methods
2.3.1 Apoptosis analysis
Induction of apoptosis was assessed by measuring Annexin V binding to externalized phosphatidylserine, as previously described. Briefly, cells were washed twice with PBS and resuspended in binding buffer (10 mM Hepes/NaOH pH 7.4, 140 mM NaCl, 2.5 mM CaCl2, Sigma Chemical Co.). FITC conjugated Annexin V (Roche Diagnostic Corp., Indianapolis, Indiana, USA) was added at a final concentration of 1μg/ml. The mixture was incubated at room temperature for 15 min in the dark prior to flow cytometry analysis. Membrane integrity was simultaneously assessed by PI (0.25μg/ml) exclusion.
2.3.2 ROS production
For the analysis of ROS content, cells were incubated with 4 µM dihydroethidium (DHE; Molecular Probes, Eugene, OR) for 15 minutes at 37°C. After incubation, the cells were analyzed
27
by flow cytometry. ROS production was evaluated at different time points after treatment, as indicated.
2.3.3 Real-time Metabolic Analysis
Basal and DCA-affected glycolytic and mitochondrial metabolism were measured by Seahorse XF24 Analyzer (Seahorse Bioscience, MA, USA). Briefly, XF24 plates were coated with Celltak (BD Bioscience) to ensure cell adherence, following manufacturer’s protocol. Cells were moved into minimal DMEM assay medium (Seahorse Bioscience, MA, USA), with no glucose, no glutamine, no phosphate buffer, added with 2mM glutamine (Euroclone, Milan, Italy) and adjusted to pH 7.35, then transferred in XF microplates (500k cells per well). Microplates were briefly centrifuged (1000 rpm, 5’) and then transferred in a CO2-free incubator.
For glycolysis rate experiments, drug injector ports in the disposable sensor-containing cartridge were loaded with glucose 100mM (Sigma Aldrich), dissolved in the assay medium, adjusted to pH 7.35, for a final concentration in the well of 10mM, in port A. Port B were loaded with oligomycin (Seahorse Bioscience, MA, USA), dissolved in assay medium, at concentration of 10µM, for a final concentration in the well of 1µM. Port C were loaded with 2-DG 1M (Seahorse Bioscience, MA, USA), dissolved in assay medium, adjusted to pH 7.35, for a final concentration in the well of 100mM. After a 30’ equilibration in a CO2-free incubator, cartridges were inserted into the XF analyzer for the calibration step. After calibration, cell-containing plates were moved in the XF analyzer. The experiments were composed of: a) three cycles of measurements, b) injection of glucose (port A), c) three cycles of measurements, d) injection of oligomycin (port B), e) 3 cycles of measurements, f) injection of 2-DG (port C), g) 3 cycles of measurements.
For DCA experiments, drug injector ports in the disposable sensor-containing cartridge were loaded with glucose 100mM (Sigma Aldrich), dissolved in the assay medium, adjusted to pH 7.35, for a final concentration in the well of 10mM, in port A. Port B were loaded with DCA, dissolved in assay medium, adjusted to pH 7.35, at concentration of 50 and 100mM, for a final concentration in the well of 5 and 10mM, respectively. After a 30’ equilibration in a CO2-free incubator, cartridges were inserted into the XF analyzer for the calibration step. After calibration, cell-containing plates were moved in the XF analyzer. The experiments were composed of: a) three cycles of measurements, b) injection of glucose (port A), c) three cycles of measurements, d) injection of DCA or vehicle (port B), e) 6 cycles of measurements.
For mitochondrial repiration experiments, drug injector ports in the disposable sensor-containing cartridge were loaded with oligomycin 10µM (Sigma Aldrich), dissolved in the assay medium, adjusted to pH 7.35, for a final concentration in the well of 1µM, in port A. Port B were
28
loaded with FCCP 2µM, dissolved in assay medium, adjusted to pH 7.35, for a final concentration in the well of 0.2µM. Port C were loaded with Antimycin A (10µM) and Rotenone (10µM), dissolved in assay medium, adjusted to pH 7.35, for a final concentration in the well of 1µM for both compounds. After a 30’ equilibration in a CO2-free incubator, cartridges were inserted into the XF analyzer for the calibration step. After calibration, cell-containing plates were moved in the XF analyzer. The experiments were composed of: a) three cycles of measurements, b) injection of Oligomycin (port A), c) three cycles of measurements, d) injection of FCCP (port B), e) 3 cycles of measurements, f) injection of Antimycin and Rotenone (port C), g) 3 cycles of measurements. Cell viability after XF experiments were assessed by Trypan Blue exclusion. When needed, data from XF analyzer were normalized for cell counts.
2.3.4 Data analysis and statistics
For all in vitro results, at least three independent experiments were performed to determine mean and SD values. IC50s were calculated using the CalcuSyn software (Biosoft, Cambridge, MA) based on the number of Annexin V positive cells at 72h. Statistical comparisons were performed using the paired Student’s t test.
2.4 Results & Discussion
First, we investigated the glucose metabolism in AML cell lines, by using the XF Analyzer. All cell lines tested showed remarkably higher rate of lactate excretion than NPBLs: for example, MOLM13 showed a 4.6 fold increase in glycolytic rates when compared to NPBLs [18.9±2.6 vs. 4.1±0.2 (mpH/min) 106cells, respectively, p<0.001] (fig 14).
29
Figure 14 – AML cell line show higher rate of glutaminolysis compared to NPBLs. Glycolytic levels of
NPBLs and Molm13 were determined in real time with the Seahorse XF analyzer, as indicated in the method section.
Then, we assessed DCA effects on leukemia cell metabolism. The injection of DCA (5mM, fig.16) on U937 cells caused a temporary dose-dependent drop in lactate production (-36.5%, p=0.0014, compared to vehicle), followed by a rapid recovery in ECAR value, returning to control levels after 30 minutes of exposure (fig. 15a). On the other hand, mitochondrial respiration was positively affected: DCA induced an increase in O2 consumption (45%, p=0.014, compared to vehicle) (fig. 15b). These enhanced mitochondrial respiration remained stable throughout the entire experiments (120 mins).
30
Figure 15 – DCA induces a metabolic shift in AML cells. Real time metabolic measurement was conducted
on U937, as described in the method section. Data from the same experiment show: a) glycolytic rate and b) mitochondrial respiration rate, obtained by the Seahorse XF analyzer, before and after the injection of
glucose and DCA.
To confirm this mitochondrial metabolism enhancement, we evaluated the effects on mitochondrial respiration after 1 hour of DCA (10mM) exposure, compared to glycolysis inhibitor 2DG (10mM) (fig.17). As mentioned, 2-DG is a “canonical” glycolysis inhibitor, a glucose analog that cannot be metabolized, blocking the activity of hexokinase. The comparison has been made to exclude a compensatory effect, i.e. an upregulation of oxidative phosphorylation to face the reduced energy income from glycolysis. Indeed, 2DG showed little activity on mitochondrial metabolism, indicating that AML cells do not compensate a reduced glycolysis with an increased OXPHOS. On the contrary, DCA was able to significantly enhance both basal and maximal respiration rate (measured after the injection of an electron chain accelerator, FCCP) (fig. 16). These data are in line with the reported DCA mode of action [144], with a shift toward a more oxidative and less glycolytic metabolism by cells when exposed to this molecule.
31
Figure 16 – DCA mediates a reversal of Warburg effect. U937 cell lines were exposed for 1h to DCA or
2DG. Mitochondrial respiration was measured through the Seahorse XF Analyzer, as described in the methods section.
We then tested the long-term effects of DCA exposure on AML cell lines (HL60, KG1, MOLM-13, OCI-AML2, OCI-AML3, U937). In all lines, DCA induced a reduction of cell growth in a dose- and time-dependent fashion, as indicated in fig 17.
Cell growth reduction was associated with apoptosis, as confirmed by Annexin V analysis (fig 18). While U937 appeared to be the most sensitive (72h IC50=2.62mM), two cell lines, HL60 and OCI-AML2, proved resistant to this compound (table 1).
32
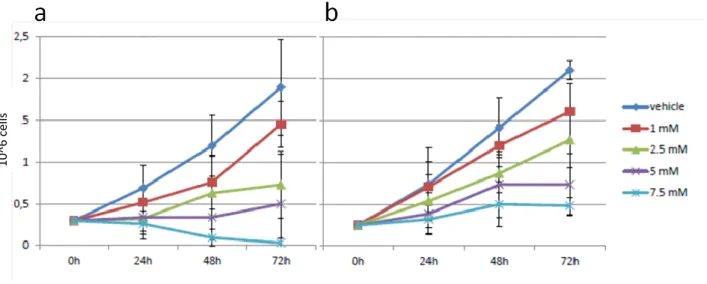
Figure 17 - DCA induces a reduction in AML cell proliferation: MOLM13 (a) and HL60 (b) cell line were
exposed to the indicated concentrations of DCA. Cell counts and viability were assessed at the times indicated by Trypan blue exclusion counting.
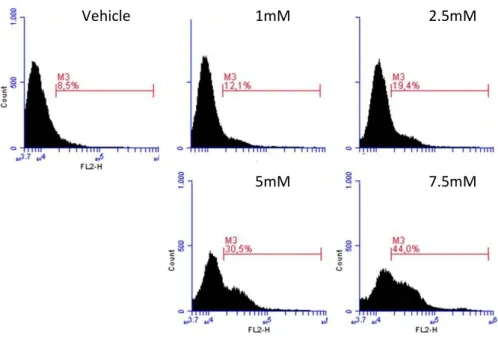
Figure 18 – DCA exerts a dose- and time-dependent pro-apoptotic effect on AML cell lines. MOLM13 (a)
and HL60 (b) cells were exposed to the indicated concentrations of DCA. Apoptosis induction was assessed by Annexin V/PI staining (see “Material and Methods” section). Percentage of Annexin V positive cells are
shown in the figure.
10^ 6 c el ls A n n V c el ls
33
Table 1 – DCA induces apoptosis in AML cell lines. IC50 was calculated after 72h of DCA exposure
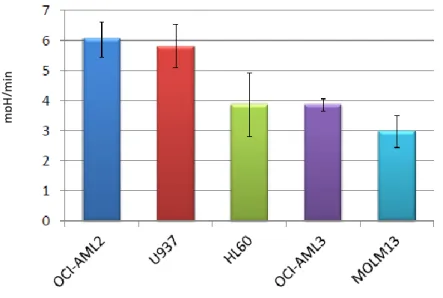
We found no correlation between basal cell line glycolytic rates and DCA sensitivity (fig 19). Thus, we suggest that this heterogeneous effect may be probably related to an inability by the sensitive cell lines to cope with the shift toward a more oxidative metabolism.
Figure 19 – DCA effect has no correlation with the glycolytic rate. Maximal glycolytic rates of AML cell
line panel were measured by Seahorse XF Analyzer as described in the method section.
It has been suggested that DCA exerts pro-apoptotic effect through ROS accumulation [162, 163]. To confirm this evidences, we evaluated ROS production in cell lines after 24h of DCA (1-7.5mM) exposure by DHE staining. At 24h, percentage of DHE-positive U937 cells exposed to
mp
H
34
DCA increased from 9.2±1.7% (vehicle) to 12.6±0.5% (1mM, p=0.002), 20.3±4.5% (2.5mM, p=0.043), 30.2±5.2% (5mM, p=0.018) and 39.6±4.7% (7.5mM, p=0.011) (fig. 20). This observation partially supports our hypothesis of a leukemia cell subset that cannot sustain high rate of oxidative phosphorylation.
Figure 20 – DCA acts through a dose-dependent ROS over-production. U937 were grown in the absence or presence of scalar concentrations of DCA for 24h. ROS levels were determined at 24h by monitoring
DHE uptake (see methods).
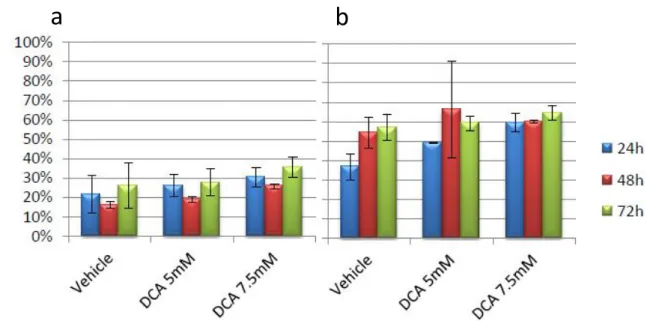
DCA is reported to be well tolerated in subjects with metabolic diseases, even in long-term administration [164]. In order to confirm DCA safety on our normal controls, we exposed NPBLs to DCA 5 and 7.5mM for up to 72h. No significant effects were observed on both normal and activated NPBLs: at 72h, Annexin V positive cells ranged from 26.2±11.9% (vehicle), to 27.8±7% (5mM) and 35,5±5,3% (7.5mM) for NPBLs (p>0.05) (suppl.fig.2a); and from 57±6.7% (vehicle), to 59.1±3.8% (5mM) and 64.4±3.8% (7.5mM) for PHA-activated NPBLs (p>0.05) (Fig. 21a,b).
Vehicle 1mM 2.5mM
7.5mM 5mM
35
Figure 21 – DCA has no effects on NPBLs. Normal (a) and activated (b) NPBLs were incubated with DCA for
up to 72 hours. Apoptosis induction was assessed by Annexin V/PI staining (see “Material and Methods” section). Percentage of Annexin V-positive cells is shown in the figure.
Finally, we investigated the effects of DCA exposure (1-7.5mM) on primary blasts from 8 patients (table 2). Cell growth reduction and induction of apoptosis were observed: after 72h of exposure to scalar concentration of DCA, Annexin V positive cells ranged from 21.1±9.4% (vehicle) to 33.6%±15,3% (1mM, p=0.044), 44.9±19,9% (2,5mM, p=0.0046), 61.2±25.7% (5mM, p<0.001), 69.7±19.1% (7,5mM, p<0.001) (fig.22).
pt #
Sex
BM Blasts (%)
FAB
1
F
100
-
2
M
90
M1/M2
3
M
80
M1
4
M
64
M2
5
M
99
M2
6
F
90
M5
7
M
90
M5
8
F
100
M1
Table 2 – Patient Population
a
b
A n n V c el ls36
Figure 22 – DCA induces a dose-dependent apoptosis in AML primary cells. AML primary cells were
exposed to the indicated concentrations of DCA for 72h. Apoptosis induction was assessed by Annexin V/PI staining (see Methods section). Percentage of Annexin V-positive cells is shown in the figure.
In agreement with results obtained by Chen and colleagues [59] indicating a DCA-induced anti-neoplastic effect in AML cells, our analysis confirm the effectiveness of this agent in inducing cell growth reduction and apoptosis induction on these cells. Moreover, concentrations used were sufficient to modulate cellular glycolysis in our model, forcing leukemic cells to adopt a more oxidative metabolism. The shift to the oxidative phenotype is not sustainable by these cells, as suggested by the accumulation of intracellular ROS briefly after DCA exposure. Thus, together with results obtained in MM and CLL [160, 161], these evidences underline the promising role for DCA in modulating cell metabolism in hematologic malignancies, prompting further studies about its possible clinical role in conjunction with standard chemotherapy.
A n n V c el ls
37
Chapter III
Targeting glutaminolysis in AML cells: Aminooxyacetate
3.1 Introduction
Glutamine deprivation has been demonstrated to induce cell growth reduction and apoptosis on AML cells. Thus, we targeted this process, by using a chemical inhibitor of cellular transaminases, Aminooxyacetic Acid (AOA) [165]. Among this class of enzymes, glutamate-dependent transaminases contribute to glutaminolysis by converting glutamate into the TCA cycle intermediate α-ketoglutarate [166].
Figure 23 – Chemical structure of AOA (from www.sigma-aldrich.com)
AOA proved particularly effective in inhibiting glutaminolysis, as shown by Wise and colleagues in an important work about the role of c-Myc in driving glutamine catabolism in cancer cells [167]. Using c-Myc transfected fibroblast, they demonstrated that AOA is able to selectively induce apoptosis in glutamine-addicted Myc-expressing cells [167]. To further demonstrate AOA specificity, they observed that the addition of α-ketoglutarate, the final product of glutamate-dependent transaminases, fully prevented AOA-induced apoptosis [167].
38
Figure 24 - AOA inhibition of glutaminolysis
Thornburg and colleagues reported an AOA-induced reduction of cell proliferation, in cell lines and in xenograft murine models of breast cancer, through mitochondrial metabolism impairment [168]. Moreover, Qin and colleagues reported a sensitivity of melanoma cells to AOA, particularly when combined with death receptor ligands [169]. Additionally, a similar AOA pro-apoptotic activity, through reduction of cellular respiration, has been reported in osteosarcoma [170].
These results, along with the pronounced glutamine addiction of cancer cells, prompted us to investigate the effect of glutaminolysis inhibition, by AOA exposure, in AML cells.
3.2 Materials
3.2.1 Reagents
AOA was purchased from Sigma-Aldrich (Gillingham, UK). The compound was stored as dry powder at 0-4°C and dissolved in PBS immediately before use.
39
3.2.2 Cell culture and primary samples
AML cell lines (HL60, MOLM-13, OCI-AML2, OCI-AML3, U937) were cultured under standard conditions (37°C in 5% CO2 humidified atmosphere), were harvested in log-phase growth for all experiments, and exposed for 24, 48, 72 hours to scalar concentrations of AOA (from 100 to 1000µM).
Normal mononuclear cells were obtained from peripheral blood (NPBLs) samples of volunteer donors. PB and/or bone marrow (BM) aspirates samples were obtained from 8 AML patients (Table 2), who provided written informed consent, in accordance with regulations and protocols sanctioned by the Human Subjects Committee of Helsinki and approved by the Institutional Review Board of the Sapienza University of Rome. Cells were suspended in complete medium to a starting concentration of 1.0x10⁶/mL and exposed to scalar concentration of AOA (100 to 1000µM).
Following AOA exposure, cell lines and primary cells were evaluated for cell counts, viability, and induction of apoptosis as reported in Chapter II.
3.3 Methods
3.3.1 Glutaminolytic Rates
Ammonia is the byproduct of the transamination reaction that converts glutamate in α-ketoglutarate. Once produced, it is rapidly excreted in the extracellular environment [28]. Glutaminolysis rates in cell lines and NPBLs, resting or PHA-activated, were detected by measuring ammonia levels in culture medium, as reported in literature [101]. Briefly, cells were centrifuged (1200 rpm, 5’), the supernatant were collected, and stored at -20°C until analysis. Ammonia levels were measured through Ammonia Colorimetric Assay Kit (Biovision, CA, USA), following manufacturer’s instruction.
3.4 Results & Discussion
First, we measured glutaminolytic rates of AML cell lines, compared to NPBLs. After 24h, the ammonia level in cell line medium were significantly (p<0.05) higher than both normal and activated NPBLs (fig.25): OCI-AML3 excreted 3 times more ammonia compared to normal NPBLs (p=0.02), thus confirming a sustained glutaminolytic rate in our models.
40
Figure 25 - AML cell line show higher rate of glutaminolysis compared to NPBLs. Normal or activated
NPBLs, OCI-AML3 and U937 were cultured for 24h. NH4 levels on culture medium were determined as indicated in the method section.
We then measured ammonia levels after 24h of AOA exposure. In OCI-AML3 cells, we found a trend toward a dose-dependent inhibition of glutaminolysis, although not statistically significant (Fig 26). Minor effects were seen in AOA-exposed normal or activated NPBLs (fig 27a, b).
Figure 26 – AOA inhibits glutaminolysis in AML cell lines. OCI-AML3 cells were exposed to the indicated
concentrations of AOA for 24h. NH4 levels on culture medium were determined as indicated in the method section. 6 11 16 21 26 31 36 41 N H 4 ( m M /10 6 c e lls) 0 2 4 6 8 10 12 NH 4 (m M )
41
Figure 27 – AOA exposure induces only minor effects on NPBLs’ glutaminolytic rate. Resting (a) or
PHA-activated (b) NPBLs were exposed to the indicated concentrations of AOA for 24h. NH4 levels on culture medium were determined as indicated in the method section.
Moreover, we evaluated the effect of long-term AOA exposure on cell growth. All cell lines tested showed a marked sensitivity to this compound, with a dose- and time-dependent reduction of cell count (fig. 28)
Figure 28 - AOA induces a dose- and time-dependent cell growth reduction on AML cell lines. OCI-AML2
(a) and MOLM13 (b) were exposed to the indicated concentrations of AOA. Cell counts and viability were assessed at the times indicated by Trypan blue exclusion counting.
10^
6
ce
42
The AOA-induced cell growth reduction was associated to an apoptotic process, as demonstrated from Annexin V analysis (fig 29). Table 3 reports the IC50, calculated after 72h of AOA exposure, for our cell line panel, with OCI-AML3 being the most sensitive (136.9µM) and HL60 the least (978,6µM). This HL60 mild sensitivity to AOA, together with the resistance to glycolysis modulator DCA, suggests that this leukemia model has a peculiar metabolism, that diverge from the other cell lines tested, confirming previous observation from other groups [101].
Figure 29 – AOA exerts a dose- and time-dependent pro-apoptotic effect on AML cell lines. OCI-AML3 (a)
and HL60 (b) cells were exposed to the indicated concentrations of AOA. Apoptosis induction was assessed by Annexin V/PI staining (see “Material and Methods” section). Percentage of Annexin V-positive
cells is shown in the figure.
Cell Line
IC50
U937 270,7 uM
OCI-AML3 136,9 uM
HL60 978,6 uM
MOLM13 268,1 uM
Table 3 - AOA induces apoptosis in AML cell lines. IC50 was calculated after 72h of DCA exposure
A n n V c el ls
43
To evaluate the effects of this inhibitor on normal cells, we exposed normal and activated NPBLs to scalar concentrations of AOA. Results obtained demonstrated that AOA did not exert pro-apoptotic effect in NPBLs (fig. 30).
Figure 30 – AOA shows no effects on NPBLs. Normal (a) and activated (b) NPBLs were incubated with AOA
for up to 72 hours. Apoptosis induction was assessed by Annexin V/PI staining (see “Material and Methods” section). Percentage of Annexin V-positive cells is shown in the figure.
Finally, we evaluated the effect of AOA exposure on primary blasts from 8 AML p
![Figure 4 – Impact of 2-hydroxyglutarate on cellular processes (from [80])](https://thumb-ap.123doks.com/thumbv2/123dok/1437223.2533551/13.892.136.780.479.952/figure-impact-of-hydroxyglutarate-on-cellular-processes-from.webp)