IDENTIFICATION OF SINGLE NUCLEOTIDE POLYMORPHISMS ON CATTLE
BREEDS IN INDONESIA USING BOVINE 50K
Identifikasi
Single Nucleotide Polymorphisms
pada Bangsa Sapi di Indonesia
Menggunakan
Bovine 50K
Puji Lestaria*, Habib Rijzaania, Dani Satyawana, Anneke Anggraenib, Dwinita W. Utamia, Ida Rosdiantia,
Muchamad Lutfic and I Made Tasmaa
aIndonesian Center for Agricultural Biotechnology and Genetic Resources Research and Development
Indonesian Agency for Agricultural Research and Development Jalan Tentara Pelajar No. 3A, Bogor 16111, West Java, Indonesia
Phone +62 251 8337975, Fax. +62 251 8338820, E-mail: [email protected]
bIndonesian Research Institute for Animal Production
Jalan Veteran III Ciawi, Bogor 16002, West Java, Indonesia
Phone +62 251 8240752, Fax. +62 251 8240754, E-mail: [email protected]
cBeef Cattle Research Station
Jalan Pahlawan 2 Grati, Pasuruan 67184, East Java, Indonesia
Phone +62 343 481131 Fax. +62 343 481132, E-mail: [email protected] *Corresponding author: [email protected]
Submitted 31 December 2014; Revised 13 July 2015; Accepted 24 July 2015
ABSTRACT
Single nucleotide polymorphisms (SNPs) abundant in bovine genome influence genetic variation in biological mechanism. The study aimed to identify SNPs on Indonesian cattle breeds and analyze their genetic diversity using Bovine 50K SNP chip. Twenty eight "Ongole Grade" (OG) beef cattle and 20 "Holstein Friesian" (HF) dairy cattle were used for the Infinium II assay test. This assay included amplification of genomic DNA, fragmenta-tion, precipitafragmenta-tion, resuspension, hybridizafragmenta-tion, processing bead chip for single-base extension, and imaging at iScan. Data and clusters were analyzed using GenomeStudio software. The Bovine 50K SNP chip containing 54,609 SNPs was observed spanning all chromosomes of bovine genome. Genotyping for the total SNPs was successfull based on Call Rate, GeneCall and GeneTrain scores. Most SNP markers had alleles that shared among the individuals or breeds, or had specific alleles at distinctive frequencies. Minor allele frequency (MAF) spreads equally with intervals of 0-0.5. The breeds of OG and HF tended to be separated in different clusters without considering their genetic history and twin or normal. This result suggests that most individuals are closely related to one another, regardless of the same breed. Some genes identified on chromosomes 3, 4, 5, 7, 13, 17 and 18 were located in the loci/regions that contained SNPs with specific alleles of either HF or OG breed. These SNPs were more powerful for differentiation of beef cattle and dairy cattle than among individuals in the same breed. These SNP variations and genetic relatedness among individuals and breeds serve basic information for cattle breeding in Indonesia.
[Keywords: Beef cattle, dairy cattle, Bovine 50K, SNP, Indonesia]
ABSTRAK
Single nucleotide polymorphisms (SNPs) yang melimpah dalam genom sapi berpengaruh terhadap variasi genetik dalam mekanisme biologi. Penelitian ini bertujuan untuk mengidentifikasi SNP pada sapi di Indonesia dan menganalisis keragaman genetiknya menggunakan Bovine 50K SNP chip. Dua puluh delapan ekor sapi potong Peranakan Ongole (PO) dan 20 ekor sapi perah Friesian Holstein (FH) digunakan untuk uji Infinium II menggunakan Bovine 50K SNP chip. Proses analisis meliputi amplifikasi DNA genom, fragmentasi, presipitasi, resuspensi, hibridisasi, pemrosesan bead chip untuk reaksi single-base extension, dan imaging pada iScan. Data dan klaster dianalisis menggunakan perangkat lunak GenomeStudio. Chip yang mengandung 54.609 SNP diobservasi yang mencakup semua kromosom pada genom sapi. Analisis genotyping total SNP ber-dasarkan Call Rate, GeneCall, dan skor GeneTrain menunjukkan keberhasilan genotyping. Mayoritas marka SNP memiliki alel yang umum di antara individu atau bangsa sapi, atau memiliki alel spesifik dengan frekuensi yang berbeda. Nilai minor allele frequency
(MAF) tersebar merata pada selang nilai 0-0,5. Sapi potong PO dan sapi perah FH terpisah dengan jelas dalam klaster yang berbeda tanpa mempertimbangkan sejarah genetiknya maupun kembar atau normal. Hasil ini menunjukkan kedekatan antarindividu karena kesamaan bangsa sapi. Beberapa gen yang diidentifikasi pada kromosom 3, 4, 5, 7, 13, 17, dan 18 terletak dalam lokus/daerah yang mengandung SNP dengan alel spesifik pada sapi FH atau PO, SNP tersebut lebih berguna untuk membedakan antara sapi potong dan sapi perah, daripada antara individu dalam rumpun yang sama. Variasi SNP dan keterkaitan genetik antarindividu dan bangsa sapi tersebut bermanfaat sebagai informasi dasar dalam pemuliaan sapi di Indonesia.
INTRODUCTION
Referring to the category of cattle worldwide, beef cattle and dairy cattle are the most cattle farms existing in Indonesia. Beef cattle are great important in Indonesia because of their economic and socio-cultural values. In addition to beef cattle, dairy cattle farms also have a potential role in increasing farmers' income and livestock development. In addition to meat and milk, both cattle breeds produce organic fertilizer and increase the use of agricultural waste biomass (Thohari 2000; Aryogi and Romjali 2009). Thus, cattle development has a strategic value to achieve food security in parallel with growing population in Indonesia.
The diverse geographical areas with different climate, environmental conditions and local socio-culture influence high diversity of cattle germplasm with distinctive morpho-physiological characteristics. The high diversity of cattle is useful for farms development since the genetic materials are needed to develop new breed with high productivity and other interest characters (Diwyanto 2005).
Cattle "Ongole Grade" (OG) belonging to species
Bos indicus and sub-family Bovinae are commonly found in Java and other regions in Indonesia. This OG is relatively pure its genetic, but has experienced adaptation in Indonesia. This cattle breed is highly desirable by farmers as it is profitable, and easy and low cost in maintenance. While "Holstein Friesian" (HF), a dairy cattle breed from Bos taurus originated from Holland, has a high productivity of milk. HF could be used as genetic material in dairy cattle breeding program to increase milk production (Aryogi and Romjali 2009; Prahanisa et al. 2011). Considerable potency of cattle population leads to investigation of relatedness and genetic diversity using molecular characterization as basic information for future breeding program.
Molecular markers in cattle have been applied on several target characters. The characters are not only related to growth and productivity of meat and milk, but also disease resistance, fertility and environmental stress tolerance (Singh et al. 2014). On the basis of detection techniques, molecular markers are categorized into hybridization-based and PCR-based markers in cattle genetic research. The PCR-based markers are divided into sequenced-targeted PCR assay and arbitrary PCR assay. The former categories include cleaved amplified polymorphic sequence, alleles specific PCR, PCR amplification of specific alleles, simple sequence length polymorphism, and sequence-targeted microsatellite site. And, arbitrary
PCR assays are such as RAPD and microsatellite-primed PCR. Microsatellites/simple sequence repeat (SSR) markers are popular in genetic characterization on cattle due to their easy application and high variation (Sunnucks 2001; Deb et al. 2013).
Single nucleotide polymorphisms (SNPs), a bi-allelic type of marker, become popular because of many advantages. Compared to other genomic variation, SNPs are the most abundant known so far in animal. The SNPs could be a potential genetic marker and get a higher interest because of the stability and high-throughput automated analysis (Fries et al. 1990; Heaton et al. 2002). To complement the development of molecular markers on the basis of single or few loci, high throughput genotyping via next generation sequencing (NGS) in the form of array or chip-based markers is more useful. Such markers could be used for a variety of purposes including genome-wide association studies, population studies, bulk segre-gant analyses, quantitative trait loci (QTL) interval mapping, whole genome profiling, background screening, etc. (Kim et al. 2006; Wenzl et al. 2007; Gupta et al. 2008).
In cattle, genomic evaluation was initiated and available years ago. The first generation bead chip with low density, Bovine 3K bead chip, was introduced to increase the adoption of genomic testing in 2010 (Illumina Inc. 2011a; Wiggans et al. 2011). In addition, the high density bead chip called as Bovine 50K SNP from Illumina was commercialized. Unlike Bovine 3K, Bovine 50K SNP chip (Infinium) was available with more than 50,000 informative SNPs that uniformly span the entire bovine genome. Rapid detection of Bovine 50K chip was evidenced by the number of new individuals tested (Illumina Inc. 2011b;Wiggans et al. 2011).
The Bovine 50K chip has been used for many studies and assists selection in cattle breeding program in other countries. However, so far, no study reported bovine genomic evaluation in Indonesian cattle population/breed using the high throughput technology. This study aimed to identify SNP on cattle breeds in Indonesia and to analyze their genetic diversity using Bovine 50K SNP chip with iScan.
MATERIALS AND METHODS
Individual Materials
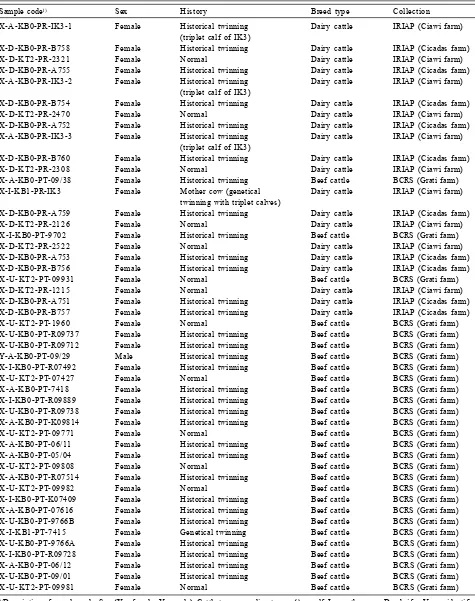
cattle breeds were obtained from the collection of Beef Cattle Research Station (BCRS) and Indonesian Research Institute for Animal Production (IRIAP), respectively. Both the research institutes are under the Indonesian Agency for Agricultural Research and Development (IAARD). Most individuals were female accounting for 97.9% of total. According to historical aspect but not genetically, most of the cattle used were considered as twinning, and only 13 individuals were being as normal cattle for comparison of analysis. The age of cattle ranged diversely including calf, heifer and mother cows. In this study, all individuals were fed and maintained following the standard recommendation management. The list of all individuals of cattle along with the detailed information is presented in Table 1.
Isolation and Concentrating of DNA
For DNA isolation, cattle blood was collected using sterile needles and syringe, and then put in a 10 ml specific tube. The blood was kept in ethanol and stored in freezer (-80°C) until used. DNA isolation was done with QIAmp DNA blood mini kit (Qiagen) following the protocol from the biotechnological company. The DNA was eluted with TE buffer and migrated on 0.8% agarose gel electrophoresis. DNA concentration and purity were estimated by measuring the absorbance at 260/280 and 260/230 using NanoDrop1000. The DNA concentration was adjusted to 50 ng µl-1 as recommended for iScan
analysis by concentrating it with SpeedVac (Thermoscientific). The pure genomic DNA was stored and prepared at least 15 µl to meet the requirement for Infinium II assay.
SNP Genotyping Using Illumina Bovine 50K SNP Chip
All cattle breeds were genome-wide genotyped with Infinium II assay using Bovine 50K SNP chip (Illumina Inc., San Diego) which comprises SNPs covering the bovine genome (Matukumalli et al. 2009; VanRaden et al. 2009). Approximately 200 ng of genomic DNA of each individual was used for the assay and samples were processed according to the Illumina Infinium-II assay manual. Briefly, each sample was whole-genome amplified, fragmented, precipitated and re-suspended in an appropriate hybridization buffer. Denatured samples were hybridized on the prepared BovineSNP50 chip for a
minimum of 16 hours at 48°C. Finally, the bead chips were processed for the single-base extension reaction, stained and imaged on an Illumina iScan array.
Normalized bead intensity data for each sample were loaded into the GenomeStudio V2009.1 software facilitated by Illumina, which converted fluorescent intensities into SNP genotypes. SNP clusters for genotype calling were examined for all SNPs. SNP was identified based on the following criteria: (1) the number of genotype group, i.e. one or none (e.g. only AA genotype and no AB or BB), (2) the minor allele frequency (MAF), and (3) proportion of genotyped individuals based on Call Rate, GeneTrain score cutoff of 0.25 and 50% GeneCall (GC50) applied to the whole dataset. Thus, the overall genotyping reliability for the total SNPs was assessed by estimating SNP counts above conventionally used threshold and average values for Call Rate, GC50 and GeneTrain scores. These measures provide some general information about quality and performance of SNPs (Illumina Inc. 2011a; Grattapaglia et al. 2011). Clustering heat map and related SNP analyses were performed with GenomeStudio. The heatmap was generated based on euclidean distance, of which the variables measure were analyzed automatically for clustering.
RESULTS AND DISCUSSION
Performance and Quality of SNP
Table 1. List of individuals of cattle coordinated by research institutes under IAARD for Infinium II assay of Bovine 50K bead chip using iScan array.
Sample code1) Sex History Breed type Collection
X-A-KB0-PR-IK3-1 Female Historical twinning Dairy cattle IRIAP (Ciawi farm)
(triplet calf of IK3)
X-D-KB0-PR-B758 Female Historical twinning Dairy cattle IRIAP (Cicadas farm)
X-D-KT2-PR-2321 Female Normal Dairy cattle IRIAP (Ciawi farm)
X-D-KB0-PR-A755 Female Historical twinning Dairy cattle IRIAP (Cicadas farm)
X-A-KB0-PR-IK3-2 Female Historical twinning Dairy cattle IRIAP (Ciawi farm)
(triplet calf of IK3)
X-D-KB0-PR-B754 Female Historical twinning Dairy cattle IRIAP (Cicadas farm)
X-D-KT2-PR-2470 Female Normal Dairy cattle IRIAP (Ciawi farm)
X-D-KB0-PR-A752 Female Historical twinning Dairy cattle IRIAP (Cicadas farm)
X-A-KB0-PR-IK3-3 Female Historical twinning Dairy cattle IRIAP (Ciawi farm)
(triplet calf of IK3)
X-D-KB0-PR-B760 Female Historical twinning Dairy cattle IRIAP (Cicadas farm)
X-D-KT2-PR-2308 Female Normal Dairy cattle IRIAP (Ciawi farm)
X-A-KB0-PT-09/38 Female Historical twinning Beef cattle BCRS (Grati farm)
X-I-KB1-PR-IK3 Female Mother cow (genetical Dairy cattle IRIAP (Ciawi farm)
twinning with triplet calves)
X-D-KB0-PR-A759 Female Historical twinning Dairy cattle IRIAP (Cicadas farm)
X-D-KT2-PR-2126 Female Normal Dairy cattle IRIAP (Ciawi farm)
X-I-KB0-PT-9702 Female Historical twinning Beef cattle BCRS (Grati farm)
X-D-KT2-PR-2522 Female Normal Dairy cattle IRIAP (Ciawi farm)
X-D-KB0-PR-A753 Female Historical twinning Dairy cattle IRIAP (Cicadas farm)
X-D-KB0-PR-B756 Female Historical twinning Dairy cattle IRIAP (Cicadas farm)
X-U-KT2-PT-09931 Female Normal Beef cattle BCRS (Grati farm)
X-D-KT2-PR-1215 Female Normal Dairy cattle IRIAP (Ciawi farm)
X-D-KB0-PR-A751 Female Historical twinning Dairy cattle IRIAP (Cicadas farm)
X-D-KB0-PR-B757 Female Historical twinning Dairy cattle IRIAP (Cicadas farm)
X-U-KT2-PT-1960 Female Normal Beef cattle BCRS (Grati farm)
X-U-KB0-PT-R09737 Female Historical twinning Beef cattle BCRS (Grati farm)
X-U-KB0-PT-R09712 Female Historical twinning Beef cattle BCRS (Grati farm)
Y-A-KB0-PT-09/29 Male Historical twinning Beef cattle BCRS (Grati farm)
X-I-KB0-PT-R07492 Female Historical twinning Beef cattle BCRS (Grati farm)
X-U-KT2-PT-07427 Female Normal Beef cattle BCRS (Grati farm)
X-A-KB0-PT-7418 Female Historical twinning Beef cattle BCRS (Grati farm)
X-I-KB0-PT-R09889 Female Historical twinning Beef cattle BCRS (Grati farm)
X-U-KB0-PT-R09738 Female Historical twinning Beef cattle BCRS (Grati farm)
X-A-KB0-PT-K09814 Female Historical twinning Beef cattle BCRS (Grati farm)
X-U-KT2-PT-09771 Female Normal Beef cattle BCRS (Grati farm)
X-A-KB0-PT-06/11 Female Historical twinning Beef cattle BCRS (Grati farm)
X-A-KB0-PT-05/04 Female Historical twinning Beef cattle BCRS (Grati farm)
X-U-KT2-PT-09808 Female Normal Beef cattle BCRS (Grati farm)
X-A-KB0-PT-R07514 Female Historical twinning Beef cattle BCRS (Grati farm)
X-U-KT2-PT-09982 Female Normal Beef cattle BCRS (Grati farm)
X-I-KB0-PT-K07409 Female Historical twinning Beef cattle BCRS (Grati farm)
X-A-KB0-PT-07616 Female Historical twinning Beef cattle BCRS (Grati farm)
X-U-KB0-PT-9766B Female Historical twinning Beef cattle BCRS (Grati farm)
X-I-KB1-PT-7415 Female Genetical twinning Beef cattle BCRS (Grati farm)
X-U-KB0-PT-9766A Female Historical twinning Beef cattle BCRS (Grati farm)
X-I-KB0-PT-R09728 Female Historical twinning Beef cattle BCRS (Grati farm)
X-A-KB0-PT-06/12 Female Historical twinning Beef cattle BCRS (Grati farm)
X-U-KB0-PT-09/01 Female Historical twinning Beef cattle BCRS (Grati farm)
X-U-KT2-PT-09981 Female Normal Beef cattle BCRS (Grati farm)
possessed GC50 and GenTrain scores near one and can be considered as sufficient quality to be correctly scored by the Illumina GenomeStudio genotyping software without manual intervention. The overall parameters for the 54,609 SNPs demonstrated the success of genotyping reliability of total cattle observed in this study.
SNP Distribution and Allele Frequency
The SNP existed in the Bovine 50K developed by Illumina showed their even distribution across 60 chromosomes of entire bovine genome, 29 pair of autosomes and one pair of sex chromosomes (X and Y). The number of SNPs per chromosome ranged from one (on chromosome Y) to almost 3,500 SNPs on chromosome 1 (Fig.2A). Tyler-Smith (2008) reported that as in other mammals, males have an X and a Y chromosome and females have 2x chromosomes, thus, only the autosome was used in this study. The total SNPs were found to have homology with several regions in bovine genome such as BTA, BTB, ARS-BFGL-NGS, UA-IFASA, and Hapmap-SCAFFOLD.
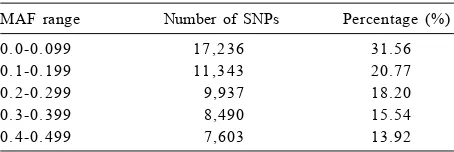
An even distribution of MAF was observed (Table 2) with rive continued classes from 0 to 0.5. A relatively similar number of SNPs was found in MAF
class of 0.3-0.399 (15.54%) and 0.4-0.5 (13.92%). The highest number of SNPs possessed MAF of less than 0.199 was 31.56% (17,236/54,609). Selected SNP markers with high MAF scores in this study could have a high impact and useful on genetic diversity analysis, given the great differentiating power that is in good agreement with previous study (Yan et al. 2010). The difference in allele frequencies may be attributable to divergence of the cattle breeds (Matukumalli et al. 2009; Dadi et al. 2012). In addition, information on the allelic frequencies of these SNPs should help determine the usefulness of this marker for analysis of other cattle breeds in Indonesia.
Particular emphasis was placed on SNP poly-morphism, of which for homozygous, one SNP (for example G/C) was able to produce two alleles (G and C). For 54,609 SNPs (with just one SNP per locus), a maximum total of 109,218 alleles can be detected. Of number SNPs surveyed, alleles of A/G (22,579/54,609 or 41%) seemed predominantly in the population and followed with T/C (34%). Alleles of A/C and T/G had a relatively similar proportion, accounting for 10% and 9%, respectively (Fig. 2B). While A/T and T/A were identified as minor alleles in the total of 48 individuals. Clearly, most SNP markers had alleles which were shared among the individuals and/or 0.1-0.199 0.2-0.299 0.3-0.399 0.4-0.499 0.5-0.599 0.6-0.699 0.7-0.799 0.8-0.899 0.9-0.999
GeneCall score 30,000
20,000
10,000
0 Number of
SNPs
Fig.1. Distribution of SNPs across classesobserved in 48 individuals of cattle using Infinium assay with Bovine 50K bead chip; (a) GeneCall50, (b) GenTrain.
a
0.3-0.399 0.4-0.499 0.5-0.599 0.6-0.699 0.7-0.799 0.8-0.899 0.9-0.999
GenTrain score Number of
SNPs
20,000 40,000
b
breeds, or had specific alleles at distinctive frequencies as demonstrated in this study. The major alleles produced by some markers could be specific in Indonesian cattle, leading allelic deviation in the breeds. Major alleles were also essentially equivalent to minor allelic frequency (MAF) in information content for differentiation of animals (Kruglyak 1997; Hasegawa et al. 2014). All SNPs common to both breeds probably arose before the divergence of the breeds. Importantly, the rare and minor alleles could influence economically important traits in livestock species (Freking et al. 2002; Smit et al. 2003).
Analysis of Cluster and Genetic Diversity of Cattle Breeds
Scoring of SNP among individuals using GenomeStudio generally produced three clusters denoting the AA homozygote, BB homozygote and AB heterozygote, but some of data dots ambiguously appeared between the clusters in the genoplot as depicted in Figure 3.
For examples, SNP in ARS-BFGL-NGS-18937 revealed AA genotype for a total of 48 individuals (Fig. 3A), in contrast, ARS-BFGL-NGS-10077 showed mostly BB genotype (Fig. 3B). While Hapmap 27796-BTA-21954 resulted three clusters which presented AA genotype (28 individuals), AB (14 individuals) and BB (6 individuals) (Fig. 3C). In respect to some SNPs showing only homozygote, they were predominated by BB genotype accounting the frequency of 0.458 and AA with 0.314 value in total of individuals observed. A few individuals contained heterozygotes with proportion of 0.228. This cluster separation as denoted by GenTrain score could explain the three classes’s separation (AA, AB and BB). In addition to represent SNP quality, the reliable classes’ pattern of the cattle breeds virtually reflected their genetic nature based on the stringent SNPs existing in Bovine 50K array. This powerful SNPs in this study is in good agreement with previous studies on BovineSNP50 Bead Chip for genotyping various breeds and species in the tribe Bovini (Bae et al. 2010; Michelizzi et al. 2011; Dadi et al. 2012).
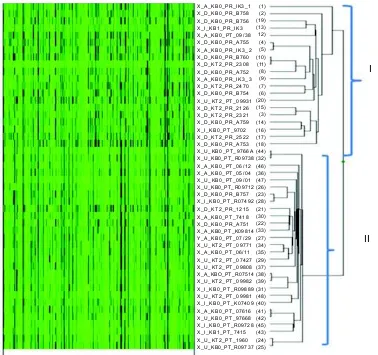
Genetic variation within or among breeds is usually explained in terms of allel frequencies. Figure 4 depicts heat map of the 48 individuals according to Bovine 50K SNP. Two main clades were generated and showed almost clear separation of different breeds, 20 individuals mostly HF (with exception of three OG namely X_A_KBO_PT_09/38, X_U_KT2_PT_09931 and X_I_KBO_PT_9702) in clade I and 28 individuals of OG belonging to the clade II. A few HF individuals, i.e. X_D_KBO_PR_B757, X_D_KT2_PR_1215, and X_D_KBO_PR_A751 that were preferentially grouped with most OG (clade II) demonstrated their close
[T/C] [A/C] [A/G] [C/G] [T/G] [A/T] [G/C] [T/A]
Table 2. SNPs with minor allele frequency (MAF) of 5% detected in 48 individuals of cattle.
MAF range Number of SNPs Percentage (%)
0.0-0.099 17,236 31.56
0.1-0.199 11,343 20.77
0.2-0.299 9,937 18.20
0.3-0.399 8,490 15.54
0.4-0.499 7,603 13.92
Fig.2. Distribution and proportion of SNPs for Infinium assay observed on cattle breeds in Indonesia; (a) Distribution of SNPs spanning on chromosomein Bovine 50K bead chip, (b) Proportion of SNPs observed in 48 individuals according to Bovine 50K.
5,863 (10%) 22,579 (41%)
19,038 (34%) 474 (0%) 559 (1%)
481 (0%) 4,954 (9%) 661 (1%)
b 4,000
3,500
3,000
2,500
2,000
1,500
1,000
5 0 0 Number of
S N P s
0 1 2 3 4 5 6 7 8 9 10 11 12 13 14 15 16 17 18 19 20 21 22 23 24 25 26 27 28 29 X Y
C h r o m o s o m e 0
Fig. 4. Cluster of 48 individuals of cattle based on Bovine 50K SNP chip generated with GenomeStudio; I = Mostly Ongole Grade (OG) breed, II = Mostly Holstein Friesian (HF) breed.
X_A_KB0_PR_IK3_1
Fig. 3. Examples of SNP genotyping clusters on 48 individuals of cattle observed based on Bovine 50K bead chip using BeadStudio software. (a) Homozygote allele AA, (b) homozygote allele BB, and (c) heterozygote allele AB.
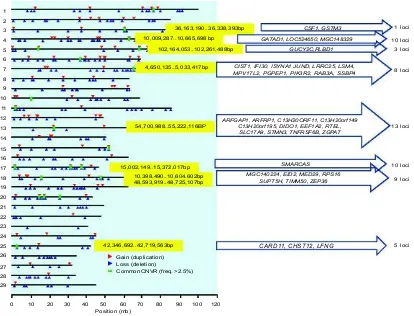
Fig. 5. Map of identified locations of copy number variations in Bos taurus coreanae in relation with bovine genome regions of Bovine 50K corresponding to known genes used to observe SNP among 48 individuals of cattle. From left to right: first box with blue shade is map of identified copy number variation in the genome of Bos taurus (Bae et al. 2010), yellow-shaded box is selected regions in chromosomes identified by Bae et al. (2010) which have overlap position with SNP observed in our study, arrows contain genes in cattle coincident with the selected regions consisting of SNP in our study (the right ones).
relationship compared to other individual dairy cattle. The only one genetical twinning for each OG (X_I_KB1_PT_7415) and HF (X_I_KB1_PR_IK3) grouped in different clades, reflecting that the two had far genetic distance. Another interesting example, these SNPs were able to identify the genetic twinning mother cow (X_I_KB1_PR_IK3) and her triplet calf (IK3_1, IK3_2 and IK3_3) in the same clade (clade I). Parent-child heritability frequency would confirm the parent-child relationship (Bae et al. 2008; 2010). Thus, OG beef cattle and HF dairy cattle generally tended to be clearly separated in different clusters without considering their genetic history, sex, historical twin and normal. This result indicated that most individuals were closely related to one another, regardless of the same breed. However, no clear differentiation of individuals found within breed either in OG or HF, indicating that the SNPs developed based on dairy cattle genome (Bovine 50K SNP) were only useful to differentiate cattle according to the genetic background of individual
within breed. This is consistent with the preliminary analysis in previous report (Lestari and Tasma 2012). Moreover, these results demonstrated that inbreed-ing and selection had little effect on reducinbreed-ing genetic diversity and differentiating both within HF and OG breeds in Indonesia at a genome-wide level, similarly to the study case of other HF breed in Australia (Zenger et al. 2007). These SNP markers could be useful for association analysis with phenotypic characters of cattle such as meat productivity, beef quality and milk quality. In line with the previous report (Bae et al. 2010), further research could examine the genetic effects of the SNPs on various economic characters on cattle.
When the location on a chromosome with copy number variation in Bos taurus (Bae et al. 2010) was overlapped with the regions/loci containing SNP in our study, some genes were identified on chromo-somes 3, 4, 5, 7, 13, 17 and 18 whose positions were in the loci we observed in this study (Fig. 5). For example, chromosome 3 at position of 36,163,190-36,
36,163,190..36,338,393bp
10,009,287..10,665,698 bp
102,164,053..102,261,488bp
4,650,135..5,033,417bp
CSF1, GSTM3 GATAD1, LOC524650, MGC148329
GUCY2C,PLBD1
1 loci
10 loci
CIST1, IFI30, ISYNA1 JUND, LRRC25, LSM4, MPV17L2, PGPEP1, PIK3R2, RAB3A, SSBP4
54,700,988..55,222,116BP 13 loci
ARFGAP1, ARFRP1, C13H20ORF11, C13H20orf149 C13H20orf195, DIDO1, EEF1A2, RTEL,
SLC17A9, STMN3, TNFRSF6B, ZGPAT
15,002,149..15,372,017bp
10,398,490..10,604.602bp 48,593,919..48,725,107bp
SMARCAS MGC140224, EID2, MED29, RPS16
SUPT5H, TIMM50, ZEP36
10 loci
9 loci
5 loci CARD11, CHST12, LFNG
42,346,692..42,719,563bp
Gain (duplication) Loss (deletion)
Common CNVR (freq. >2.5%)
8 loci Chromosome
1
2
3
4
5
6
7
8
9
10
11
12
13
14
15
16
17
18
19
20
21
22
23
24
25
26
27
28
29
0 10 20 30 40 50 60 70 80 90 100 120
Position (mb)
338 and 393bp showed overlap with one region (ARS-BFGL-NGS-66 946) which had two genes (CSF1 and GSTM3). Interestingly, on chromosome 13, there were 12 genes (ARFGAP1, ARFRP1, C13H20ORF11, C13H20orf149, C13H20orf195, DIDO1, EEF1A2, RTEL, SLC17A9, STMN3, TNFRSF6B, ZGPAT) that were coincident with the positions of 13 loci (ARS-BFGL-NGS-42 070, 16 884 smear-no-rs, Hapmap30591-BTA-159 623, 76 148,
ARS-BFGL-NGS-1120, ARS-BFGL -NGS-118 051, ARS-BFGL-BAC-12 577, ARS-BFGL-BAC-12 578, ARS-BFGL-NGS-85 574, NGS-100 973, BTB-00,529,185, ARS-BFGL-NGS-25 461 and ARS -BFGL-NGS-82 625) in our study. Notably, a total of 59 selected SNPs in our study that correspond to genes as identified previously (Bae
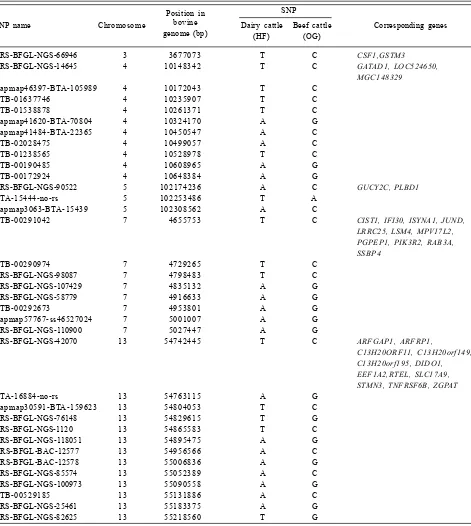
et al. 2010) revealed specific alleles on OG and HF (Table 3). These reference and alternate alleles were detected on selected chromosomes (3, 4, 5, 7, 13, 17
Table 3. List of selected SNPs located on gene regions identified in the beef and dairy cattle breeds.
Position in SNP
SNP name Chromosome bovine Dairy cattle Beef cattle Corresponding genes
genome (bp) (HF) (OG)
ARS-BFGL-NGS-66946 3 3677073 T C CSF1,GSTM3
ARS-BFGL-NGS-14645 4 10148342 T C GATAD1, LOC524650,
MGC148329
Hapmap46397-BTA-105989 4 10172043 T C
BTB-01637746 4 10235907 T C
BTB-01538878 4 10261371 T C
Hapmap41620-BTA-70804 4 10324170 A G
Hapmap41484-BTA-22365 4 10450547 A C
BTB-02028475 4 10499057 A C
BTB-01238565 4 10528978 T C
BTB-00190485 4 10608965 A G
BTB-00172924 4 10648384 A G
ARS-BFGL-NGS-90522 5 102174236 A C GUCY2C, PLBD1
BTA-15444-no-rs 5 102253486 T A
Hapmap3063-BTA-15439 5 102308562 A C
BTB-00291042 7 4655753 T C CIST1, IFI30, ISYNA1, JUND,
LRRC25, LSM4, MPV17L2, PGPEP1, PIK3R2, RAB3A, SSBP4
BTB-00290974 7 4729265 T C
ARS-BFGL-NGS-98087 7 4798483 T C
ARS-BFGL-NGS-107429 7 4835132 A G
ARS-BFGL-NGS-58779 7 4916633 A G
BTB-00292673 7 4953801 A G
Hapmap57767-ss46527024 7 5001007 A G
ARS-BFGL-NGS-110900 7 5027447 A G
ARS-BFGL-NGS-42070 1 3 54742445 T C ARFGAP1, ARFRP1,
C13H20ORF11, C13H20orf149, C13H20orf195, DIDO1, EEF1A2,RTEL, SLC17A9, STMN3, TNFRSF6B, ZGPAT
BTA-16884-no-rs 1 3 54763115 A G
Hapmap30591-BTA-159623 1 3 54804053 T C
ARS-BFGL-NGS-76148 1 3 54829615 T G
ARS-BFGL-NGS-1120 1 3 54865583 T C
ARS-BFGL-NGS-118051 1 3 54895475 A G
ARS-BFGL-BAC-12577 1 3 54956566 A C
ARS-BFGL-BAC-12578 1 3 55006836 A G
ARS-BFGL-NGS-85574 1 3 55052389 A C
ARS-BFGL-NGS-100973 1 3 55090558 A G
BTB-00529185 1 3 55131886 A C
ARS-BFGL-NGS-25461 1 3 55183375 A G
and 18 ) in dairy and beef cattle, respectively. The point mutation existing in the cattle breeds in Indonesia varied with bi-allele of T/C, A/C, A/G, T/A, T/G and C/G. These base substitution which may affect phenotypic variation in different breeds of cattle may need to be further investigated and could provide insight into enrichment of phenotypic impact through genomic resources (Gan et al. 2008; Liu et al. 2008).
Information on genetic variation of cattle breeds in Indonesia based on bovine genome could comple-ment and enrich previous studies. A number of researches in genome-wide SNP genotyping has been progressively achieved, such as cost-effective dairy cattle breeding programs (Hayes et al.2009), useful information on genetic variation of Korean Hanwoo breed (Dadi et al. 2012) and indicine and African cattle breeds (Matukumalli et al. 2009), and genome wide association for milk production in Danish Jersey cattle (May et al. 2010). Specific SNPs associated with genes have also been elucidated their association with targeted traits in dairy and beef cattle (Liu et al. 2011; Lu et al. 2011; Deb et al. 2014). Thus, our study is relevant with previous studies using Bovine SNP array conducted in many countries to offer a useful
knowledge and promise for improving targeted traits in cattle.
Indeed, this result could be a good clue that the use of SNP chip is more powerful and could be functional in genetic diversity analysis. Several SNPs within and close to genes may provide an excellent solution to the disadvantage of SNP markers that have been used in diversity analyses (Zimin et al. 2009; Snelling et al. 2010). The SNP data represent a vast and largely untapped resource to assist the investigation of genetic studies in cattle, and also useful for cattle genetic improvement programs. The patterns of allele frequency variability observed among the breeds signal the genetic imprint of past and presumably on going episodes of selection (Hayes et al. 2009; Dadi et al. 2012).
CONCLUSION
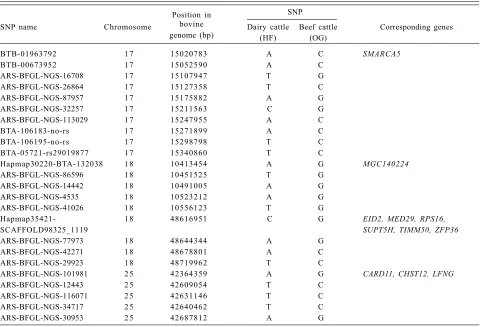
SNPs on bovine genome were successfully identified across total chromosomes of cattle breeds of Ongole Grade (OG) and Holstein Friesian (HF). Some SNP markers with high MAF scores (> 0.2) revealed Table 3. (continued).
Position in SNP
SNP name Chromosome bovine Dairy cattle Beef cattle Corresponding genes
genome (bp) (HF) (OG)
BTB-01963792 1 7 15020783 A C SMARCA5
BTB-00673952 1 7 15052590 A C
ARS-BFGL-NGS-16708 1 7 15107947 T G
ARS-BFGL-NGS-26864 1 7 15127358 T C
ARS-BFGL-NGS-87957 1 7 15175882 A G
ARS-BFGL-NGS-32257 1 7 15211563 C G
ARS-BFGL-NGS-113029 1 7 15247955 A C
BTA-106183-no-rs 1 7 15271899 A C
BTA-106195-no-rs 1 7 15298798 T C
BTA-05721-rs29019877 1 7 15340860 T C
Hapmap30220-BTA-132038 1 8 10413454 A G MGC140224
ARS-BFGL-NGS-86596 1 8 10451525 T G
ARS-BFGL-NGS-14442 1 8 10491005 A G
ARS-BFGL-NGS-4535 1 8 10523212 A G
ARS-BFGL-NGS-41026 1 8 10556123 T G
Hapmap35421- 1 8 48616951 C G EID2, MED29, RPS16,
SCAFFOLD98325_1119 SUPT5H, TIMM50, ZFP36
ARS-BFGL-NGS-77973 1 8 48644344 A G
ARS-BFGL-NGS-42271 1 8 48678801 A C
ARS-BFGL-NGS-29923 1 8 48719962 T C
ARS-BFGL-NGS-101981 2 5 42364359 A G CARD11, CHST12, LFNG
ARS-BFGL-NGS-12443 2 5 42609054 T C
ARS-BFGL-NGS-116071 2 5 42631146 T C
ARS-BFGL-NGS-34717 2 5 42640462 T C
approximately 69% and could be useful in genetic diversity analyses, given their great differentiating power. Several SNPs within and close to genes may provide an excellent solution to the disadvantage of SNP markers that have been used in diversity analyses. Dairy and beef cattle possessed specific alleles corresponding to known genes which may contribute to the genetic characters of each breed. The Bovine SNP 50K described in this study was more usable for differentiation among breeds than individuals in the same breed of cattle.
ACKNOWLEDGEMENT
This work was supported by a grant from the Indonesian Agency for Agricultural Research and Development, Ministry of Agriculture, Republic of Indonesia. Authors thank to Eryck Andreas and laboratory technicians for kind help in blood sample preparation.
REFERENCES
Aryogi dan E. Romjali. 2009. Potensi, pemanfaatan, dan kendala pengembangan sapi potong lokal sebagai kekayaan plasma nutfah Indonesia. Lokakarya Nasional Pengelolaan dan Perlindungan Sumber Daya Genetik di Indonesia: Manfaat ekonomi untuk mewujudkan ketahanan nasional.
Bae, J.S., H.S. Cheong, J.O. Kim, S.O. Lee, E.M. Kim, H.W. Lee, S. Kim, J.W. Kim, T. Cui, I. Inoue and H.D. Shin. 2008. Identification of SNP markers for common CNV regions and association analysis of risk of subarachnoid aneurysmal hemorrhage in Japanese population. Biochem. Biophys. Res. Commun. 373: 593-596.
Bae, J.S., H.S. Cheong, L.H. Kim, S. Namgung, T.J. Park, J.Y. Chun, J.Y. Kim, C.F.A. Pasaje, J.S. Kee and H.D. Shin. 2010. Identification of copy number variations and common deletion polymorphism in cattle. BMC Genomics 11: 232.
Dadi, H., J.J. Kim, D. Yoon and K.S. Kim. 2012. Evaluation of single nucleotide polymorphisms (SNPs) genotyped by the Illumina Bovine SNP 50K in cattle focusing on Hanwoo breed. Asian-Aust. J. Anim. Sci. 25: 25-32.
Deb, R., A. Kumar, S. Chakraborty, A.K. Verma, R. Tiwari, K. Dhama, U. Singh and S. Kumar. 2013. Trends in diagnosis and control of bovine mastitis: a review. Pak. J. Biol. Sci. 16: 1653-1661.
Deb, R., B. Sajjanar, U.Singh, S. Kumar, R. Singh, G. Sengar and A. Sharma. 2014. Effect of heat stress on the expression profile of Hsp90 among Sahiwal (Bos indicus) and Frieswal (Bos indicus_Bos taurus) breed of cattle: a comparative study. Gene. 536:435e440.
Diwyanto, K. 2005. Pokok-pokok pemikiran pengelolaan berkelanjutan plasma nutfah peternakan. Makalah dalam Lokakarya Plasma Nutfah Peternakan. Puslitbangnak dan Balitnak. Bogor, 29 Desember 2005.
Freking, B.A., S.K. Murphy, A.A. Wylie, S.J. Rhodes, J.W. Keele, K.A. Leymaster, R.L. Jirtle and T.P. Smith. 2002. Identification of the single base change causing the callipyge muscle hypertrophy phenotype, the only known example of polar over dominance in mammals. Genome Res. 12: 1496-1506. Fries, R., A. Eggen and G. Stranzinger. 1990. The bovine genome
contains polymorphic microsatellites. Genome 8: 403-406. Gan, Q.F., L.P. Zhang, G.Y. Li, H.D. Li, X. Gao, H.Y. Ren, J.B.
Chen and S.Z. Xu. 2008. Association analysis of thyroglobulin gene variants with carcass and meat quality traits in beef cattle. J. Appl. Genet. 49: 251-255.
Grattapaglia, D., B. Orzenil, Silva-Junior, M. Kirst, B.M. de Lima, D.A. Faria and G.J. Pappas. 2011. High-throughput SNP genotyping in the highly heterozygous genome of Eucalyptus: assay success, polymorphism and transferability across species. BMC Plant Biol. 11: 65.
Gupta, P.K., S. Rustgi and R.R. Mir. 2008. Array-based high-throughput DNA markers for crop improvement. Heredity 101: 5-18.
Hasegawa, A., D. Taniguchi, I. Matsumoto and Y. Mizoguchi. 2014. Analysis of single nucleotide polymorphisms (SNPs) in Stearoyl-CoA Desaturase (SCD) gene promoter region of six pig breeds. Proceedings of 10th World Congress of Genetics Applied to Livestock Production. Canada.
Hayes, B.J., P.J. Bowman, A.J. Chamberlain and M.E. Goddard. 2009. Invited review: Genomic selection in dairy cattle: progress and challenges. J. Dairy Sci. 92: 433-443.
Heaton, M.P., G.P. Harhay, G.L. Bennett, R.T Stone, W.M. Casas, J.W. Keele, T.P. Smith, C.G. Chitko-McKown and W.W. Laegreid. 2002. Selection and use of SNP markers for animal identification and paternity analysis in U.S. beef cattle. Mamm. Genom. 13: 272-281.
Hoffman, J.I., R. Tucker, S.J. Bridget, M.S. Clark, S.J. Forcadas and J. Slater. 2012. Rates of assay success and genotyping error when single nucleotide polymorphism genotyping in non-model organisms: a case study in the Antarctic fur seal. Mole. Ecol. Resour. 12: 861-872.
Illumina Inc. 2011a. GoldenGate Bovine3K genotyping Bead Chip. http://www.illumina.com/Documents/products/datacheets_ bovine3K.pdf.
Illumina Inc. 2011b. BovineSNP50 Genotyping Bead Chip. http:/ / w w w. i l l u m i n a . c o m / D o c u m e n t s / p r o d u c t s / d a t a s h e e t s _ bovine_snp50.pdf.
Kim, S., K. Zhao, R. Jiang, J. Molitor, J.O. Borevitz, M. Nordborg and P. Marjoram.2006. Association mapping with single-feature polymorphisms. Genetics 173: 1125-1133.
Kruglyak, L. 1997. The use of a genetic map of bi-allelic markers in linkage studies. Nat. Genet. 17: 21-24.
Lestari, P. dan I.M. Tasma. 2012. Analisis genotipe sapi berdasarkan total genom. Warta Litbang Pertanian 34(4): 17-18. Liu, G.E., C.P. Van Tassel, T.S. Sonstegard, R.W. Li, L.J. Alexander,
J.W. Keele, L.K. Matukumalli, T.P. Smith and L.C. Gasbarre. 2008. Detection of germline and somatic copy number variations in cattle. Dev. Biol. (Basel). 132: 231-237.
Liu, Y., D. Li, H. Li, X. Zhou and G. Wang. 2011. A novel SNP of the ATP1A1 gene is associated with heat tolerance traits in dairy cows. Mol. Biol. Rep. 38: 83-88.
Matukumalli, L.K., C.T. Lawley, R.D. Schnabel, J.F. Taylor, M.F. Allan, M.P. Heaton, J. O’Connell, S.S. Moore, T.P. Smith, T.S. Sonstegard and C.P. van Tassell. 2009. Development and characterization of a high density SNP genotyping assay for cattle. PLoS One. 4(4): e5350.
May, M.D., G. Sahana, F.B. Christiansen and B. Guldbrandtsen. 2010. A genome-wide association study for milk production traits in Danish Jersey cattle using 50K single nucleotide polymorphism chip. J. Anim. Sci. 88: 3522-3528.
Michelizzi, V.N., X. Wu, M.V. Dodson, J.J. Michal, J. Zambrano-Varon, D.J. McLean and Z. Jiang. 2011. A global view of 54,001 single nucleotide polymorphisms (SNPs) of the Illumina BovineSNP50 bead chip and their transferability to water buffalo. Int. J. Biol. Sci. 7: 18-27.
Prahanisa, H., Sumadi and Adiarto. 2011. Genetic potential estimation of Holstein Friesian cows at Taurus Dairy Farm, Cicurug, Sukabumi. Buletin Peternakan 35: 1-10.
Singh, U., R. Deb, R.R. Alyethodi, R. Alex, S. Kumar, S. Chaktraborty, K. Dhama and A. Sharma. 2014. Molecular markers and their applications in cattle genetic research: A review. Biomarkers and Genomic Medicine 6: 49-58. Smit, M., K. Segers, L.G. Carrascosa, T. Shay, F. Baraldi, G. Gyapay,
G. Snowder, M. Georges, N. Cockett and C. Charlier. 2003. Mosaicism of solid gold supports the causality of a noncoding A-to-G transition in the determinism of the callipyge phenotype. Genetics 163: 453-456.
Snelling, W.M., M.F. Allan, J.W. Keele, L.A. Kuehn, T. McDanels, T.P.L. Smith, T.S. Sonstegard, R.M. Thallman and G.L. Bennet. 2010. Genome-wide association study of growth in crossbred beef cattle. J. Anim. Sci. 88: 837-848.
Sunnucks, P. 2001. Efficient genetic markers for population biology. Trends Ecol. Evol. 15: 199-203.
Thohari, M. 2000. Pemanfaatan plasma nutfah ternak lokal dalam sistem usaha tani terintegrasi. Bahan Ajar Pelatihan Revitalisasi Keterpaduan Usaha Ternak dalam Sistem Usaha Tani. Bogor dan Surakarta, 20 Februari-8 Maret 2000. Puslitbang Peternakan, Bogor.
Tyler-Smith, C. 2008. An evolutionary perspective on Y-chromosomal variation and male infertility. Int. J. Androl. 31: 376-382.
VanRaden, P.M., C.P. Van Tassell, G.R. Wiggans, T.S. Sonstegard, R.D. Schnabel, J.F. Taylor and F.S. Schenkel. 2009. Invited review: Reliability of genomic predictions for North American Holstein bulls. J. Dairy Sci. 92(1): 16-24.
Wenzl, P., H. Raman, J. Wang, M. Zhou, E. Huttner and A. Kilian. 2007. A DArT platform for quantitative bulked segregant analysis. BMC Genomics 8: 196.
Wiggans, G.R., P.M. VanRaden and T.A. Cooper. 2011. The genomic evaluation system in the United States: Past, present and future. J. Dairy Sci. 94: 3202-3211.
Yan, J., X. Yang, T. Shah, H. Sanchez-Villeda, J. Li, M. Warburton, Y. Zhou, J.H. Crouch and Y. Xu. 2010. High-throughput SNP genotyping with the GoldenGate assay in maize. Mol. Breed. 25: 441-451.
Zenger, K.R., M.S. Khatkar, J.A. Cavanagh, R.J. Hawken and H.W. Raadsma. 2007. Genome-wide genetic diversity of Holstein Friesian cattle reveals new insights into Australian and global population variability, including impact of selection. Anim. Genet. 38: 7-14.
Zimin, A.V., A.L. Delcher, L. Florea, D.R. Kelley, M.C. Schatz, D. Puiu, F. Hanrahan, G. Pertea, C.P. van Tassell, T.S. Sonstegard, G. Marçais, M. Roberts, P. Subramanian, J.A. Yorke and S.L. Salzberg. 2009. A whole-genome assembly of the domestic cow,