An Analysis of the Influence of Both Interest Rate and Capital
Structure on Rate of Return and its Implication to Firm Value
Andre Suryaningprang
1and Jaja Suteja
2Faculty of Economics, Pasundan University, Jl. Tamansari No. 6-8, Bandung 40116 Indonesia E-mails: 1[email protected]; 2[email protected]
Abstract: The present research was intended to find out the result of an analysis of both interest rate and capital structure and to determine their influence on rate of return and its implication to the firm value at BEI.
The method used was a descriptive method with a quantitative approach. The research sample was corporate obligation firms listed at BEI in time period 2009 through 2013, selected by a purposive sampling method with the following criteria: 1) the obligations are traded at BEI in the time period of 2009 through 2013, and 2) they have an obligation rank from PT. PEFINDO and have neither put option nor call option.
The data was analyzed by using a panel data analysis technique. In general, the research concluded that 1) there was influence of interest rate on rate of return, 2) there was influence of capital structure on rate of return, and 3) there was influence of obligation rate of return on firm value.
Keywords: Interest Rate, Capital Structure, Rate of Return, and Firm Value
INTRODUCTION
There are a wide range of securities such as stocks, bonds, and mutual funds in Indonesian capital market. Investors have opportunity to pick up among a variety of securities. One of securities dealt in the capital market is bond. It is the acknowledgment of debt issued by either governments or private companies to investors, in which the debt shall be paid at a specified time. Investors have interests for their loans. As Hulwati (2004:95) put it, as one of instruments known in the capital market, the issuance of bonds by a company is highly favorable something than bank loans, as payment of interests on the bonds are lower and can be paid on a regular basis, six months or a year once.
both investors and issuers should always pay attention to fluctuation in bond prices and factors influencing it; one of the factors to consider is the interest rate which is susceptible to fluctuation.
One of factors having, supposedly, effect on the Yield To Maturity is the public interest. According to Surya and Nasher (2011:192), the interest rate used, frequently, by investors as reference and comparison in determining bond in optimal return is the interest rate of Indonesia Bank Certificate (IBC) as it is supported and guaranteed by government (Indonesia Bank) served as monetary authority. So, the market security participants regard IBC as a risk-free security. Research on the effect of interest rate on Yield To Maturity was done by Nurfauziah and Setyarini (2004:148) stating that the interest rate has not any effect on Yield To Maturity. Meanwhile, in a different research, Ibrahim (2008:102) and Surya and Nasher (2011:192) states that the interest rate of IBC has positive effect on Yield To Maturity, it’s meant the higher interest rate will increase Yield To Maturity of bonds.
Faerber (2000:203) states that investors prefer to invest in bonds rather than stocks, for two reasons: (i) volatility of stocks is higher than of bonds, thereby reducing the attractiveness of investment in stocks, and (ii) bonds offer positive rate of return and fixed income; so bonds offer more assurance than stocks did. Jewell and Livingston (2000:105) states that investors face problems in relation to information due to diverse characteristics of the issuer. Bond rating issued by independent agencies help to reduce the problems. In addition to ranking, another factor considered by bond investors is bond return. Bond return is result to be obtained by investors when they invest in bonds. The return is stated in yield.
Problems faced by the Indonesian bond market today are shallow market, leading to lower liquidity, especially corporation bonds, and rare transactions. Liquidity is very important in influencing bond yield. High liquidity make the bonds more attractive as there are more buyers and sellers more, so those who have bonds may sell their bond at any time (Favero, et al., 2007:302). A research on the effect of liquidity on Yield To Maturity was conducted by Nurfauziah and Setyarini (2004: 148) and Yan He, et at. (2005:103) states that liquidity effect on Yield To Maturity, it means higher liquidity of a bond leads to higher Yield To Maturity. This is contrast with research conducted by Favero, et at. (2007: 302) stating that liquidity has effect on Yield To Maturity, it means that the higher the liquidity, the lower the Yield To Maturity.
Earlier studies by Thompson and Vaz (1990:302) and Nurfauziah and Setyarini (2004:152) suggest that the interest rate have not significant effect on the bond yield. The results were different from those carried out by Kadir (2007:93), showing that the interest rate have positive, significant effect on the bond yield.
Based on the description of studies, the results suggest research gap in the interest rate variable, and debt to equity ratio in the effect on the bond yield and the implication in the company value. So, the problem statement in this study is there are differences in the results of research in relation to factors affecting the bond yield.
Bond
investors. The term of bond was set and accompanied by repayment for interest that the amount and time of payment were determined in an agreement (Sunariyah, 2004:106).
According to Arifin (2005:194), a bond is long-term debt instrument that is used by a company or a state to get some funds from a variety of lender groups. Most of bonds pay for interests every semester at a certain rate of coupon and have a maturity between 5 to 30 years during which bondholders will receive repayment in accordance with par value. Furthermore, Priambodo (2006:194) argue bond is a debt instrument containing a promise of bond issuer to pay an amount of loans and interests to bondholder. As Fabozzi (2000:205) put it, to produce a proper bond investment strategy, an analysis of factors affecting the bond value is necessary. The bond value is affected by risk and return of the bond as expected. The return that can be derived from investment in bonds is coupon, an interest of bond, and capital gain, a difference between buying price and selling price of the bond. Investors may require rate of return by comparing the bond with other alternative comparable investments in the market. If the required return in the market is equal the return offered by the bond, the bond price will be equal the nominal value. If the required return in the market is higher than the return offered by the bond, the bond price will be below the nominal value, or sold in discount. If the required return in the market is lower than the return offered by the bond, the bond price will be above the nominal value, or sold in premium.
Bond Yield
Bond yield is most important factor for investor’s consideration in the purchase of bonds as investment instrument. Bond investor will calculate how much investment return on funds for the bonds by using the measuring instrument of yield (Rahardjo, 2003:208). Yield is return on investment in bond expressed in percentage (Samson, 2006:201). Yield To Maturity (YTM) can be interpreted as compounded rate of return that will be accepted if the investor bought bonds at the current market prices and holding the bonds up to maturity. YTM is a widely used measure of yield, as it is reflecting return at compounded interest rate as expected by investor. If required two assumptions might be fulfilled, the intended yield to maturity will be equal the realized yield. The first assumption is that investor will maintain the bond up to maturity. The value obtained, if the first assumption is filled, is often called yield to maturity (YTM). The second assumption is investor reinvest revenues derived from the bonds at the resultant YTM level (Tandelilin, 2001:194).
Interest Rate
Investment in deposit or IBC will produce risk-free interest without management in mind. Meanwhile, investment in bond has such risks as failed acceptance of coupon or paying off, and damage for opportunity cost to invest elsewhere. Therefore, the bond yield gain should be higher than the rate of deposit or IBC (Samson, 2006:206).
Capital Structure
structure is contained, thoroughly, in the balance sheet next credit. In the balance sheet next credit are long- and short-term debt and long- and short-term equity. So, the financial structure includes all expenditure, either long term or short term. Instead, the capital structure is just concerning with long-term expenditure, not short-long-term.
The capital structure can also be defined as the permanent financing comprising long-term debt, preference stock and stockholder’ equity (Weston and Capeland, 1997:205). Based on the explanation above, the capital structure can be defined as ratio between long-term debt and individual capital. Long-term debt comprises a variety of bonds and mortgage debts, while the individual capital covers various shares and retained earnings.
Value of the Firm
Company is an organization combining and organizing various resources, for purpose, for producing goods and services for sale (Salvatore, 2005:264). It would be very inefficient and costly for entrepreneurs to enter and make a contract without any company with workers and owners of capital, land, and other resources for every stage of individual production and distribution. Instead, entrepreneurs are usually entering into long-term, important contracts with workers for various tasks at a certain wage and other benefits. Such contracts are, commonly, much cheaper than a number of specific and highly profitable contracts for entrepreneurs and workers and other owners of resources. Company exists as to save the costs of transactions. By internalizing various transactions (i.e., operating various functions in the company), the company also save on sale tax and avoiding from price controls and governmental regulations that just apply to transactions between companies.
The financial ratios were used by investors to determine the market value of company. The ratios provide an indication for the management on the investors’ valuation of the past company’s performance and the future prospects. There are several ratios to measure the market value of company, one of which Tobin’s Q. This ratio is considered to provide the best information, as it is explaining various phenomena
in the company activities, for examples, cross-sectional difference in investment and diversification decision-making (Claessens and Fan, 2003 in Sukamulja, 2004); relationship between management stock ownership and company value (Onwioduokit, 2002 in Sukamulja, 2004); relationship between management performance and advantages of acquisition (Gompers, 2003 in Sukamulja, 2004), and funding, dividend, and compensation policies (Imala, 2002 in Sukamulja, 2004).
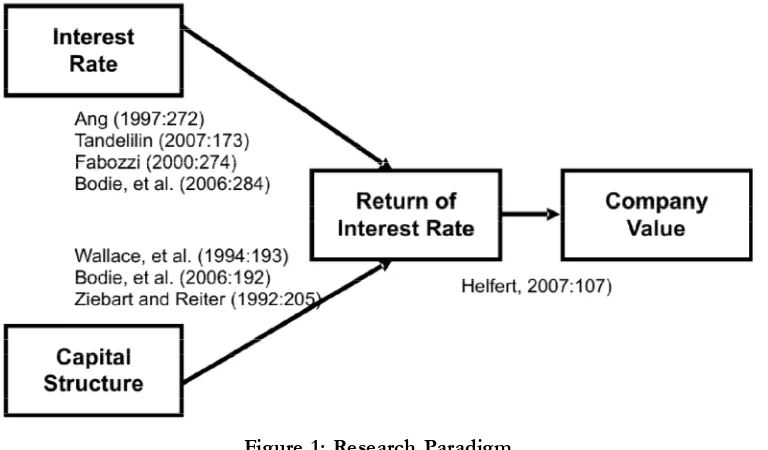
Research Hypothesis
Based on the description of problems and literature studies, the hypothesis in this study are as follows: H1: Interest rate has effect on the return of interest rate.
H2: Capital structure has effect on the return of interest rate. H3: Return of interest rate has effect on the company value.
RESEARCH METHOD Operational Variable
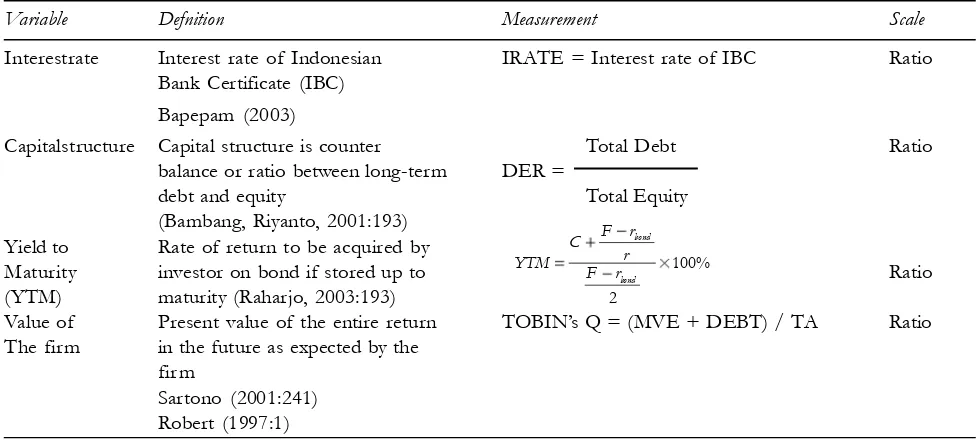
The operational definition of each variable is as follows: independent variables (interest rate and capital structure); intervening variables (yield to maturity (YTM)), and dependent variable (value of the firm).
Table 1 Operational Variable
Variable Defnition Measurement Scale
Interestrate Interest rate of Indonesian IRATE = Interest rate of IBC Ratio Bank Certificate (IBC)
Bapepam (2003)
Capitalstructure Capital structure is counter Total Debt Ratio balance or ratio between long-term DER =
debt and equity Total Equity
(Bambang, Riyanto, 2001:193) Yield to Rate of return to be acquired by
Maturity investor on bond if stored up to Ratio
(YTM) maturity (Raharjo, 2003:193)
Value of Present value of the entire return TOBIN’s Q = (MVE + DEBT) / TA Ratio The firm in the future as expected by the
firm Exchange) during the period of 2009 to 2013. The sample of this study is bond corporate listed on ISC from 2009 to 2013 selected by using random sampling method in criteria: (i) bonds dealt in the Stock
Exchange from 2009 to 2013, (ii) it have investment grade level of PT. PEFINDO and non-convertible (have not a put option and call option). While method used to determine the sample is purposive sampling, a method of selecting samples in specific criteria.
The sample criteria are:
1. Corporation bonds recorded under trade from 2009-2013. 2. Bond level and a minimum rating equivalent A-.
3. The bonds under currency or have been not due, allowing to obtain data on the current bond prices.
4. Pay for a fixed amount of coupon to assure the floating rate has not effect on the bond yield. 5. Corporation bonds were listed at bond level issued by PEFINDO.
6. The company issued bonds have a complete set of financial statements during the period of observation.
DATA ANALYSIS METHOD
Data analysis method used in this study is panel data regression analysis. The panel data regression operation in this study is using Eviews 7 software.
According Endri (2011:1), the panel data/pooled data are combination of time series data and cross section data. Time series data usually includes one object/individual (e.g., stock prices, foreign exchange rates, IBC, or the rate of inflation), but includes some periods (daily, monthly, quarterly, or yearly). The cross section data consists of some or many objects, often called the respondent (e.g., company) and some types of data (e.g., profits, advertising costs, retained earnings, and the level of investment) within a certain time period. When we make an observation of such economic unit behavior as household, company or state, we will not only observe the units, but, at the same time, the behavior of the units at different time periods.
Linear regression model using cross section and time series data (Endri, 2011:1-2). The regression equation:
Y = f (X1, X2, X3, X4) Z = f (y)
1. Model with cross section data Yi = a + Xi + ei; = 1.2, …, N N: the number of cross section data 2. Model with time series data
Yt = a + b Xt + et; t = 1.2, …, T
where:
N = the number of observations
T = the amount of time
N x T = the number of panel data
Three models may be used to perform panel data regression. All three models are Pooled OLS, Fixed Effect, and Random Effect (Heru Prasetyo Susilo, 2012:5).
RESULTS Descriptive Analysis
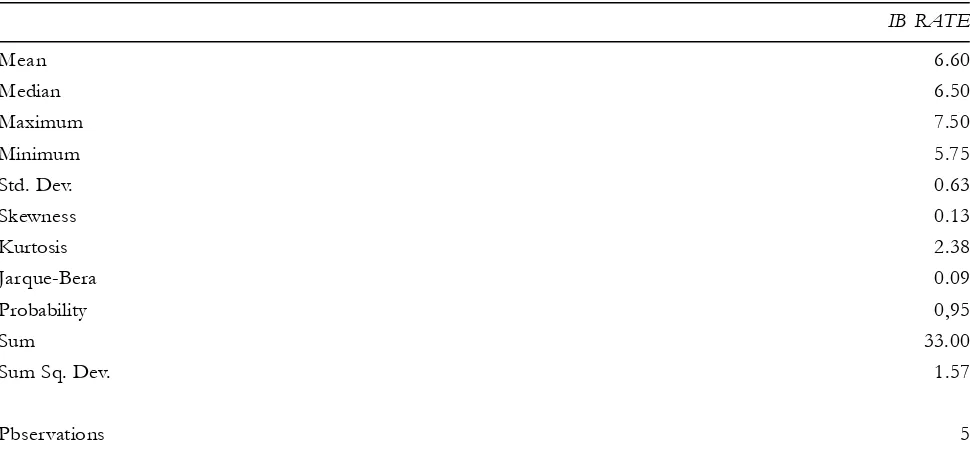
Interest Rate Analysis
The descriptive analysis of interest rate from 2009 to 2013 as sample of the study provides results as shown in Table 4:13 below:
Table 4.13
Results of Descriptive Statistic Analysis of Interest Rate
IB RATE
Mean 6.60
Median 6.50
Maximum 7.50
Minimum 5.75
Std. Dev. 0.63
Skewness 0.13
Kurtosis 2.38
Jarque-Bera 0.09
Probability 0,95
Sum 33.00
Sum Sq. Dev. 1.57
Pbservations 5
Source: Results of Eviews 7 Calculation
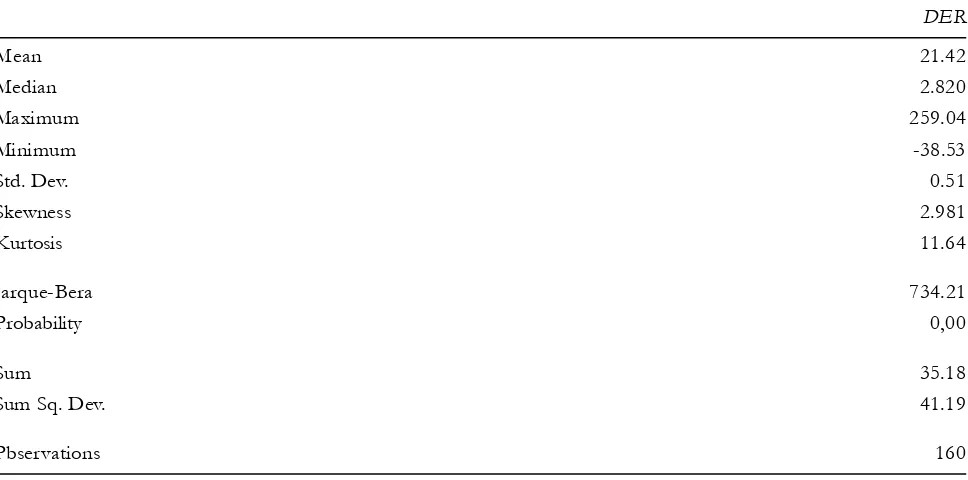
Capital Structure Analysis
The results of the descriptive analysis on DER (Debt to Equity Ratio) in the bond company incorporated in Indonesia Stock Exchange from 2009 to 2013 as sample of the study may be seen in Table 4.22 below:
Table 4.22
Results of Descriptive Analysis of Capital Structure
DER
Mean 21.42
Median 2.820
Maximum 259.04
Minimum -38.53
Std. Dev. 0.51
Skewness 2.981
Kurtosis 11.64
Jarque-Bera 734.21
Probability 0,00
Sum 35.18
Sum Sq. Dev. 41.19
Pbservations 160
Source: Results of Eviews 7 Calculation
Table 4.22 represent the capital structure as measured by Debt to Equity Ratio (DER) in bond companies incorporated in Indonesia Stock Exchange for 5 years from 2009 to 2013 are varied and the lowest value is -38.53% by 2010 in Smartfren Telkom, Tbk, and highest value, 259.04%, by 2013 in State Electricity Enterprise (Company). Based on the table of capital structure criteria, the mean percentage of capital structure for 5 years is 21.42% and falling in low criteria moving to moderate.
Return of Interest Rate Analysis
The results of the descriptive analysis on return of interest rates in bond companies incorporated in Indonesia Stock Exchange from 2009 to 2013 as sample of the study may be seen in Table 4.25 below:
Table 4.22
Results of Descriptive Analysis of Return of Interest Rates
YTM
Mean 94,8619
Median 25,01
Maximum 198,79
Minimum 23,42
Std. Dev. 37,35168
Skewness 1,065323
Kurtosis 2,885367
Jarque-Bera 30,35195
Probability 0,000000
Sum 73,08670
Sum Sq. Dev. 53,15997
Pbservations 160
Source: Results of Eviews 7 Calculation
Table 4.25 represent return of interest rates in bond companies incorporated in Indonesia Stock Exchange for 5 years from 2009 to 2013 are varied and the lowest value is 23.42% by 2010, and highest value, 198.79%, by 2013 in State Electricity Enterprise (Company). Based on the table of interest rate return criteria, the mean percentage of interest rate return for 5 years is 94.86% and falling in moderate criteria moving to high.
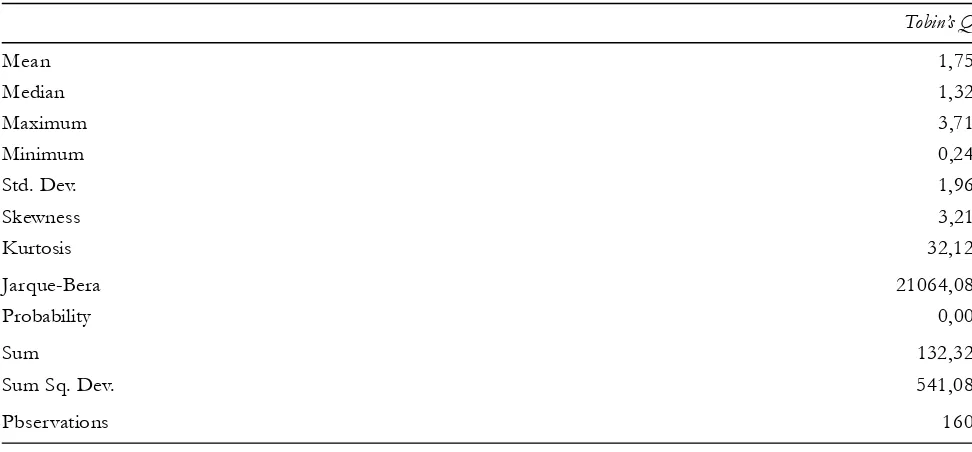
Company Value Analysis
The results of the descriptive analysis on company value as measured by Tobin’s Q in bond companies incorporated in Indonesia Stock Exchange from 2009 to 2013 as sample of the study may be seen in Table 4.28 below:
Table 4.28
Results of Descriptive Analysis of Capital Structure
Tobin’s Q
Mean 1,75
Median 1,32
Maximum 3,71
Minimum 0,24
Std. Dev. 1,96
Skewness 3,21
Kurtosis 32,12
Jarque-Bera 21064,08
Probability 0,00
Sum 132,32
Sum Sq. Dev. 541,08
Pbservations 160
Source: Results of Eviews 7 Calculation
Table 4.28 represent the company value as measured by Tobin’s Q in bond companies incorporated in Indonesia Stock Exchange for 5 years from 2009 to 2013 are varied and the lowest value is 0.24% by 2010 and 2013 in Smartfren Telkom, Tbk, and highest value, 3.71% by 2013 in Telekomunikasi Indonesia, Tbk and Pakuwon Jati, Tbk by 2009. Based on the table of company value criteria as measured by Tobin’s Q, the mean percentage of company value for 5 years is 1.75% and falling in moderate criteria moving to high.
Verificative Analysis
The panel data regression analysis equations using PLS model are as follows: PTBit = b0 + b1SBit + b2SMit + uit
NPit = b0 + b1PBit + b2UPit+ uit NPit = b0 + b1PTBit + Uit
After researcher make calculation of regression using PLS (pooled least square), the researcher has the results of calculation as follow:
Table 4.31
Results of Regression Calculation Using PLS (Pooled Least Square) of Interest Rate and Capital Structure To Return of Interest Rate
Dependent Variable: PTB
Method: GLS (Cross-section weights) Date: 3/22/16 Time: 14:05
Sample: 2009 2013 Included Observations: 3
Number of cross-sections used: 32 Total panel (balanced) observations: 160 One-step weighting matrix
White Heteroskedasticity-Consistent Standard Errors & Covariance
Variable Coefficient Std. Error t-Statistic Prob.
C 5,124512 0,012450 4,024123 0,0001
SB 0,454123 0,014217 7,214512 0,0005
SM 0,250012 0,002110 5,215421 0,0003
Weighted Statistics
R-squared 0,721213 Mean dependent var 0,912965
Adjusted R-squared 0,624123 S.D. dependent var 0,981180
S.E. of regression 0,708114 Sum squared resid 43,12264
F-statistic 15,10596 Durbin-Watson stat 2,155969
Prob(F-statistic) 0,000000 Unweighted Statistics
R-squared 0,493134 Mean dependent var 0,582796
Adjusted R-squared 0,336841 S.D. dependent var 0,799560
S.E. of regression 0,742842 Sum squared resid 47,45604
Based on the results of regression calculation using pooled least square approach in Table 4.31, the researcher compiled a panel data regression equation as follows:
PTBit = 5.124512it + 0.454123SBit + 0,250012SMit + uit
The regression equation has the following meanings that intercept is 5.124512, its means when independent variable is zero (0), the return of interest rate is 5.124512%. If each independent variable increases by 1%, the projection is as follows:
1. Increase of interest rate by 1% will be increasing the return on interest rate at 0.454123%; 2. Increase of capital structure by 1% will be increasing the return on interest rate at 0.250012%.
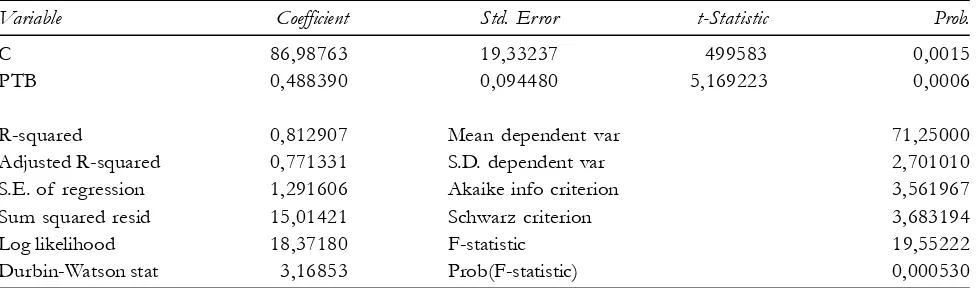
Table 4.32
Results of Regression Calculation Using PLS (Pooled Least Square) Approach of Return on Interest Rate To Company Value
Dependent Variable: NP Method: Pooled Least Squares Date: 3/25/16 Time: 11:05 Sample: 2009 2013
Included Observations: 2
Number of cross-sections used: 32 Total panel (balanced) observations: 160
Variable Coefficient Std. Error t-Statistic Prob.
C 86,98763 19,33237 499583 0,0015
PTB 0,488390 0,094480 5,169223 0,0006
R-squared 0,812907 Mean dependent var 71,25000
Adjusted R-squared 0,771331 S.D. dependent var 2,701010
S.E. of regression 1,291606 Akaike info criterion 3,561967
Sum squared resid 15,01421 Schwarz criterion 3,683194
Log likelihood 18,37180 F-statistic 19,55222
Durbin-Watson stat 3,16853 Prob(F-statistic) 0,000530
Source: Results of Eviews 7 Calculation
Based on the results of regression calculation using pooled least square approach in Table 4.32, the researcher compiled a panel data regression equation as follows:
PTBit = 86.98763it + 0.488390PTBit
The regression equation has the following meanings that intercept is 86.98763, its means when independent variable is zero (0), the return of interest rate is 86.98763%. If each independent variable increases by 1%, the increase in return on interest rate will be increasing the company value at 0.488390%.
IMPLICATIONS OF POLICY
investors. Therefore, investors should consider or monitor the movement of IBC interest rate, in which if the IBC interest rate increases, it is the right time to buy bonds and unreasonable time to realize capital gain. So investors should hold the bonds. Whereas if the IBC interest rate decrease, it is the right time to sell bonds or realize capital gain. In addition, the interest rate may be used as a benchmark to determine the magnitude of yield as expected by investors. Furthermore, for the bond issuers who want to issue or sell bonds, one of variables to be observed or considered as benchmark is the magnitude of interest rate, as it is one of primary factors or variables to be considered by investors, particularly in estimating yield that would be obtained by investors when they are investing in bonds. Therefore, when the IBC interest rate has decrease, it is the right time to issue or sell bonds. Furthermore, the interest rate can be used as a benchmark to determine the magnitude of bond coupon rate to be offered to the public or investors.
The statement above is consistent with the concept of risk premium, stating that if the risk free rate, in this case is the IBC interest rate, increases, all of investment instruments outside the instrument will adjust the rate of return. This adjustment is reasonable in terms of risk and return concepts, in which investors have willingness to put their investment in riskier instruments, providing the investments have higher returns, as investors tend to invest in risk free instruments.
This is consistent with the premise of Van Home and Wachowicz (1997:206), stating that if the interest rate increases, the rate of return will be rising as expected by the market. Furthermore, Tandelilin (2007:105) stated the same thing that the high interest rate will lead to increase in return on investment as required by investors.
Also, this study showed consistent results or supports earlier study by Kadir (2007:205) who found that the interest rate has positive, significant effect on the bond yield. However, they are not supporting the results of the studies by Thompson and Vaz (1990: 105) and Nurfauziah and Setyarini (2004: 194) who found that the interest rate has not significant effect on the bond yield.
Variable capital structure as measured by DER (Debt to Individual capital Ratio) which has a positive and significant impact on bond yields, then the management company (the issuer of bonds) are appropriately constantly monitor the company’s fundamentals, especially the ratio of DER (Debt to Individual capital Ratio) or how big debt held firm in their capital structure to support the operations of the company to obtain greater profits. Thus, with the growing magnitude of the ratio of DER shows the debt held by the company excessive and indicates the possibility that a bond issuer or the company will not be able to create sufficient profit to pay obligation bonds or have a default risk so great that investors will expect a yield that is large when investing in bonds held by the company. Therefore, for investors who are risk taker then you should invest in bonds issued by issuers of bonds that have DER great because it will give a large yield. As for investors who risk averter then you should invest in bonds issued by issuers of bonds that have DER ratio is small, because it has a default risk is relatively small.
concluded that the high DER ratio will indicate the higher the risk of corporate defaults in the future so that it will have an impact on the high yield corporate bond.
The results of this study are consistent or supports a previous study conducted by Ziebart and Reiter (1992), Sengupta (1998), Bhojraj and Sengupta (2003) and the Khurana and Raman (2003) who found that the debt-to-individual capital ratio (DER) positive and significant impact the bond yield. Further, not supporting the research that has been done by Setya Purnama (2005) who found debt to individual capital ratio (DER) has not significant effect on the bond yield.
CONCLUSION
1. The interest rate has effect on return on bond interest rate. In consistence with the direction of positive coefficient, it is indicating that if there is an increase in the SBI interest rate, the return on on bond interest rate will be mounting.
2. The capital structure as measured by debt-to-equity ratio (DER) has effect on the return of bond interest rate received. In consistence with the direction of positive coefficient, it is indicating that if there is an increase in debt to equity ratio (DER), the bond interest rate received will be rising, and vice versa.
3. The bond level control variable and the size of the company have effects on the bond corporation value in the Indonesia Stock Exchange. In consistence with the direction of positive coefficient, it is indicating that if there is an increase in path and size of the company, the company value will be mounting.
REFERENCES
Ahmad, Kamaruddin, (2004), Dasar-Dasar Manajemen Investasi dan Portofolio, Edisi Revisi, Cetakan Kedua, Penerbit Rineka Cipta, Jakarta.
Amihud, Yakov dan Haim Mendelson, (1991), “Liquidity, Maturity, and Yield on US Treasury Securities”, The Journal of Finance, Vol. 46 No. 4, p. 1411- 1425.
Ang, Robbert, (1997), Buku Pintar: Pasar Modal Indonesia, Mediasoft Indonesia.
Arifin, Zainal, (2005), Teori Keuangan & Pasar Modal, Edisi Pertama, Cetakan Pertama, Penerbit Ekonisia, Yogyakarta. Bapepam, (2003), Panduan Investasi di Pasar Modal Indonesia, Jakarta.
Bodie, Zvi, Kane, Alex dan Markus, Alan J, (2006), Investasi, Buku 2, Edisi 6, Salemba Empat, Jakarta.
Bhojraj, Sanjeev dan Sengupta, Partha, (2003), Effect of Corporate Governance on Bond Ratings and Yields: The Role of Institusional Investor and Outside Directors, The Journal of Business, Vol. 76, No. 3, h. 455-475.
Bremmer, Dale dan Randall Kesselring, (1992), “The Relationship Between Interest Rates and Bond Prices : A Complete Proof ”, American Economist, Vol. 36 No. 1, p. 85-86.
Chakravarty, Sugato dan Asani Sarkar, (1999), “Liquidity in US Fixed Income Markets : A Comparison of the Bid-Ask Spread in Corporate, Governent and Municipal Bond Markets”, Working Paper, didownload dari www.papers.ssrn.com Crabtree, Aaron D dan Maher, John J, (2005), Earning Predictability, Bond Ratings and Bond Yields, Review of Quantitative
Finance And Accounting, Vol. 25, h. 233-253.
Darmadji, Tjiptono dan Fakhruddin, Hendy M, (2001), Pasar Modal di Indonesia Pendekatan Tanya Jawab, Edisi Pertama, Penerbit Salemba Empat, Jakarta.
Elton, Edwin J. dan T. Clifton Green, (1998), “Tax and Liquidity Effects in Pricing Government Bonds,” The Journal of Finance, Vol. 53 No. 5, p. 1533-1562.
Ericsson, Jan dan Reneby, J. (2001), “Estimating Structural Bond Pricing Models”, Working Paper, didownload dari
www.papers.ssrn.com
Fabozzi, Frank J, (2000), Manajemen Investasi, Edisi Pertama, Salemba Empat, Jakarta.
Fabozzi, Frank J, (2000), Bond Markets, Analysis dan Strategies, Fourth Edition, Prentice Hall, New Jersey. Francis J. K dan Richard W. T, (1992), Schaum’s Outline of Investment, Mc Graw Hill, Inc, New York. Gujarati, Damodar. (2009), Dasar-Dasar Ekonometrika.Jakarta: Erlangga.
Hamid, Abdul, Rodoni, Ahmad, W, Dewi Titi dan Hidayat, Edi, (2006), “Analisis Durasi dan Convexity Untuk Mengukur Sensitivitas Harga Obligasi Korporasi Terhadap Perubahan Tingkat Suku Bunga (Studi Empiris Pada Obligasi – Obligasi Di Indonesia”, Jurnal Maksi, Vol. 6, No. 2, h. 117-142.
Hulwati, (2004), Obligasi Syariah Di Malaysia: Legitimasi Kontrak Bay AL Inah dan Bay Al-Dayn, Simposium Nasional Sistem Ekonomi Islam II, h. 235-248.
Indra, A. Zubaidi, (2006), Faktor-Faktor Fundamental Keuangan Yang Mempengaruhi Resiko Saham, Jurnal Bisnis & Manajemen, Vol. 2, No. 3, h. 239-256.
Jewell, Jeff dan Livingston, Miles, (2000), The Impact of a Third Credit Rating on Pricing of Bond, The Journal of Fixed Income, Vol. 10, No.3, h. 69-85.
Kadir, Syamsir, (2007), Pengaruh Faktor Struktural dan Fundamental Ekonomi Terhadap Tingkat Imbal Hasil Obligasi Korporasi di Pasar Modal Indonesia, Disertasi, Tidak dipublikasikan, Program Doktor Ilmu Ekonomi, UNPAD. Keown, Arthur J, Martin, John D, Petty, J William dan Scott, David F, (2004), Manajemen Keuangan: Prinsip-prinsip
dan Aplikasi, Jilid 1, Edisi Kesembilan, PT. Indeks, Jakarta.
Kempf, Alexander dan Maliese Uhrig-Homburg. (2000), “Liquidity and Its Impact on Bond Prices”, Schmalenbach Business Review, Vol. 52, p. 26-44.
Khurana, Inder K dan Raman, K. K, (2003), Are Fundamentals Priced in The Bond Market?, Contemporary Accounting Research, Vol. 20, No.3, h. 465-494.
Kusuma, Hadri dan Asrori, (2005), “Pengaruh Durasi dan Konveksitas Terhadap Sensitivitas Harga Obligasi”, Sinergi, Vol. 7, No. 2, h. 35-52.
Machfoedz, Mas’ud, (1994), Financial Ratio Analysis and The Prediction of Earnings Changes in Indonesia, Kelola, Vol. 3, No. 7, h. 114-137.
Miswanto dan Husnan, Suad, (1999), The Effect of Operating Leverage, Cyclicality and Firm Size on Business Risk, Gadjah Mada International Journal of Business, Vol. 1, No. 1, h. 29-43.
Nainggolan, Pahala dan Hanum, Latifah, (2005), Prediksi Gagal Bayar Obligasi Tahun 1998-2004 Dengan Analisis Diskriminan dan Regresi Logistik, Jurnal Bisnis & Manajemen, Vol. 5, No. 1, h. 79-90.
Nurfauziah dan Setyarini, Adistien Fatma, (2004), Analisis Faktor-Faktor yang Mempengaruhi Yield Obligasi perusahaan (Studi Kasus Pada Industri Perbankan dan Industri Finansial), Jurnal Siasat Bisanis, Vol. 2, No. 9, h. 241-256. Racette, G.A. dan W.G. Lawellen, (1995), “Corporate Debt Coupon Strategies”, National Tax Journal, Vol. XXIX, p.
165-177.
Rahardjo, Sapto, (2003), Panduan Investasi Obligasi, PT. Gramedia Pustaka Utama.
Ratih, Sulistiastuti Dyah, (2006), Saham dan Obligasi, Edisi Pertama, Cetakan Kedua, Penerbit UAJY, Yogyakarta. Riska Ayu Hapsari, (2013), Kajian Yield To Maturity (YTM) Obligasi Pada Perusahaan Korporasi, Accounting Analysis
Rizzi, Joseph V, (1994), Determining Debt Capacity, Commercial Lending Review, Vol. 9, No. 2, h. 25-34.
Rosengren, E.S. (1993), “Default of Original Issue High-Yield Convertible Bond”, The Journl of Finance, No. 48 No. 1, p. 345-362.
Samsul, Mohamad, (2006), Pasar Modal & Manajemen Portofolio, Penerbit Erlangga, Jakarta.
Sartono, Agus, (2001), Manajemen Keuangan Teori & Aplikasi, Edisi Keempat, Cetakan Pertama, BPFE Yogyakarta, Yogyakarta.
Sengupta, Partha, (1998), Corporate Disclosure Quality and The Cost of Debt, The Accounting Review, Vol. 73, No. 4, h. 459-474.
Setyapurnama, Raden Y. S, (2005), Pengaruh Corporate Governance dan Kualitas Audit Terhadap Peringkat dan Yield Obligasi, Tesis, Tidak dipublikasikan, Program Ilmu Akuntansi, UGM.
Sharpe, William F, Alexander, Gordon J dan Bailey, Jeffery V, (2005), Investasi, Edisi Keenam, Jilid 1, PT. Indeks Kelompok Gramedia, Jakarta.
Suharli, Michell, (2005), Studi Empiris Terhadap Dua Faktor Yang Mempengaruhi Return Saham Pada Industri Food & Beverages di Bursa Efek Jakarta, Jurnal Akuntansi dan Keuangan, Vol. 7, No. 2, h. 99-116.
Sunariyah, (2004), Pengantar Pengetahuan Pasar Modal, Edisi Keempat, UPP AMP YKPN, Yogyakarta.
Suripto, Bambang, (1999), Pengaruh Karakteristik Perusahaan Terhadap Luas Pengungkapan Sukarela Dalam Laporan Tahunan, SNA II Malang, h. 1-15.
Tandelilin, Eduardus, (2007), Analisis Investasi dan Manajemen Portofolio, Edisi Pertama, Cetakan Kedua, BPFE, Yogyakarta.
Panjaitan, Yunia, Dewinta Oky dan K, Sri Desinta, (2004), Analisis Harga Saham, Ukuran Perusahaan dan Risiko Terhadap Return Yang Diharapkan Investor Pada Perusahaan Saham Aktif, Balance, Vol. 1, h. 56-72.
Purwanto dan Haryanto, Agus, (2004), Pengaruh Perkembangan Informasi Rasio Laporan Keuangan Terhadap Fluktuasi Harga Saham dan Tingkat Keuntungan Saham, Jurnal Akuntansi & Auditing, Vol. 1, No.1, h. 17-33.
Priambodo, R. E. A, (2006), Relevansi ORI Secara Makro dan Mikro, Usahawan, No. 11, TH. XXXV, November, h. 42-47.
Thompson, G Rodney dan Vaz, Peter, Dual Bond Ratings: A test of The Certification Function of rating Agencies, The Financial Review, Vol. 25, No. 3, h. 457-471.
Van Horne, James C dan Wachowicz, John M, (1997), Prinsip – Prinsip Manajemen Keuangan, Edisis Kesembilan, Buku Satu, Salemba Empat, Jakarta.
Wallace, R S Olusegun, Naser, Kamal dan Mora, Araceli, The Relationship Between The Comprehensiveness of Corporate Annual Reports and Firm Characteristics in Spain, Accounting & Business Research, Vol. 25, No. 97, h. 41-53. Weston, J. Fred dan Copeland, Thomas. E, (1994), Manajemen Keuangan, Jilid 1, Edisi Kedelapan, Penerbit Erlangga,
Jakarta.
Yolana, Chastina Dan Martani Dwi, (2005), Variabel-Variabel Yang Mempengaruhi Fenomena Underpricing Pada Penawaran Saham Perdana Di Bej Tahun 1994 – 2001, SNA 8 Solo, h. 538-553.
Yudistira, Donsyah, (2003), Pasar Obligasi Menyimpan Bom Waktu?, Swa, 21, XIX, Oktober, h. 80.