2016 International Conference on Information Technology Systems and Innovation (ICITSI) Bandung – Bali, October 24 – 27, 2016
ISBN: 978-1-5090-2449-0
Improvement Of Production System Efficiency and
Production Capacity Using Line Balancing Method
aSyerly Setiana, bSevenpri Candra, aAditya Andika aDepartment of Industrial Engineering
bDepartment of Management
Bina Nusantara University Jakarta, Indonesia [email protected]
Abstract— This study discusses the research results conducted on an Indonesian plastic manufacturing company. The distribution of the workload in a production process needs to be calculated so that the company is able to achieve the target of production. This research was conducted to improve the efficiency of production systems and the production capacity of the company so that the company is able to meet production targets. The method used in this study is line balancing. Time study method is conducted to calculate cycle time and then forecasting method is utilized to determine production target and required cycle time. After that, 3 methods of line balancing: ranked positional weights, Moodie Young and new bidirectional is used. The result of the line balancing method shows that the best methods are Moodie Young and new bidirectional with the efficiency of 82.97%, much higher from the current state, which is only 48.89%. The number of workstation is also decreased from 9 to 7. The production also increased from 780.41 pieces per day to 1,030.07 pieces per day.
Keywords— line balancing; ranked positional weight, Moodie & Young; New Bidirectional method; plastic manufacturing
I. INTRODUCTION
In this globalization era, many changes and developments that occurred changed the mindset and forcing companies to be more advanced. Therefore it is important for the company to provide the best product or service to the consumer so that the company can compete in the market.
Operations management is a set of activities that produce value in the form of goods or services by transforming inputs into outputs [1]. If the division of the workload of each work station is different, so the production process can be interrupted.
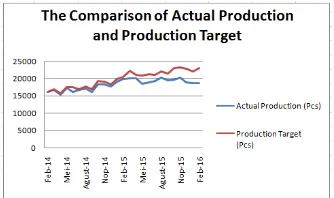
Method that can be used to balance the production line is the line balancing. Line balancing is a technique to spread the load of work in all processes in the cell or value stream to remove bottlenecks [2]. An Indonesian plastic manufacturing company is facing problems in its plastic bag production line. Fig. 1. shows that the company still difficult to meet production targets, where the amount of production per month is always lower than the production target should be.
Non-fulfillment of production targets is because there is a division of the workload that is not balanced in each work station.
Fig. 1. Comparison of Actual Production and Production Target
The condition forces the company to add overtime to meet production targets. This ultimately makes the company overtime hours increased and exceeded the company's policy that only allows a maximum of 2 hours.
The company needs to balance the line to make its line more efficient.
II. LITERATURESTUDY
A. Time Study
The cycle time (cycle time) is the period of time required to complete an operation. Calculation of the cycle time can use the following formula [3]:
C =NT
(1) Where:
C = Cycle Time; T = Production time per day; N = Total Production per day
Normal time can be calculated using this formula [4]:
Normal Time = Cycle Time x % Performance100%
(2)
The standard time is the overall time required by a worker or operator who has average ability to complete a job. Standard time can be calculated using this formula [4]:
Standard Time = normal time x 100%-% allowance100%
(3)
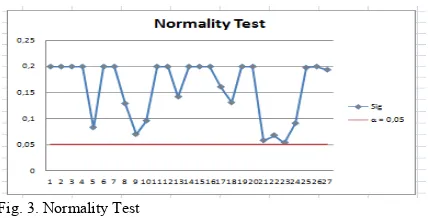
To determine the normal distribution of data, Kolmogorov-Smirnov test was used. If the value of the data significance is greater than the error level, which usually is 5% then the data is normal [5].
To conduct uniformity test, Upper control limit (UCL) and lower control limit (LCL) is calculated by using the following formula [4]:
UCL = Mean + 3 Standard Deviation (4) LCL = Mean- 3 Standard Deviation (5)
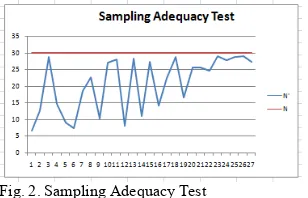
Test adequacy observation data needs to be done in order to know whether the data that have been taken have been sufficient. The formula for calculating the data adequacy test are as follows [4]:
N’= Number of observations / observations should be made N= number of observations that have been made
Xi= Data element i
K = Confidence level = 95%, k = 2 S = Level of accuracy= 5% = 0.05 If N’<N then data are adequate.
B. Line Balancing
The efficiency of the line is the calculation of the efficiency of the existing work time as a result of the line balancing. Can be calculated using the formula [3]:
HE = N.C x 100%T
(7) Where:
HE = Line Efficiency; N = Total work station; C = cycle time; T = Work time per day
Smoothing index is an index that describes the smoothness of line balancing. The minimum value is 0. The following formula is used [6]:
STmax= Maximum time of work stations
STi= Minimum time of work station
Balance delay is the calculation of inefficiencies caused by the imperfection of work allocation between work stations [7]:
BD =
Total work station; Tc = Maximum Cycle Time
Line balancing methods:
1. Rangked Positional Weights (RPW)
RPW method can be explained as follows [8]: 1. Calculate the desired speed.
2. Create a preliminary matrix based on network assembly work
3. Calculate the weight of each operation based on the amount of time the operation and the operations that followed.
4. Sort operations ranging from the position of greatest weight to the weight of the smallest position.
5. Place operations at the work station with weights ranging from the largest position until the weight of the smallest position with the criteria that total operating time is smaller than the given track speed.
6. Calculate the average efficiency of the work stations are formed
7. Use trial and error procedure to seek the imposition of which would produce an average efficiency greater than average efficiency at the point 6 above.
8. Repeat step 6 and 7
2. Moodie Young
Moodie Young method has two phases [9]: The first phase:
The second phase:
1. The identification of a work station and a work station the smallest.
2. Calculate GOAL = (Max Cycle Time – Min Cycle Time)/2 3. Identification of a working element contained in the work
station with the maximum time, which has a smaller time than GOAL, move that element if when it was moved to the work station, it does not violate the precedence diagram.
4. Move the working elements.
5. Repeat until no more evaluation elements of work that can be moved
3. New Bidirectional
New Bidirectional method consists of four steps [10]:
1. Determining the critical path, then separate the elements of work that is in the critical path (Scp) and which are not
(S’cp)
2. Creating a temporary work station (FS and BS)
3. Allocate element of the critical path that has no predecessor to the FS and which does not have followers to BS, allocate elements not to exceed the cycle time.
4. Calculate the value Wf and Wb to determine the permanent work stations. If Wf ≤ Wb then make permanent FS station and vice versa. Complete this step is repeated until all the elements are allocated. Stop until FS = BS.
III. RESEARCHMETHOD
The study began by literature study, accompanied by preliminary observations. Data were collected by interview, observation and literature study. The analysis method used is by using time study, forecasting, and line balancing are integrated with each other. Time data of each work element is found, then do the normality test, uniformity test and test the adequacy of using time study, then the data cycle time obtained is used to calculate the efficiency of production systems now with the method of line balancing, after it to make the proposal takes a new cycle in which this time can meet the demand, so do forecasting demand in advance using the methods of forecasting and can then be calculated the cycle time required. After the cycle time required is obtained then calculate the proposed system with line balancing method that consists of 3 methods: RPW, Moodie Young, and New Bidirectional. Afterwards, the best method is selected based on the results.
IV. RESULTANDDISCUSSION
A. Data Of Work Element Time
Preliminary data needed to perform the calculation of line balancing is to collect the data elements of the work and time of each element work. After observation there are 27 elements of work with 9 work stations for plastic bag production process. Data elements of work can be seen in TABLE I.
TABLE I. WORK STATION AND WORK ELEMENT
Work Stations No Work Element
A (Cord)
1 Fetch cord
2 Measuring the length of the cord
3 Cutting the cord
4 Merger cord
5 Combustion end of the cord
6 Put the cord to a container
B (Cutting)
7 Put plastic roll to cutting manual
8 Plastic Length Measurement
9 The process of cutting manual plastic roll
10 Put the plastic to container
C (Pressing)
11 Setting press machine
12 Pressing the plastic
13 Put the result of pressing into the container
D
(Perforations) 14 Perforations plastic
E (Sewing)
15 Installation of the needle into the cord
16 Sewing
17 Put the sewing results to container
F (Installation of
Cover Cord)
18 Fetch the ends of the rope
19 Installation of the cover to the end of the cord
20 Put the plastic into container
G (Folding)
21 Checking product
22 Plastic folding
23 Put the results folds into a container
H (Packaging)
24 Fetch packaging
25 Insert plastic to the packaging
I (Sealing)
26 Setting heat sealer machine
27 The process of sealing the packaging
B. Normality Test, Uniformity and Sampling Adequacy Test
Below are the results of the sampling adequacy test, normality test, and uniformity test of the data.
Fig. 2. Sampling Adequacy Test
Fig. 3. Normality Test
In Fig. 3, sig > α then the data is a normal data.
Fig. 4. Uniformity Test
In Fig. 4, UCL> Mean > LCL, then the data is uniform.
C. The Calculation of Standard Time
For the calculation of line balancing required standard time of each work elements. To calculate the standard time it takes the average cycle time, performance rating, the normal time and work allowance. Calculation of normal time using a performance rating of 8% and the computation time using the standard allowance of 14%. The results can be seen in the standard time column of TABLE II, TABLE III, and TABLE IV.
D. The Efficiency of Current Production System
Then, the cycle time calculation system is now calculated using total production of one year of data generated by the company which is 232.563 pieces, then divided by the number of days in the year (298 days) to obtain estimates of units produced per day. So total unit produced per day is 232,563/298 = 780.41 pcs plastic bag/ day.
Calculation of the present production system cycle times are as follows:
Cycle time= 73.81 Second.
E. Forecasting Calculation
Forecasting calculation is needed to calculate the cycle time that needed. Trend analysis forecasting is used. From the forecasting result, production rate per day is 307,993/299 = 1030.07 pcs. Then, we can calculate the cycle time that needed: C = T/N = 57,600/1,030.07 = 55.92 second.
F. Line Balancing RPW Result
Here in Table 2, is the result of weighting by using the method of RPW.
TABLE II. RPW RESULTS
Station Element Weight Standard Time
Total Time ( Second)
A
7 258.78 10.12
46.29 8 258.78 9.85
9 248.93 13.23
10 235.70 2.74
1 233.59 3.00
11 232.96 7.35
B
2 230.59 12.09
40.02 12 225.61 21.46
3 218.50 6.48
C
4 212.02 19.21
45.63 13 204.15 3.11
14 201.04 23.31
D
5 192.82 12.30
22.96 6 180.52 2.79
15 177.73 7.87
E
16 169.85 50.43
54.47 17 119.43 2.54
18 116.88 1.49
F
19 115.39 20.88
36.55 20 94.51 2.54
21 91.97 13.13
G
22 78.84 46.66
51.4 23 32.18 2.67
24 29.51 2.07
H
25 27.44 13.50
27.44 26 13.94 9.55
27 4.38 4.38
It can be seen in TABLE II that there are 8 work stations, the total allocated time of each work station can not exceed the cycle time which is 55.92 second.
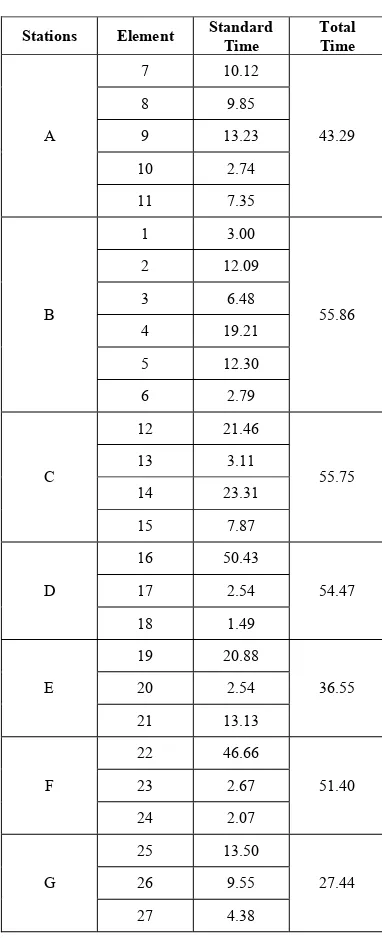
G. Line Balancing Moodie Young Result
TABLE III. MOODIE YOUNG RESULT
Stations Element Standard Time
TABLE III shows that there are 7 work stations, the total time of each work station can not exceed the cycle time which is 55.92 second.
H. Line Balancing New Bidirectional Result
One new method was developed to solve the problems of the balance of the new line is bidirectional; the method is based with the concept of critical path method.
Critical path is work elements that have slack value 0. From this experiement, work elements that have slack value 0 are work element 7, 8, 9, 10, 11, 12, 13, 14, 15, 16, 17, 18, 19, 20, 21, 22, 23, 24, 25, 26, 27. New Bidirectional method results can be seen in TABLE IV.
TABLE IV. NEW BIDIRECTIONAL RESULT
Work Station Work Element
The work elements in permanent station from TABLE IV become work station. From the iteration, there are FS and BS. FS consist of work elements that is position in the critical path and BS consist of work elements that is position not in the critical path. And then the total time of FS ( T(FS)) and BS (T(BS)) must not more than the cycle time that needed. T(FS) and T(BS) can be use to calculate the slack time of FS ( Wf)
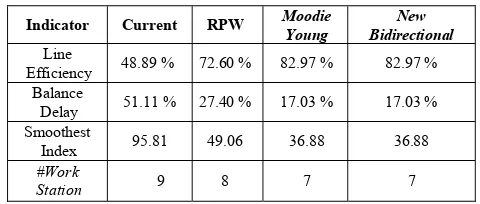
I. Line Balancing Method Comparison
TABLE V. LINE BALANCING COMPARISON
Indicator Current RPW Moodie Young
New Bidirectional Line
Efficiency 48.89 % 72.60 % 82.97 % 82.97 % Balance
Delay 51.11 % 27.40 % 17.03 % 17.03 % Smoothest
Index 95.81 49.06 36.88 36.88
#Work
Station 9 8 7 7
It can be clearly seen from TABLE V that when the company implemented Moodie Young or New Bidirectional method, the line efficiency will increase from 48.89% to 82.97%. The balance delay will be reduced from 51.11% to 17.03%. The number of work stations will be reduced from 9 stations to 7 stations, which means the number of labor required can also be reduced.
V. CONCLUSIONSANDRECOMMENDATION
A. Conclusions
1. Based on the line balancing method comparison, the best methods are Moodie Young method or New Bidirectional method. The two methods can increase the line efficiency from 48.89% to 82.97%, reduce the balance delay from 51.11% to 17.03%, and reduce the number of work stations from 9 work stations to 7 work stations.
2. Based on this research, it is possible to obtain a production target of 1,030.07 pieces of plastic bag per day. The time it takes to produce one piece of plastic bag is 55.92 seconds.
B. Recommendations for Future Research
In this study, researchers did not touch the aspects of the production layout. It is recommended for the company to conduct research on the production layout to further improve productivity and to enable better worker movement in the production facility.
REFERENCES
[1] J. Heizer and B. Render, Operations Management. New Jersey: Prentice Hall, 2011.
[2] N. Kumar and D. Mahto, “Assembly Line Balancing: A Review of Developments and Trends in Approach to Industrial Application,” Global Journal of Researches (G), vol. 13(2), pp. 29-50, 2013.
[3] M. Güner, Ö. Yücel, C. Ünal, ‘‘Applicability Of Different Line
Balancing Methods In The Production Of Apparel,” Tekstil Ve Konfeksiyon, vol. 23(1), pp. 77-84, 2013.
[4] S. Wignjosoebroto, Ergonomi Studi Gerak dan Waktu. Surabaya: Guna Widya, 2008.
[5] A. Apriyono and A. Taman, “Analisis Overreaction Pada Saham Perusahaan Manufaktur Di Bursa Efek Indonesia (Bei) Periode 2005-2009,” Jurnal Nomina, Vol. 2(2), 2013.
[6] V.V. Pachghare and R. S. Dalu, “Assembly Line Balancing Methods–A Case Study,” International Journal of Science and Research, vol. 3(5), May 2014.
[7] L. Gozali, L. Widodo and M. Bernhard, “Analisa Keseimbangan Lini Pada Departemen Chassis PT Toyota Motor Manufacturing Indonesia Dengan Algoritma Ant Colony, Rank Positional Weight, dan Algoritma Genetika,” Jurnal Teknik Industri, vol. 2(2), pp. 119-126, July 2012. [8] H. Kusuma, Manajemen Produksi. Yogyakarta: ANDI, 2009.
[9] L. Natalia, S. Sinulingga and I. Siregar, “Penyeimbangan Lintasan Pada Perakitan Transformator Dengan Metode Moodie Young Dan Comsoal Pada PT. XYZ,” e-Jurnal Teknik Industri FT USU, vol. 3(4), pp. 35-52, November 2013.