14 CHAPTER 3 RESEARCH METHODS
3.1 Research Field
This research project is in the field of human genetics predominantly molecular
genetics integrated with ophthalmology.
3.2 Research Location
Sample collection and DNA isolation was performed in the Center for Biomedical
Research (CEBIOR), Medical Faculty of Diponegoro University, Semarang, Indonesia.
Mutational analysis and functional studies were conducted at the Department of Human
Genetics of the Radboud University Medical Center in Nijmegen (The Netherlands).
3.3 Research Period
This research was accomplished from June 2013 to November 2014. Samples
collection and DNA extraction were done in the 1st semester (June to November 2014), while
diagnostic and functional study were done during the 2nd and 3rd semester (November
2014-2015).
3.4 Research Design
This study consists of diagnostic study and functional study. The diagnostic study is a
descriptive cross-sectional study whereas the functional study is in-vitro study.
3.5 Population and Sample
3.5.1 Population
Individuals with congenital blindness from Low Vision Center, Yogyakarta and
Wiyata Guna special school for blindness (Bandung) were included in the diagnostic study.
Interview with patients or available family members and pedigree drawing were carried out to
acquire information regarding ethnical background and consanguinity.
3.5.2 Sample
Samples were chosen from the congenital blindness patients who clinically were
15
old. Their parents and related family were also included in the study in order to attain the
family history and blood samples for carrier testing and segregation analysis. Informed
consent were collected from the patients and family members involved in this study following
the Declaration of Helsinki.
3.5.2.1 Inclusion Criteria
Patients with congenital blindness, sensory nystagmus, abnormal retinal appearance,
and no other causes of congenital blindness such as infection, congenital cataract, glaucoma,
and trauma, were included in this study. The diagnosis of LCA was given by two
ophthalmologists from the history taking and eye examination. Electroretinogram was not
performed due to limited facility.
3.5.2.2 Excluded patient
One patient has been excluded because he refused to do the venous sampling.
3.6 Research Variable
3.6.1 Diagnostic Studies
Variable: Mutation
Scale: Nominal
3.6.2 Functional Studies
Variable: Ratio between aberrant and normal transcript, cilium length, and protein level.
Scale: Ratio.
3.7 Diagnostic Studies: Mutational Analysis of Indonesian LCA Patients
3.7.1 DNA Isolation
The method used to extract the DNA from venous sampling was salting out method as
16 3.7.2 Primer Design
The primers were designed using Primer3Plus software,
http://www.bioinformatics.nl/cgi-bin/primer3plus/primer3plus.cgi/ . The optimum primer size
is 20, and the optimum annealing temperature is 59oC. GC content was kept around 40-60%.
3.7.3 Polymerase Chain Reaction (PCR)
Two types of PCR were conducted, amplification refractory mutation system (ARMS)
and regular PCR to amplify the interest gene for further investigation using Sanger
sequencing. There were two regular PCR methods used in this study, standard PCR and touch
down PCR.
This study used standard PCR with universal PCR mix consist of: 2,5 µl PCR buffer
10x (Roche), 0,5 µl dNTPs (10 mM), 0,5 µl forward and reverse primer (10 pmol), 0,5 µl
polymerase (5 U/µl), and 2,5 µl DNA sample. The amount of H2O and MgCl2 were adjusted
for each primer condition. Universal PCR condition used in this study was 3 minutes at 94oC,
30 seconds for denaturation at 94oC, 30 seconds for annealing which depends on each PCR
condition, and 30 seconds of elongation at 72oC. Three last steps were repeated in 35 times of
cycle and ended at 72oC for 5 minutes. PCR conditions and primers sequence can be found in
appendix 1-5.
Touch down PCR was used to decrease unspecific product by decreasing the annealing
temperature every second cycle from the upper limit, which is determined by the melting
temperature of the primer.43
3.7.3.1 ARMS-PCR
ARMS-PCR was done to investigate the presence of mutation in CEP290
(c.2991+1655A>G;p.C998*) and CRB1 (c.3914C>T;p.P1305L) gene. ARMS-PCR for wild
type CEP290 was performed under standard PCR while touch down PCR was performed for
c.2991+1655A>G mutation.
3.7.3.2 Regular PCR
CRB1, GUCY2D, and AIPL1 genes were amplified by standard and touch down PCR.
Two primer sets were used overlapped each other to encompass exon 7 of CRB1. We use thee
17 3.7.4 Sanger Sequencing
PCR products were sent to sequence facility using ABI PRISM Big Dye Terminator
Cycle Sequencing V2.0 Ready Reaction kit and the ABI PRISM 3730 DNA analyzer from
Applied Biosystem. Purification of PCR product was performed before sending to the
sequence facility, either using Exo1 and FastAP enzyme or NucleoSpin Gel and PCR
Clean-Up (Macherey-Nagel).
3.7.5 Restriction Fragment Length Polymorphism (RFLP)
Mutations found were analyzed with restriction enzyme analysis (RFLP) using HpaI
and BsaHI enzymes (New England Biolabs, Ipswich, MA) designed using NEBcutter
software http://tools.neb.com/NEBcutter2/ in Indonesian normal population. HpaI enzyme
cuts DNA with specific sequence CCGG, resulting in three bands (262 bp, 156 bp, and 82 bp)
in RFLP gel result with wild-type variant of AIPL1exon 6 while BsaHI enzyme cuts
GRCGYC sequence, resulting in 327 bp and 109 bp bands in RFLP gel result containing
c.33G>C variant of AIPL1exon 1. RFLP was performed in approximately 190 Indonesian
control samples.
3.8 Functional Studies: Optimization of Antisense Oligonucleotide (AON) Therapeutic Approach for LCA
3.8.1 Cell Culture
Fibroblast cells from CEP290-associated LCA patient were cultured in DMEM
medium (Sigma, St Louis, MO) containing 20% (vol/vol) fetal calf serum (Sigma), 10 U/µl
penicillin and 10 µg/µl streptomycin (Sigma), and 1% sodium pyruvate. The cells were kept
at 37oC incubator with 5% CO2. Twice a week, the cells were passed in 1:3 dilutions and
grow in fresh medium.
3.8.2 Transfection
Transfection mixtures consisted of 100 µl of Opti-MEM, AON in a desired
concentration, and 3 µl FuGENE HD transfection reagent (Promega, Madison, WI). The
mixtures were incubated for 20 minutes at room temperature and were added to the cells. For
RNA and immunocytochemistry studies, the number of the cells was 150.000-300.000 cells,
18
3.8.3 RNA Isolation and Reverse Transcription-PCR
Fibroblast cells were harvested and rinsed with 1x-phosphate-buffered saline (1x PBS)
before RNA isolation. Total RNA was isolated using NucleoSpin RNA II isolation kit
(Machery Nagel, Duren, Germany), following the manufacturer’s protocol (appendix 7). cDNA synthesis was performed using the iScript cDNA synthesis kit (Bio-Rad, Veenendaal,
the Netherlands), and the cDNA was amplified by standard PCR condition enhanced with
Q-solution (Qiagen, Hilden, Germany). Primers used in this PCR are listed in the appendix 6.
Primers for CEP290 encompass exon 26 and exon 27. Subsequently, PCR products were
resolved in the 1.6% agarose gel. In addition, PCR of ACTB was done to normalize samples.
Pictures were taken by ImaGoTM and bands were quantified using ImageJ software.
3.8.4 Western Blot
Fibroblast cells were collected from 10cm2 plates and washed with 1xPBS. The cell
pellets were homogenized in RIPA buffer (50 mM TRIS pH 7.5, 1 mM EDTA, 150 mM
NaCl, 0.5% Na-Deoxycholate, 1% NP40 plus protease inhibitors) sonicated, and centrifuged.
The soluble fraction was transferred into a new tube, and protein concentration was measured
using BCA protein assay (Thermo Scientific, Rockford, IL). A mixture of 100 µg of total
protein was prepared, 80 µg of protein were loaded onto a NuPAGE 3-8% Tris-Acetate gel
(Life Technologies, Carlsbad, CA) for CEP290 immunodetection and 20 µg onto a NuPAGE
4-12% Bis-Tris Gel (Life Technologies) for Tubulin detection. Proteins were transferred to
PVDF membrane, blocked in 5% non-fat milk in 1xPBS solution and incubated with mouse
anti-tubulin (1:2000) and rabbit anti-CEP290 (1:1000) in 0.5% blocking solution for 4 days at
4 oC. Incubation of secondary antibodies using goat anti-rabbit or –mouse antibodies was
done at 1:20.000 for 1 hour. Membrane was washed three times for 10 minutes between each
antibody incubation with PBS-Tween 0.1%. Blot was developed using Odyssey infrared
imaging system (Li-Cor, Lincoln, NE). Image analysis was done using ImageJ (National
Institutes of Health, Bethesda, MA).
3.8.5 Immunocytochemistry
Fibroblast cells were grown on coverslips, transfected as described previously and
incubated in serum-free medium to induce cilium formation. Cells were washed in 1x-PBS
and fixed in 2% paraformaldehyde. Cells were permeabilized in 1% TritonX100 in 1x-PBS.
Samples were blocked in 2% BSA in 1x-PBS for 20 minutes to prevent unspecific binding of
19
polyclonal antibody, 1:300) and acetylated tubulin (mouse monoclonal antibody, 1:1000).
Goat anti-rabbit and –mouse were used as secondary antibodies at 1:500 in 2% BSA.
Coverslips were washed between incubations 3 times for 5 minutes in 1x-PBS, and rinsed in
H2O before mounting in Vectashield compound containing DAPI. Images were taken using
Axio Imager (Zeiss, Oberkochen, Germany), processed with ZEN software (Zeiss) and
analyzed using imageJ software (National Institutes of Health).
3.8.6 Statistical Analysis
Blind analysis of the immunocytochemistry was performed by counting 100 cells per
condition at minimum. Unpaired Student’s t-test was used for statistical analysis using GraphPad Prism 6 software.
3.9 Research Flow
Two workflows were used, one for diagnostic analyses and the other for functional
studies. Diagnostic analyses were done by amplifying several amplicons, which together
20 3.9.1 Diagnostic Study Workflow
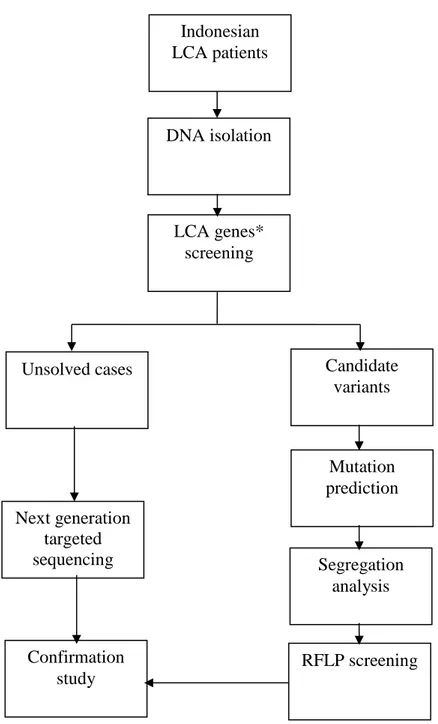
Figure 5. Schematic representation of diagnostic study workflow. *LCA genes screened in this study are
CEP290 (c.2991+1655A>G), CRB1 (exon 7 & 9), GUCY2D (exon12), and AIPL1 (exon 6). CRB1 (p.P1305L)
also included as a frequent mutation in Indonesian retinal degeneration patients from a previous study.44 RFLP screening
Confirmation study
Indonesian LCA patients
DNA isolation
LCA genes* screening
Unsolved cases Candidate
variants
Mutation prediction
Segregation analysis Next generation
targeted sequencing
21 3.9.2 Functional Study Workflow
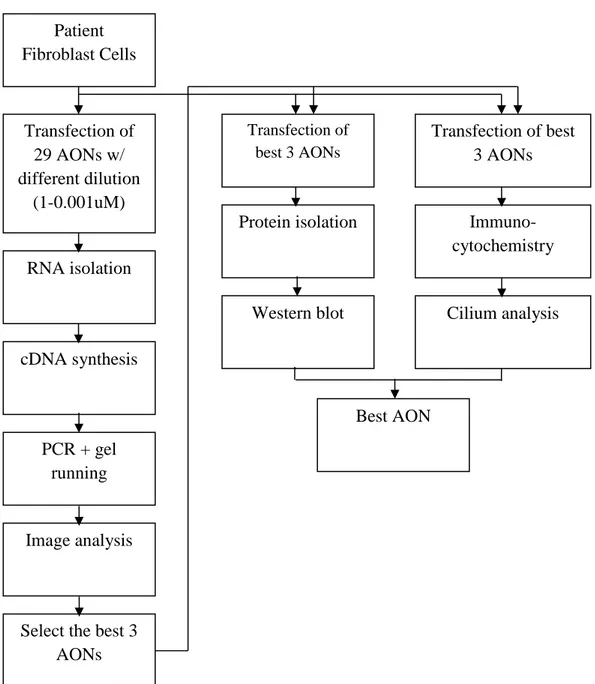
Figure 6. Workflow for functional studies to optimize the potential of AON-based approach.
CEP290-associated patient fibroblast cells were used to test 29 AON with different sequences. In addition, WT cells from
healthy persons were used as a normal control in the Western blot and cilium analysis. Selection of 3 best AONs
was done at RNA levels by treating the cells with different dilutions (1 µM, 0.1 µM, 0.01 µM, 0.005 µM, and
22 3.10 Data Analysis
Data analysis for diagnostic study is descriptive and for functional studies is
experimental.
3.11 Research Ethics
Informed consents were signed by affected individuals or the caregiver. Ethical
clearance was approved by Institutional Review Board of Faculty of Medicine and Kariadi