ENVIRONMENTAL IMPACT ASSESSMENT OF ROSIA JIU OPENCAST AREA USING
AN INTEGRATED SAR ANALYSIS
V. D. Poenarua, *, I. F. Dana Negula a, A. Badea a , R. Cuculici b
a Romanian Space Agency, 21-25 Mendeleev Str., 010362, District 1, Bucharest, Romania - (violeta.poenaru, iulia.dana, alexandru.badea)@rosa.ro
b Dept. of Regional Geography and Environment , Faculty of Geography, Bucharest University, Bd. M. Kogălniceanu 36-46, Sector 5, 050107, Bucharest, Romania, roxanacuculici@yahoo.
Commission VIII, WG VIII/1
KEY WORDS: Environment, Rosia Jiu mining area, DInSAR analysis, multi-temporal SAR data, TerraSAR-X Staring Spotlight Mode
ABSTRACT:
The satellite data provide a new perspective to analyse and interpret environmental impact assessment as function of topography and vegetation. The main goal of this paper is to investigate the new Staring Spotlight TerraSAR-X mode capabilities to monitor land degradation in Rosia Jiu opencast area taking into account the mining engineering standards and specifications. The second goal is to relate mining activities with spatio-temporal dynamics of land degradation by using differential Synthetic Aperture Radar interferometry (DInSAR). The experimental analysis was carried out on data acquired in the LAN_2277 scientific proposal framework during 2014-2015 period. A set of 25 very height resolution SAR data gathered in the VV polarisation mode with a resolution of 0.45 m x 0.16m and an incidence angle of 370 have been used in this study. Preliminary results showed that altered terrain topography with steep slopes and deep pits has led to the layover of radar signal. Initially, ambiguous results have been obtained due to the highly dynamic character of subsidence induced by activities which imply mass mining methods. By increasing the SAR data number, the land degradation assessment has been improved. Most of the interferometric pairs have low coherence therefore the product coherence threshold was set to 0.3. A coherent and non-coherent analysis is performed to delineate land cover changes and complement the deformation model. Thus, the environmental impact of mining activities is better studied. Moreover, the monitoring of changes in pit depths, heights of stock-piles and waste dumps and levels of tailing dumps provide additional information about production data.
* Corresponding author
1. INTRODUCTION
Open pit area imposes problematic issues regarding landscape and ecosystem such as: surface disturbance, waste dumps and acid drainage, hydrospheric effluents and atmospheric dust emission (Ripley, 1996). In time, mining activities have induced the land use / land cover changes, the vegetation stress, the changes in soil moisture and ground water environment and also the subsidence phenomena. Horizontal or vertical displacement can be generated in the intensive mining areas depending on local geological structure, the discontinuities in rock strata and the design of slopes.
The new concepts for preserving the environment contribute to the adoption and implementation of the legislation that minimizes its negative effects. Thus, the ameliorative measures envisage choosing of the environmentally friendly mining processes, the implementation of new greening mining technologies, the re-evaluation of cut-off grades and the researching and developing of green mining technology. These are reflected in decreasing of the subsidence rate, improving efficiency and reduce greenhouse gas emission intensity. Recent developments in sensors and remote sensing technologies are conducted to refinement of the methods and algorithms that could be applied for efficient environment monitoring. RADARSAT, ALOS PALSAR, TerraSAR-X, CosmoSky Med and Sentinel 1 missions allow rapid acquisition
of quantitative data over wide areas, independently of lightening and weather conditions. Therefore, the environmental monitoring and investigation with SAR data is used to identify spatial and temporal patterns in the characteristics of the resource to better enable assessment of changes over time. Many studies on SAR interferometry (Jarosz, 2003; Perski, 2000; Stow, 1997, Paradella, 2015) have revealed that significant subsidence has occurred inside the mining operation with some limitations over rapidly changing area (showing low coherence) (Strozzi, 2002; Chen, 2013). Conventional DInSAR applied in the surface deformation monitoring has been associated with the geodynamic events and mining activities (Modoni, 2013; Tripolitsiotis, 2014). The main limitation of this technique consists in the loss of fringes with large deformation gradient especially when short wavelength is involved (Chen, 2001; Zao, 2013).
An advanced DInSAR technique uses coherent persistent points clearly distinguished in all images without any variation in their properties to map deformations (Ferretti, 2000; Ferretti, 2001, Hooper, 2007). In order to increase the PS estimation in the active mining areas, corner reflectors installed in the regions with low coherence have been considered as reference points. So that, by applying a parametric adjustment method, optimal solution for subsidence rate was found (Xing, 2013). Monitoring of the mining activities located in mountain or hilly areas requires an accurate digital elevation model (DEM) for The International Archives of the Photogrammetry, Remote Sensing and Spatial Information Sciences, Volume XLI-B8, 2016
geocoding and topographic phase removal. Based on accuracy of the DEM, persistent points could be restricted near the subsidence affected areas derived from differential interferograms (Liu, 2014).
A present low coherence in the active open pit areas can lead to poor quality of the interferograms. Therefore, to obtain the degradation in such areas, amplitude based speckle tracking interferometry can be applied (Yan, 2016). This technique exploits the correlation of the speckle pattern of two images for monitoring faster displacement. The estimation of the shift is performed by the coregistration process using the coherence and the amplitude cross correlation when the coherence is below the SNR threshold. Moreover, this technique no need the unwrapping phase and gives the deformation value without any limitation on the deformation gradient.
In this context, the paper focuses on land degradation monitoring in the Rosia Jiu opencast area taking into account the mining engineering standards and specifications. Previous researches (Irimus, 2006, Braghina, 2008, Poenaru, 2015) were shown the socio-economic and environmental impacts of the mining activities in the Motru coalfield basin. PSInSAR and amplitude speckle tracking method were used and assessed in the active opencast area.
2. THE STUDY AREA
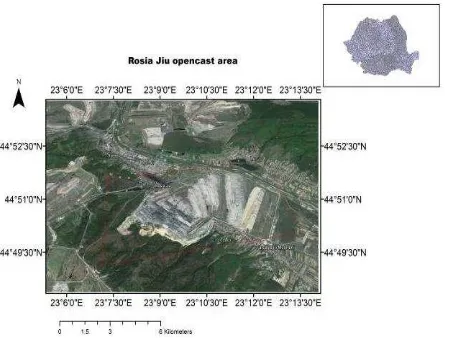
The study area is located in the southwestern part of Romania between Jiu and Motru Valleys, in Gorj County (Fig. 1). Being part of the Motru basin, the coal deposits from the west have the small tilt to the east instead of those from the north with tilt to the south. The basin is formed under approximately north- west extension. NE to north-south striking normal faults are dominant with some south west normal faults also being present, but much less frequently. The entire complex of sediments from the Motru basin has the thickness of 90 m in the edges up to 220 m in the centre and its occurs in the fluvial lithic facies, characterized by the a1ternation of thicker psammite layers with isolated psephites and thinner layers of pelites. Layers are arranged into incomplete sedimentation cycles. Predominant materials are quaternary lacustrine deposits of Holocene and Pleistocene age placed on top of the schist bedrock. Coal fault is found in near horizontal and lightly dipping layers in sequence with gravels, sand and clays layers (Fig. 2).
Figure 1.Rosia Jiu opencast area, Gorj County. ©Google Earth, 2016
Figure 2. Geological map of the Rosia Jiu open pit area. (Source: Geological Institute of Romania, 1: 200000 scale)
Mining is carried out using bucket wheel excavators on eight or nine benches, reaching of depth of about 120 m below the surface. Beginning with 2007, mining activities are deployed in stream mode with improvements in the technological flow and machinery performances. These conducted to the decreasing of its effects on the environment.
During the investigation, several questions were raised: a) are there any areas with the ground fissure, b) is it possible to monitor the displacement in the rock strata without any ancillary information, and c) how could satellite remote sensing methods for monitoring mining activities be optimized to improve coherence between SAR data acquisition.
To answer at these questions, a coherent and non-coherent analysis based on PSInSAR and amplitude tracking interferometry were performed using VHR SAR data.
3. RESULTS AND DISCUSSIONS
3.1 Dataset and processing details
PSInSAR processing was applied on a set of 22 VHR TerraSAR X data in Staring Spotlight configuration mode gathered in the LAN_2277 scientific proposal framework during 2014-2015 period. The SAR data have been acquired in ascending mode, VV polarization, 259 orbit cycle, 85 relative orbit, at an incidence angle of 370. Additional three Spotlight TerraSAR-X data have been used to retrieve digital elevation model and configuration settings. For processing and validation purposes, an external DEM derived from levelling measurements with pixel spacing 10 m and vertical accuracy of ± 1m, was used. A total of 21 interferograms have been generated in the PSI processing. For coherence maximization and improving the accuracy of the PSs estimation, data collected on 19.12.2014 was selected as master image (table 1).
Pixel spacing of SAR data is not the same in azimuth and range direction (0.16 with 0.45). Therefore, multilooking was applied by taking 5 looks in azimuth and one look in the range direction. Consequently, the pixel spacing both in intensity and phase components became 1 m x 1m.
The PS processing method is based on amplitude dispersion index which is a thresholding method: it extracts pixels with relatively large amplitude and preserves those ones with smallest phase dispersion (Ferretti, 2001). After master selection, processing chain involves the following steps: interferogram generation, topography removal using a DEM, candidate PS points identification from SAR amplitude The International Archives of the Photogrammetry, Remote Sensing and Spatial Information Sciences, Volume XLI-B8, 2016
statistics, use these points to model linear deformation and atmospheric effects, atmospheric phase generation for each interferogram, atmospheric effects removal from each interferogram, recreate differential phase interferograms and identify PS points using phase statistics. Finally, the interferometric products were projected from the radar line-of-sight (LOS) direction onto the DEM geometry.
Date Baseline Days Table 1. ST TerraSAR-x data details: perpendicular and temporal baselines and centroid Doppler difference frequency
It should also be noted that the coherence coefficient threshold was set to 0.4 in order to increase the PS number in active mining area. Coherence values vary from 0 to 1. High values of coherence correspond to the high correlation between master and slave while low coherence values are due to de-correlation between acquisitions (such as land use/land cover changes and seasonal vegetation changes). Many useful fringes are obtained by the differential interferogram of November 2014 in the main pit as the mining induced rapid deformation exceeds the limits of the maximum deformation gradient (Fig.3). Therefore, speckle tracking technique was applied on the data acquired on august 2014 and august 2015. This technique no need phase unwrapping, works well in low coherence conditions and has lower accuracy, proportional with pixel size. The sub-pixel position of the maximum reflectivity values is estimated image by image, highlightening possible displacement/ shift with respect to the master. Both velocity and displacement values were obtained along the LOS and azimuth direction.
3.2 PSInSAR analysis
Approximatively 3 billion tons of coal have been extracted and 16.83 tons of waste piles have been stripped from Rosia Jiu mine in the year 2014. Mining activities being stopped in the autumn-winter season allow identifying in the differential interferogram points of abrupt transition from positive (+pi) to negative values (-pi) (shown as colors varying from blue to mauve in Fig. 3). This means that the phase difference between the SAR data is higher than 2pi, thus the relative motion between the adjacent areas exceeds one fringe. Dominant
scattering centers with high coherence were found in pit mine areas.
Selection of reference points of the stack of which the accuracy of the PSI estimation depends was hampered by deformation phenomena that affect entire area. Few points were found along railway line in the areas assumed unaffected by deformation. PSInSAR analysis was based on these considerations. Its result is shown in Fig. 4. Over 16000 persistent points have been estimated under low coherence. As it observed, PS are dense in urban area and sparse in rural or industrial areas. The accuracy of the PS data is investigated. Mean value of the linear mean displacement is about -0.6 mm/year with a standard deviation of 4.45 mm/year. Therefore, PSs with LOS velocity between ± 1mm/year were consider stable points. PSs with LOS velocity above or below these values were considered displacement points.
Displacement profiles in the main pit can be used to quantify the movements across the acquisition time. The magnitude of the relative displacement between points analyzed in Fig. 5 a, in main pit, varies from 3.5 cm in the center to the 1 cm on the edges. The magnitude of relative displacement in the tailing areas (Fig. 5b) varies between 3cm in the main tailing dump up to 2 cm in the secondary tailings dump.
A quantitative comparison of the displacement results for validation purposes requires ground simultaneous measurements. Unfortunately, the National Company of Lignite as manager of Motru coal basin performs regular studies involving topographical and leveling measurements that are kept confidential. The practical solution to this problem is to use the speckle tracking technique for continuous areas monitoring at the required time interval.
Figure 3.Differential interferogram obtained from 16.11-27.11.2014 image pair in the radar coordinates. ©DLR, 2014
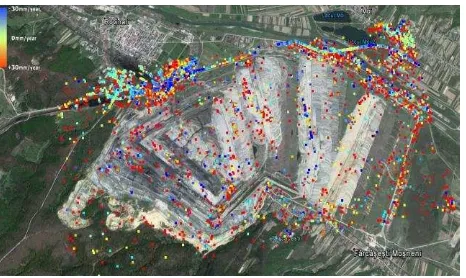
Figure 4. Spatial distribution of the PS points: Red points
indicate uplift (excavated) areas and blue point shown downlift (in the main pit) or subsidence (tailings areas).
©Google Earth, 2016
(a)
(b) Figure 5. Temporal evolution of the degradation phenomena. (a) PS points’ analysis in the main pit area and (b) PS points’ analysis
in the tailing areas. ©DLR, 2014
Figure 6. Speckle tracking map in LOS direction superposed with PS points. ©DLR, 2014
3.3 Speckle tracking analysis
Following the previously presented results, the global deformation trend caused by SAR sensor’s attitude and orbit is firstly fitted and removing using a polynomial model in both directions. Then a DEM is applied to compensate the terrain topography. The mismatch points were removed by the physical constraints of surface deformation with motion direction and magnitude (Yan, 2016).
The slant range offset map obtained from speckle tracking method (Fig. 6) contains the same deformation information in the LOS direction as DInSAR. If high spatial displacement gradient is derived, then the accuracy of the method is increased.
Low spatial displacement gradient means much noise and lower accuracy which is determinate by its dependency on SAR amplitude. The speckle tracking map in LOS direction is superposed with PS points to validate the previous result. It is observed the same direction of the displacement gradient.
4. CONCLUSIONS
In this work, the effectiveness of the PSInSAR and speckle -tracking techniques to map and monitor mining activities impacts on the environment in the Rosia Jiu open pit mine was demonstrated. For these purposes 22 VHR TerraSAR -X data were processed and analysed.
Large deformation gradient caused by mining activities during one year time span confirms the PS trends: landslides and subsidence in active main pit and tailings areas. Villages and road infrastructure are prone to subsidence phenomena induced by mining activities.
Results show that these techniques can be used to identify hazard -prone areas. Moreover, the new Staring Spotlight mode of the TerraSAR-X sensor was demonstrated its capabilities to monitor environmental impact of the mining activities by minimizing the temporal de-correlation effect and enhancing the PS estimation. Schvab, A. (2011). Territorial management within the systems affected by mining. Case study the south-western development region in Romania. Iranian Journal of Environmental Health Science & Engineering, 8(4), pp. 343-352.
Chen, B., K. Deng, H. Fan, and M. Hao. 2013. Large-Scale Deformation Monitoring in Mining Area by D-Insar and 3D Laser Scanning Technology Integration. International Journal of Mining Science and Technology, 23, pp 555–561.
Chen, C. W., and H. A. Zebker. 2001. Two-Dimensional Phase Unwrapping with Use of Statistical Models for Cost Functions in Nonlinear Optimization. Journal of the Optical Society of America A-Optics Image Science and Vision, 18, pp 338–351.
Ferretti, A., Prati C. and Rocca F., (2000). Nonlinear subsidence rate estimation using the Permanent Scatterers in differential SAR interferometry," IEEE Transactions on Geoscience and Remote Sensing, 38(5), pp 2202-2012.
Ferretti, A., Prati C. and Rocca F., (2001). Permanent scatterers in SAR interferometry IEEE Transactions on Geoscience and Remote Sensing, 39(1), pp 8-20.
Hooper, A., Segall, P. and Zebker, H., Persistent scatterer interferometric synthetic aperture radar for crustal deformation analysis, with application to Volcán Alcedo, Galápagos, Journal of Geophysical Research, 112, Issue B7.
Irimuş, I.A., Anghel, T., Oncu, M., (2006). “The implications of mining activities in the change of environmental conditions from Motru mining basin. Special considerations regarding the soil”. Vol. Management and soil resources use agri -environment protection and rural development from central and north-western Romania, ClujNapoca , Romania , pp. 55-56.
Jaroz, A. and Wanke, D., 2003. Use of InSAR for monitoring of mining deformations. Proceedings of the Fringe Workshop 003, Frascati, Italy, 1–5 December 2003 (ESA SP-550, June 2004).
Liu, Z., Bian, Z., Lei, S., Liu, D. and Sowter, A., (2014). Evaluation of PS-DInSAR technology for subsidence monitoring caused by repeated mining in mountainous area. Transactions of Nonferrous Metals Society of China, 24(10): pp 3309−3315.
Modoni, G., Darini, G., Spacagna, R.L., Saroli, M., Russo, G. and Croce, P. (2013). Spatial analysis of land subsidence induced by groundwater withdrawal, Engineering Geology, Volume 167, pp 59-71.
Paradella, W. R., Ferretti, A., Mura, J. C., Colombo, D., Gama, F. F., Tamburini, A., Santos, A. R., Novali, F., Galo, M., Camargo, P. O., Silva, A. Q., Silva, G. G., Silva, A., Gomes, L. L., 2015. Mapping surface deformation in open pit iron mines of Carajás Province (Amazon Region) using an integrated SAR analysis, Engineering Geology, Vol. 193, pp 61-78.
Perski, Z. and Krawczyk, A., (2000) Application of Satellite Radar Interferometry on the Areas of Underground Exploitation of Copper ore in LGOM – Poland, 11th International Congress of the International Society for Mine Surveying, Krakow, Poland, Vol.2, pp. 209-218.
Poenaru, V., Popescu, A., Patrascu, C. and Cuculici, R., (2015). “Assessment Of Rosia Jiu Mining Area Through TerraSAR-X New Imaging Modes”, FRINGE 2015.
Ripley, E., Redmann, R. and Crowder A., 1996. Environment effects of mining. St. Lucie Press, pp 356.
Stow, R. J. and Wright P., (1997). “Mining Subsidence Land Surveying by SAR Interferometry”, 3rd ERS SYMPOSIUM Florence 97 - Abstracts and Papers, Available: http://earth.esa.int/symposia//papers/ [2002, June 30].
Strozzi, T., A. Luckman, T. Murray, U. Wegmuller, and C. L. Werner. 2002. Glacier Motion Estimation Using SAR Offset-Tracking Procedures. IEEE Transactions on Geoscience and Remote Sensing, 40, pp 2384–2391.
Tripolitsiotis, A., Steiakakis, C., Papadaki, E., Agioutantis, Z., Mertikas, S. and Partsinevelos, P., (2014). Complementing geotechnical slope stability and land movement analysis using satellite DInSAR .Cent. Eur. J. Geosci. 6(1), pp 56-66.
Xing, X., Zhu, J., Wang, Y. and Yang, Y (2013). Time series ground subsidence inversion in mining area based on CRInSAR and PSInSAR integration, Journal of Central South University, 2013, 20, pp 2498−2509.
Yan, S., Liu, G., Deng, K., Wang, Y., Zhang, S. and Zhao, F., (2016). Large deformation monitoring over a coal mining region using pixel-tracking method with high-resolution Radarsat-2 imagery. Remote Sensing Letters, Vol. 7, 3, pp 219-228.
Zhao, C., Z. Lu, and Q. Zhang. 2013. Time-Series Deformation Monitoring over Mining Regions with SAR Intensity-Based Offset Measurements. Remote Sensing Letters 4, pp 436–445. The International Archives of the Photogrammetry, Remote Sensing and Spatial Information Sciences, Volume XLI-B8, 2016