DETECTION OF HARBOURS FROM HIGH RESOLUTION REMOTE SENSING
IMAGERY VIA SALIENCY ANALYSIS AND FEATURE LEARNING
Yetianjian Wang a, Li Pan a, *, Dagang Wang a, Yifei Kang a
a School of Remote Sensing and Information Engineering, Wuhan University, Bayi Road, Wuhan, 430072 China- (wytj1992, wdg_primer, 2217707)@163.com
Commission VII, WG VII/5
KEY WORDS: Harbours, Saliency Analysis, Feature Learning, Fuzzy C-mean, Scale-Invariant Feature Transform (SIFT)
ABSTRACT:
Harbours are very important objects in civil and military fields. To detect them from high resolution remote sensing imagery is important in various fields and also a challenging task. Traditional methods of detecting harbours mainly focus on the segmentation of water and land and the manual selection of knowledge. They do not make enough use of other features of remote sensing imagery and often fail to describe the harbours completely. In order to improve the detection, a new method is proposed. First, the image is transformed to Hue, Saturation, Value (HSV) colour space and saliency analysis is processed via the generation and enhancement of the co-occurrence histogram to help detect and locate the regions of interest (ROIs) that is salient and may be parts of the harbour. Next, SIFT features are extracted and feature learning is processed to help represent the ROIs. Then, by using classified feature of the harbour, a classifier is trained and used to check the ROIs to find whether they belong to the harbour. Finally, if the ROIs belong to the harbour, a minimum bounding rectangle is formed to include all the harbour ROIs and detect and locate the harbour. The experiment on high resolution remote sensing imagery shows that the proposed method performs better than other methods in precision of classifying ROIs and accuracy of completely detecting and locating harbours.
* Corresponding author
1. INTRODUCTION
1.1 Backgrounds
The recent advance in development of sensors and network has led to the use of high resolution remote sensing imagery in multiple fields, in which object detection is a major filed. Among the objects, harbours plays an important role for its significance in both civil and military fields. How to detect harbours from high resolution remote sensing imagery is therefore becoming a popular topic for researchers worldwide. Unlike objects like buildings or farmland which have distinctive visual features, harbours do not have such visual features since it is a hybrid of relatively simple objects including parking lot, road, buildings, waters, ships and various other objects. Harbours differ from other objects mainly in the function parts. The difference can be described by the semantic information for the object (Wang et al, 2001). Therefore, it is necessary to apply feature learning to extract semantic information for harbour detection. Currently, most harbour detection methods can be classified in to three categories (Chen et al, 2010). These three kinds of methods only use the basic features of a specific part of harbour and do no use semantic information, so the usage is limited. In order to overcome the problems, a method combining saliency analysis and feature learning is proposed.
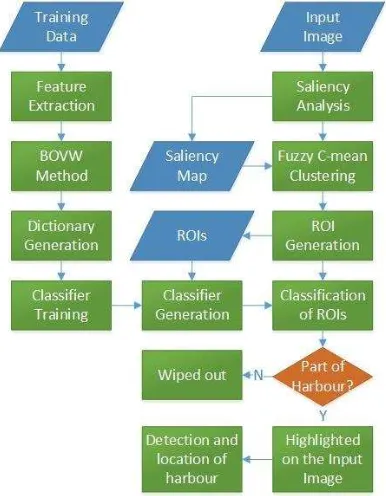
This method is based on saliency analysis and semantic information. First, the image is transformed to HSV colour space. Then the value band in HSV colour space is chosen and saliency analysis is processed via the generation and enhancement of the co-occurrence histogram to help detect and locate the ROIs that may be parts of the harbour. Next, SIFT features are extracted and bag-of-visual-words (BOVW) method
is processed for feature learning to help represent the ROIs. Then, by using classified feature of the harbour, a classifier is trained and used to check the ROIs to find whether they belong to the harbour. Finally, if the ROIs belong to the harbour, a minimum bounding rectangle is formed to include all the harbour ROIs and detect and locate the harbour. Figure 1 shows the procedure of the proposed method.
2. METHODOLOGY
2.1 Saliency Analysis for ROI detection
Saliency analysis is based on the study of visual saliency. It has drawn the attention of worldwide and seen application in various fields in recent years (Moan et al, 2013). For harbour detection, saliency analysis aims to detect the ROIs that may be part of it. Any harbour, regardless of size and location, is located beside waters. The waters, compared with objects on land, have relatively lower saliency. According to the saliency scale theory (Goferman et al, 2012), different sizes of patches can generate different saliency maps and enhance the boundary of salient parts of an image. In this paper, we adapt the co-occurrence histogram analysis method (Zhang and Li, 2015) and adapt it according to the saliency scale theory. We choose the size of windows as 3, 7, 11, 15 and 19 according to the size of cars, trucks, oil tanks, containers, and cranes. First the image is transformed into HSV colour space, then value band is used to generate the corresponding saliency map for each size of windows. The saliency map corresponding to window size 3 is chosen as basis for comparison. Next, we use the following equation to decide whether a pixel should be recorded.
(x , y ) (x , y ) corresponding pixels of two saliency maps
Ii= saliency map corresponding to window size i Ij= saliency map corresponding to window size j (xi, yi) = coordinate of the pixel on saliency map i (xj, yj) = coordinate of the pixel on saliency map j
Under all the conditions when i is smaller than j, if the dij equals zero or goes below zero, this pixel will be recorded. In other words, if the intensity value of a pixel on the saliency map increases or does not decline with increase in the size of windows, this pixel will be considered boundary between land and waters, and will be recorded. Finally, a refined saliency map for the image is generated using recorded pixels.
2.2 ROI detection
We use fuzzy C-mean algorithm and the refined saliency map to calculate the centre, the width and the height of ROIs for detecting and locating ROIs. Fuzzy C-mean algorithm combines traditional unsupervised clustering methods such as K-means method with fuzzy rules to achieve better performance. When using fuzzy C-mean, one has to choose a best amount of centres. In this paper, Xie-Beni index (Xie and Beni, 1991) is used as assessment for choice of amount of classes.
After the generation of centre of each ROI, we cluster the salient pixels on saliency map and calculate the median distance between pixels and their corresponding centre. The median distance is then used with the coordinate of its corresponding
median = corresponding median distance of the ROI W=width of image
H=height of image
x, y= coordinate of the centre th1, th2, th3, th4=thresholds
to make sure that the majority of pixels belonging to the centre is included in the ROI and that the outliers can be wiped out to avoid disturbance or false detection. If all four thresholds are below zero, the ROI will be extracted. Otherwise the centre is considered outlier and will be wiped out.
2.3 Feature Learning for Semantic Information and Classification
Considering the variation in scale, illumination, rotation and other aspects of the image. We adapt the robust SIFT feature (Lowe, 2004) for feature learning. We extract SIFT features from ROIs and use the classical BOVW model (Sivic and Zisserman, 2003) for feature learning. BOVW is an effective and traditional way of representing the semantic information of objects (Bosch et al, 2008). It was first used for text analysis and has now been widely applied to object detection on optical imagery. When using BOVW model, we need to obtain a
dictionary to generate the visual “words” to express the
semantic information. In this paper, we use the famous UC Merced data set and images from Google Earth including scenes that may contain part of a harbour and various other non-harbour-related scenes as positive and negative training samples. We choose imagery that contain part of the harbour to generate a dictionary and use the dictionary to generate the visual
“words” for each ROI. Then we use the dictionary to generate the visual “words” for each training sample and use them to
train a classifier to check if one ROI is part of the Harbour. In this paper we adapt the popular support vector machine (SVM) to build the classifier.
2.4 Detection of Harbours
When we get classification results for all ROIs, we can detect and locate the harbour on the image. On most occasions, harbours are very complex and hybrid and have many related parts which can be functionally distinctive but may be left out in the ROIs. Besides, the proposed method aims to detect and locate the harbour by finding its components and locating an area that contains all the detected components. In order to detect and locate the harbour as completely as possible, a minimum bounding rectangle is formed to include all the harbour ROIs and detect and locate the harbour.
3. EXPERIMENT
Figure 2. Busan Port in Republic of Korea
Figure 3. Jakarta Port in Indonesia
Figure 4. Gdynia Port in Poland
Figure 5. Rostock Port in Germany
3.1 Performance of the Proposed Method
Table 1 shows the number of ROIs extracted on each image and Table 2 shows the number of harbour ROI detection, the number of right classification for harbour ROI and the precision for the classification of the harbour ROIs on each image. The number of right classification and the precision are decided and calculated by comparing the classification result of each ROI with its ground truth information from Google Earth.
Name of harbour ROIs
Busan Port 4
Jakarta Port 9
Gdynia Port 4
Rostock Port 5
Table 1. Number of ROIs extracted on each image
Name of harbour Busan Port
Jakarta Port
Gdynia Port
Rostock Port Number of
harbour detection
4 7 4 4
Number of right classification
4 6 4 4
Precision 100.00% 85.71% 100.00% 100.00%
Table 2. Precision for ROI classification on each image
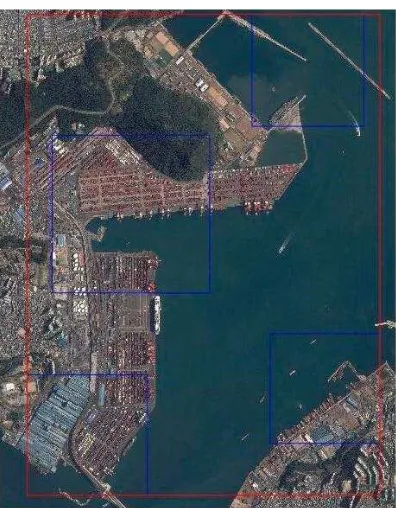
Then we proceed to detect and locate the entire harbour on the image. Figure 6 to Figure 9 show the classification result of ROIs and the detection of harbours. In this paper, the ROIs classified as part of harbours are highlighted in blue windows, while the ROIs classified as non-harbour-related objects are highlighted in green windows. The minimum bounding rectangle on each image is highlighted in red windows.
Figure 6. Detection on Busan Port in Republic of Korea
Figure 7. Detection on Jakarta Port in Indonesia
Figure 8. Detection on Gdynia Port in Poland
Figure 9. Detection on Rostock Port in Germany
We can observe from Figure 6 to Figure 9 that for each image, while some marginal regions are not included in the minimum bounding rectangle for each image, the majority part of harbour on each image is successfully detected and located. We can also conclude from Table 2 and Figure 6 to Figure 9 that our method achieves high precision of harbour-related ROI detection and accurately detects and locates the positions of the complete core areas of harbour on each image.
3.2 Comparison with state-of-the-art method
We adapt a SIFT-based keypoint matching method (Tao et al, 2011) as the representative of state-of-the-art methods for comparison. This method does not use semantic information and relies on the matching of low-level features.
Name of the harbour Number of ROIs
Busan Port 5
Jakarta Port 6
Gdynia Port 3
Rostock Port 1
Table 3. Number of ROIs extracted on each image by SIFT-based keypoint matching method
Name of harbour Busan Port
Jakarta Port
Gdynia Port
Rostock Port Number of
harbour detection
2 5 2 1
Number of right classification
1 4 2 1
Precision 50.00% 80.00% 100.00% 100.00%
Table 4. Precision for ROI classification on each image by SIFT-based keypoint matching method
We can conclude from Table 4 that the competing method achieves relatively low precision on harbour ROI extraction of Busan Port and Jakarta Port.
Then we proceed to detect and locate the harbour on each image. Figure 10 to Figure 13 show the detection and location result of this method on each image. The ROIs classified as part of harbours are highlighted in blue windows, while the ROIs classified as non-harbour-related objects are highlighted in green windows. The minimum bounding rectangle on each image is highlighted in red windows.
Figure 10. Detection on Busan Port in Republic of Korea by SIFT-based keypoint matching method
Figure 11. Detection on Jakarta Port in Indonesia by SIFT-based keypoint matching method
Figure 12. Detection on Gdynia Port in Poland by SIFT-based keypoint matching method
We can observe from Figure 10 to Figure 13 that for each image, the competing method is only able to detect part of the harbour and leaves out most of the core areas. We can also conclude from Table 4 and Figure 10 to Figure 13 that the competing method has fairly low precision of harbour-related ROI detection and cannot accurately detect or locate the positions of the complete core areas of harbour on each image.
4. CONCLUSION
Harbour is an important object in civil and military fields. It is a challenging task to detect and locate it from high resolution remote sensing imagery. Most state-of-the-art method only focus on the detection of one part of the harbours and the use of basic features, the effect is therefore unsatisfactory. In this paper, a method combining saliency analysis and feature learning to extract semantic information for harbour detection and location is proposed. It combines saliency analysis and feature learning to extract semantic information to improve the detection of harbour on high resolution remote sensing imagery. The experiments on high resolution optical imagery show that our method can precisely detect the core areas of harbours and accurately locate the complete area of harbours.
ACKNOWLEDGEMENTS
This work is supported in part by the National Basic Research Program of China under Grant 2012CB719905. The author would thank Professor Zhaobao Zheng, of Wuhan University, for support of algorithm design.
REFERENCES
Bosch, A.; Zisserman, A.; Muoz, X. 2008. Scene classification using a hybrid generative/discriminative approach. IEEE Transactions on Pattern Analysis and Machine Intelligence, 30(4), pp. 712-727.
Chen, Q.; Wang, N.; Zhao, L.; Lu, J.; Hu, C.; Jiang, Y.; Kuang, G. 2010. Harbor detection of remote sensing images based on model, Future Computer and Communication (ICFCC), 2010 2nd International Conference on, 21-24 May 2010, 2010; pp V1-322-V321-325.
Goferman, S.; Zelnik-Manor, L.; Tal, A. 2012. Context-aware saliency detection. IEEE Transactions on Pattern Analysis and Machine Intelligence, 34(10), pp. 1915-1926.
Lowe, D.G. 2004. Distinctive image features from scale-invariant keypoints. International Journal of Computer Vision, 60(2), pp. 91-110.
Moan, S.L.; Mansouri, A.; Hardeberg, J.Y.; Voisin, Y. 2013. Saliency for spectral image analysis. IEEE Journal of Selected Topics in Applied Earth Observations and Remote Sensing, 6(6), pp. 2472-2479.
Sivic, J.; Zisserman, A. 2003. Video google: A text retrieval approach to object matching in videos, Computer Vision, 2003. Proceedings. Ninth IEEE International Conference on, 13-16 Oct. 2003, 2003; pp. 1470-1477 vol.1472.
Tao, C.; Tan, Y.; Cai, H.; Tian, J. 2011. Airport detection from large ikonos images using clustered sift keypoints and region
information. IEEE Geoscience and Remote Sensing Letters, 8(1), pp. 128-132.
Wang, J.; Li, J.; Wiederhold, G. 2001. Simplicity: Semantics-sensitive integrated matching for picture libraries. IEEE Transactions on Pattern Analysis and Machine Intelligence, 23(9), pp. 947-963.
Xie, X.L.; Beni, G. A validity measure for fuzzy clustering. IEEE Transactions on Pattern Analysis and Machine Intelligence, 13(8), pp. 841-847.