ANALYSIS ON LIGHT QUANTITY AND QUALITY BASED ON DIVERSE CLOUD
CONDITIONS
M. Yamashita a, , M. Yoshimura b
a Tokyo University of Agriculture and Technology, Faculty of Agriculture and Women's Future Developing Organization, 3-5-8 Saiwai-cho, Fuchu, Tokyo, Japan [email protected]
b PASCO Corporation, PASCO Research Institute, 2-8-10 Higashiyama, Meguro-ku, Tokyo, Japan [email protected]
Commission VII, WG VII/1
KEY WORDS: Cloud conditions, Global PAR, Diffuse PAR, light quantity, light quality
ABSTRACT:
Photosynthetic active radiation (PAR) is the source of incident light energy for the photosynthetic activity of plants. PAR additionally characterizes the light environment on the surface of the Earth. The light environment is an important factor for estimating quantities such as carbon exchange and the productivities of forests and agriculture. The incident PAR on the ground surface has the characteristics of light quantity consists of direct and diffuse components, and of light quality consists of spectral components such blue, green and red lights. These light quantity and quality are also important light environmental factors in the photosynthetic activities of plants under the natural environment. However, the light environment including direct and diffuse components and spectral components is easily affected by cloud conditions especially cloud cover and its movements.
In this paper, we focus on the characteristics of the light quantity and quality under diverse cloud conditions, and analyse the observational data, which are the global- and diffuse- spectral irradiances from 400 to 700 nm with quantum and energy units and the cloud conditions derived from whole-sky images taken during summer in Kyoto city.
As for the comparisons with light quality and cloud conditions, we use the Normalized Difference PAR Spectral Index (NDPSI) which shows the difference of red- and blue-light components and we use cloud cover and the Sun appearance ratio derived from the whole-sky images to define the cloud conditions.
As the results of these analyses, we confirmed that there are the clear relationships between cloud cover and diffuse ratio, between the Sun appearance ratio and the normalized global PAR as the light quantity, between cloud cover and NDPSI in diffuse component, and between the Sun appearance ratio and NDPSI in direct component as the light quality.
1. INTRODUCTION
Photosynthetic active radiation (PAR) is solar radiation in the 400 to 700 nm wavelength range, which is almost equivalent to the visible-wavelength range. On ground surface such tops of vegetation canopies, there are direct PAR beamed from the Sun face directly and diffuse PAR reached from the whole hemispherical sky area except of the Sun face. That is, the global PAR means the sum of the direct and diffuse PARs. PAR consists of direct and diffuse components is an important light environmental factor as light quantity in CO2 flux and photosynthetic production, and used as input parameters in ecological carbon cycle models to estimate or forecast the amount of CO2 fixing and Net Primary Production (Sellers et al., 1986; Ito and Oikawa 2002; Dai et al. 2004). There are many reports of that the light use efficiency in photosynthesis is higher under cloudy condition than under clear sky condition. Because the amount of diffuse PAR is greater than direct PAR under cloudy condition (Freedman et al., 2001; Gu et al., 2002; Letts, 2005; Min, 2005; Brodersen et al., 2008).
The other important light environmental factor as light quality is the spectral components such blue and red lights in PAR. It is known that there are different responses of stomatal conductance and to the inhibition of photosynthetic electron transport in blue and red lights (Hernan et al., 2012; Florian 2014). Dye (2004) shows that the spectral compositions of diffuse PAR with both units of quantum and energy are different at daily timescale under the different sky conditions as indicated by the diffuse fraction of the global PAR.
These results in previous studies show the importance of light quantity and quality of PAR data but also show that the light environment including direct/diffuse components and spectral components is easily affected by sky conditions and cloud existence. Furthermore, it is suggested the possibility of modelling light environment by using the data related with sky conditions (Freedman et al., 2001; Gu et al., 2002). However in reality, sky and cloud observations to date have depended on the observer’s sight and experience basically. Consequently, it makes difficult to analyse how the cloud conditions affect to light environment by using the actual cloud observational data. From above the background, in order to clarify the characteristics of the light quantity and quality under diverse cloud conditions, we analyse the observational data, which are the global and diffuse spectral irradiances from 400 to 700 nm with quantum units (photosynthetic photon flux density, mol/m2/s) and energy units (irradiance, W/m2, and the diverse cloud conditions derived by processing whole-sky images. As for the comparisons with light quality and cloud conditions, we use the Normalized Difference PAR Spectral Index (NDPSI) (Dye, 2004), which shows the difference of red- and blue- light components, and the cloud cover or the sun appearance ratio derived from the whole-sky images to define the cloud conditions.
2. DATA AND METHODS
2.1 Global and diffuse spectral irradiances of PAR
We installed a spectral radiometer (Eiko, MS-700) with a rotating shadow blade (Prede, PRB-100) to measure both global and The International Archives of the Photogrammetry, Remote Sensing and Spatial Information Sciences, Volume XL-7, 2014
diffuse spectral irradiances of PAR on the roof of 3 floors building at latitude 35.018°N and longitude 135.768°E in central Kyoto city.
The global and diffuse irradiances were measured during even and odd minutes respectively. Both of spectral irradiances of 1 nm interval from 400 – 700 nm can be converted from energy units (W/m2/) to quantum units (mol/m2/s/) by the attached software of MS-700. Diffuse irradiance was calculated as the average of two data taken in the one minute before and one minute after the global irradiance measurement.
2.2 Whole-sky images
We used whole-sky camera which consists of commercial-based digital camera (Nikon, Coolpix4500) and fish-eye lens (Nikon, Fisheye Converter FC-E8) to take the whole sky images for determination of cloud conditions.
In order to decrease the influence for CCD saturation caused by the strong Sun light, the neutral density filter with 10 % transparency (FUJIFILM, ND1.0) put between the digital camera and the fisheye lens. The camera was set up to take images at every two-minute interval by fixed exposure of the aperture as F2.8 and shutter speed as 1/500 s. In the case of this fixed exposure, these pixels of only the Sun and solar aureole are saturated. The image has 2204 pixels by 1704 lines with RGB colors and JPEG (1/4 compressed) format for general purpose and accumulating large amount of image files. The head of whole-sky camera was fixed to north direction and levelled to horizon.
2.3 Light quantity
The measured global and diffuse spectral irradiances are calculated as the global and diffuse PAR by integrating from 400 to 700 nm with energy units (W/m2).
The values of global PAR are changeable depend on the different Sun altitude, so that the global PAR is normalized by the horizontal extraterrestrial PAR (Itoa) by following eq. 1 and 2.
(1)
I r sin (2)
where NG ; normalized global PAR Gobs ; observed global PAR (W/m2),
I0 ; solar constant for PAR wavelength (400 – 700 nm), (ro/r)2 ; correction value of the inverse square between r0: the average distance of Earth – Sun and r: the distance of Earth – Sun on observation day
; Sun altitude angle at observation time
In this study, solar constant for PAR was introduced into I0 = 530 W/m2 by using the extraterrestrial solar spectral irradiance at mean Sun – Earth distance of SOLSPEC-ATLAS (Thuillier et al. 2003).
As for the diffuse component, the diffuse PAR is shown as diffuse ratio (DR), which is the fraction of diffuse PAR to global PAR (eq. 3).
(3)
where DR ; diffuse ratio
Dobs ; observed diffuse PAR (W/m2)
2.4 Light quality
The global and the diffuse spectral irradiances of PAR are used with quantum (mol/m2/s/) and energy (W/m2/) units. Then the direct spectral irradiance of PAR is calculated by subtracting of the diffuse one from the global one with both units.
To indicate the blue- and red- light components, we use the Normalized Difference PAR Spectral Index (NDPSI) (Dye, 2004). The NDPSI is shown by following eq. 4 and 5.
, , ,
, (4)
, , ,
, (5)
where BG ; integrating values from blue to green light (400 – 550 nm) irradiances with quantum (q) or energy (e) units
GB ; integrating values from green to red light (550 – 700 nm) irradiances with quantum (q) or energy (e) units
n ; either global (g), diffuse (d) or direct (b)
The theoretical range of NDPSI is from – 1.0 to + 1.0. The value of 0.0 means that spectral distribution is balanced between BG (400 – 550 nm) and GB (550 – 700 nm). A negative (positive) value shows that blue (red) light component is greater than red (blue) light (Dye, 2004).
2.5 Cloud conditions
Here, we explain the methods to discriminate each area of blue sky, cloud and the Sun, to parameterize the states of the Sun, cloud cover, and whole-sky brightness by processing whole-sky image. In this image processing, Sky Index (SI) and Brightness Index (BI), which are calculated from digital numbers of RGB channels, are developed and introduced to detect the macroscopic information on whole-sky image (eq.6 and 7).
(6)
∗ (7)
where DNB ; digital number of Blue channel DNG ; digital number of Green channe DNR ; digital number of Red channel n ; bit number of quantization level
SI values range between –1.0 and 1.0. The blue sky area in an RGB image has a higher digital number for the blue channel and a lower digital number for the red channel. On the other hand, clouds show up as white or grey in the image. Thus a higher value of the SI indicates bluer sky, and a near-zero value indicates clouds or the Sun. BI is expressed in the range from 0 to 1.0. Bright pixels on the image have a high BI. Pixels in the area of the Sun have BI = 1 and SI = 0. Areas of the Sun, cloud and blue sky in an image are classified using a threshold curve on an SI versus BI graph. The threshold curve for sky area classification is determined from the frequency of pixels having a certain SI and BI combination. In this case, the threshold curve was BI = e– 9*SI. When the SI–BI coordinates of a pixel are beneath the threshold curve, the pixel is classified as belonging to a cloud area. The Sun appearance or hiding is determined by the pixel counts of BI = 1 being more than 2300 or not. The size of about The International Archives of the Photogrammetry, Remote Sensing and Spatial Information Sciences, Volume XL-7, 2014
2300 pixels corresponds to 5.9 degrees of the view angle of the Sun disk on the whole sky image.
In this way, the Sun appearance or hiding, cloud cover (CC) and brightness in whole sky (BIws) can be calculated from whole-sky image using SI and BI. For comparisons with cloud conditions and light quantity or quality data, we use the average of cloud cover and who- sky brightness or the ratio of the Sun appearance for 20 minutes.
3. RESULTS AND DISCUSSION
To understand the characteristics of light quantity and quality under diverse cloud conditions, we used the data observed on six days selected on 1st, 16th and 26th of Aug., 3rd, 12th and 27th of Sep in 2005, when the weather were basically sunny, not cloudless, and sometimes cloudy or overcast.
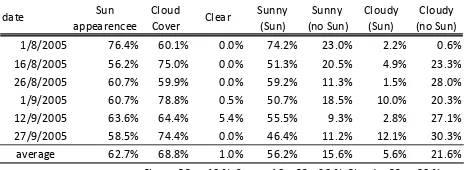
Table 1 summarize the weather conditions derived by processing the whole- sky images taken on six days. According to the weather report at Kyoto local meteorological station, the average of cloud amount and sunshine ratio during August and September are 6.9 and 42 % respectively. The average of the Sun appearance on our selected 6 days is about 20% higher, because the overcast day was not selected to focus the various cloud conditions. Therefore, the percentage of fair (10 < CC < 90%) is the highest of 72 %.
Table 1. The weather conditions of the objective six days. (Sun) and (no Sun) mean the Sun appearance or hiding by cloud.
3.1 Diurnal change of light environment
3.1.1 Global and diffuse PAR:
As for the objective six days, the measured global and diffuse PAR with instantaneous value of energy units (W/m2) is shown in fig.1. The change in the value of global PAR is large, because of the Sun visible or invisible by cloud movements. Two values of global and diffuse PAR are almost equal as the Sun hiding by cloud. Sometimes the global PAR is greater than PAR at top of atmosphere, because the PAR reflected from cloud is added to diffuse component instantaneously as the Sun appearing. Fig.2 shows the diurnal change of the normalized global PAR (NG) and the diffuse ratio (DR) with 20-minute average, and cloud conditions at 20-minute interval observed on 26th Aug. It is clearly understandable that NG and DR change in contrast almost in fig.2a. Cloud conditions in fig.2b shows that CC is decreasing from 8:00 to 16:00, also the Sun appearance ratio is higher. Comparing with two graphs, the patterns of changes in DR and CC are similar, and NG is higher as the Sun appearance ratio is high. Also the same results are indicated from another five days.
3.1.2 NDPSI of global and diffuse PAR:
Fig.3 shows the diurnal change of NDPSI with 20- minute average with both of quantum (fig.3a) and (fig.3b) energy units which are calculated from the global and diffuse spectral irradiances of PAR observed on 26th Aug as same as fig.2. The change patterns of the NDPSI with both units in both global and diffuse PAR are same.
Basically, the values of NDPSI with quantum units is greater than the energy one, because the conversion formula from energy units to quantum units has the function of wavelength. The NDPSI with quantum units (fig.3a) in global PAR shows the positive value which means red- light component is greater than blue one. However the NDPSI in diffuse PAR is indicated as the negative from 10:00 to 16:00 as decreasing cloud cover shown in fig.2. On the other hand, the NDPSI with energy units (fig.3b) shows the negative value always. That is, it indicates that blue-light component is greater than red-blue-light one in the global and diffuse PAR.
The NDPSI change of another five days also shows the same pattern.
3.2 Light quantity under diverse cloud conditions
We examined the characteristics of light quantity under diverse cloud conditions. Fig.4 shows the relationships between DR and CC (fig.4a), and between NG and the Sun appearance ratio (fig.4b) using the data of 20-minute average and interval observed from 8:00 to 16:00 on six days (144 samples). We can confirm the strong correlations between DR and CC with the approximation of exponential function in fig.4a. Freedman (Freedman et al., 2001) shows the close result of the relationship between diffuse ratio and cloud amount observed by observer’s sight.
During the Sun is hidden by clouds, the diffuse ratio is nearly 1.0 which means there is almost no direct component. Therefore, the global PAR mostly is composed by diffuse component. Generally, a reduction in direct irradiance is explained by Lambert- Beer law of an exponential function with a negative coefficient of optical thickness for air mass. The derived exponential function in this analysis has a positive coefficient for cloud cover. Thus the increase in the diffuse component of the global PAR can be explained by cloud cover.
Also, the fig.4b shows the strong relationship between NG and the Sun appearance ratio with the approximation of liner function. However, there are big differences at each value of the Sun appearance, especially at 100%. The other parameters might be required for more detailed analysis of NG.
3.3 Light quality under diverse cloud conditions
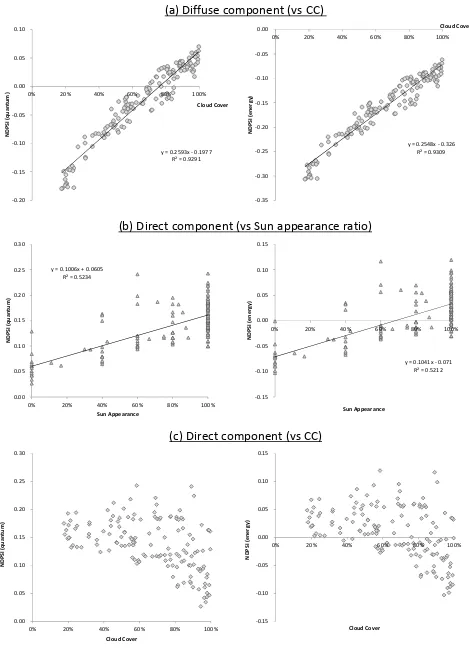
Fig.5 shows the relationships between NDPSI with quantum and energy units and cloud conditions, cloud cover and the Sun appearance ratio, in diffuse and direct components.
We can see the very strong correlation of NDPSI with both units and cloud cover in diffuse component shown in fig.5a. It means that the blue- light component is including much in diffuse component when cloud cover is a few, because the whole-sky area mainly consists of blue sky by Rayleigh scattering. On the other hand, the red- light component is increase when cloud cover is getting greater. Because Mie scattering is dominant more than Rayleigh scattering. Furthermore, NDPSI with quantum units in diffuse component is shown as the positive value when cloud cover is more than about 70%.
As for the NDPSI in direct component, it confirms that the red- light component is getting greater when the Sun appearance ratio is high as shown in fig.5b. On the contrary, fig.5c shows NDPSI in direct component is decrease when cloud cover is increase. Also, we can understand that the red- light component in direct PAR is absolutely more than blue- light one with quantum units. The red- light component with energy units in direct PAR is dominant when the Sun appearance is more than about 60 %. That is, it is confirmed that the beam light with longer wavelength is able to reach on the ground surface through the atmosphere.
date Sun 1/8/2005 76.4% 60.1% 0.0% 74.2% 23.0% 2.2% 0.6% 16/8/2005 56.2% 75.0% 0.0% 51.3% 20.5% 4.9% 23.3% 26/8/2005 60.7% 59.9% 0.0% 59.2% 11.3% 1.5% 28.0% 1/9/2005 60.7% 78.8% 0.5% 50.7% 18.5% 10.0% 20.3% 12/9/2005 63.6% 64.4% 5.4% 55.5% 9.3% 2.8% 27.1% 27/9/2005 58.5% 74.4% 0.0% 46.4% 11.2% 12.1% 30.3% average 62.7% 68.8% 1.0% 56.2% 15.6% 5.6% 21.6%
Clear : CC <= 10 %, Sunny: 10 < CC < 90 %, Cloudy: CC >= 90 %
4. CONCLUSION
In this study, to clarify the characteristics of the light quantity and quality under diverse cloud conditions, we analysed the observational data of global/ diffuse spectral irradiance with quantum and energy units, and cloud cover and the Sun appearance ratio derived by processing the whole-sky images. Through these analyses, we confirmed that there are the clear relationships between cloud cover and the diffuse ratio, between the Sun appearance ratio and the normalized global PAR as the light quantity, between cloud cover and NDPSI in diffuse component, and between the Sun appearance ratio and NDPSI in direct component as the light quality.
REFERENCES
Dai Y., Dickinson E. R., and Wang Y., 2004, A Two–Big–Leaf Model for Canopy Temperature, Photosynthesis, and Stomatal Conductance. Journal of Climate, 17, 2281–2299.
Dye D. G., 2004. Spectral composition and quanta-to-energy ratio of diffuse photosynthetically active radiation under diverse cloud conditions, J. Geophys. Res., 109, D10203, doi:10.1029/2003JD004251.
Florian A. B., 2014. Opinion: The red-light response of stomatal movement is sensed by the redox state of the photosynthetic electron transport chain, Photosynth Res., 119, pp. 131-140.
Freedman J. M., Fitzjarrld D. R, Moore K. E., and Sakai R. K., 2001, Boundary Layer Clouds and vegetation – Atmosphere Feedbaks. Journal of Climate, 14, 180–197.
Gu L., Baldosshi D., Verma B. S., Black T. A., Vesal T., Falge M. E. and Dowty R. P., 2002, Advantages of diffuse radiation for terrestrial ecosystem productivity. Journal of Geophysical Research, 107, 4050, doi:10.1029/2001JD001242.
Hernan E. B., Carla V. G., Edmundo L. P., Patricia N. P., Ruben B., and Jorge J. C., 2012. Phototropins But Not Cryptochromes Mediate the Blue Light-Specific Promotion of Stomatal Conductance, While Both Enhance Photosynthesis and Transpiration under Full Sunlight, Plant Physiology, 158, pp.1475-1484.
Ito, A. and Oikawa, T., 2002, A simulation model of the carbon cycle in land ecosystems (Sim–CYCLE): A description based on dry–matter production theory and plot–scale validation. Ecol. Model., 151, 147–179.
Letts M. G.., Lafleur P. M., and Roulet N. T., 2005, On the relationship between cloudiness and net ecosystem carbon dioxide exchange in a peatland ecosystem. ECOSCIENCE, 12(1), 53–59.
Min Q., 2005, Impacts of aerosols and clouds on forest– atmosphere carbon exchange. Journal of Geophysical Research, 110, D06203, doi:10.1029/2004JD004858.
Sellers J. P., Mintz Y., Sud C. Y. and Dalcher A., 1986, A Simpler Biosphere Model (SiB) for Use within General Circulation Models. Journal of the Atmospheric Sciences, 43(6), 505–531.
Stephen D. P., Stephen B. H., Michael A. B., and Robert J. M., 2005. The influence of canopy, sky condition, and solar angle on light quality in a longleaf pine woodland, Can. J. For. Res. 35, pp.1356-1366.
Thuillier, G., M. Hers, P. C. Simon, D. Labs, H. Mandel, D. Gillotay, and T. Foujols., 2003, The solar spectral irradiance from 200 to 2400 nm as measured by the SOLSPEC spectrometer from the ATLAS 1–2–3 and EURECA missions. Solar Physics, 214(1), 1–22.
Fig.1 The measured global, diffuse PAR and the horizontal extraterrestrial PAR (TOA) with instantaneous value on six days selected as sunny day for analyses.
0
Global PAR Diffuse PAR PAR_TOA
8/1 8/16 8/26 9/3 9/12 9/27
Fig. 2 Diurnal changes of (a) the normalized PAR and diffuse ratio with minute average and (b) cloud conditions at 20-minute interval observed on 26th Aug. CC is cloud cover. BI
ws is
whole-sky brightness. Error bar of CC (BIws) shows min-max values (standard deviation).
Fig. 3 Diurnal changes of (a) NDPSI with quantum units and (b) NDPSI with energy units at 20-minute average on 26th Aug.
Fig.4 The relationships (a) between diffuse ratio and cloud cover, and (b) between normalized global PAR and the Sun appearance ratio. (n=144)
6:00 7:00 8:00 9:00 10:00 11:00 12:00 13:00 14:00 15:00 16:00 17:00 18:00 BIws
6:00 7:00 8:00 9:00 10:00 11:00 12:00 13:00 14:00 15:00 16:00 17:00 18:00
Ratio NG DR
6:00 7:00 8:00 9:00 10:00 11:00 12:00 13:00 14:00 15:00 16:00 17:00 18:00
NDPSI (quantum) Global Diffuse
‐0.35
6:00 7:00 8:00 9:00 10:00 11:00 12:00 13:00 14:00 15:00 16:00 17:00 18:00
NDPSI (energy) Global Diffuse
(a)
Fig. 5 The relationship between NDPSI with quantum and energy units and cloud conditions. (a) NDPSI vs cloud cover in diffuse component, (b) NDPSI vs the Sun appearance in direct component, and (c) NDPSI vs cloud cover in direct component. (n=144)
y = 0.2548x ‐0.326