EXPLORATION OF GENETIC PROGRAMMING OPTIMAL PARAMETERS FOR
FEATURE EXTRACTION FROM REMOTE SENSED IMAGERY
Pan Gaoa, S. Shetty a, H. G. Momm b
a
Dept. of Electrical and Computer Engineering, Tennessee State University, Nashville, TN 37209 USA- (pgao ,sshetty)@tnstate.edu b
Department of Geosciences, Middle Tennessee State University, Murfreesboro, TN 37132 USA- [email protected]
KEY WORDS: Genetic programming, feature extraction, optimal parameters.
ABSTRACT:
Evolutionary computation is used for improved information extraction from high-resolution satellite imagery. The utilization of evolutionary computation is based on stochastic selection of input parameters often defined in a trial-and-error approach. However, exploration of optimal input parameters can yield improved candidate solutions while requiring reduced computation resources. In this study, the design and implementation of a system that investigates the optimal input parameters was researched in the problem of feature extraction from remotely sensed imagery. The two primary assessment criteria were the highest fitness value and the overall computational time. The parameters explored include the population size and the percentage and order of mutation and crossover. The proposed system has two major subsystems; (i) data preparation: the generation of random candidate solutions; and (ii) data processing: evolutionary process based on genetic programming, which is used to spectrally distinguish the features of interest from the remaining image background of remote sensed imagery. The results demonstrate that the optimal generation number is around 1500, the optimal percentage of mutation and crossover ranges from 35% to 40% and 5% to 0%, respectively. Based on our findings the sequence that yielded better results was mutation over crossover. These findings are conducive to improving the efficacy of utilizing genetic programming for feature extraction from remotely sensed imagery.
1. INTRODUCTION
Remote sensing can aid studies on earth surface processes, homeland security, disaster response, agricultural and environmental resource management, weather forecasting and global change research (Momm & Easson, 2011a). However, as a result of significant advances in technology, many organizations face the challenge developing timely and cost-effective techniques that can successfully identify certain types of features from remotely sensed imagery (Momm & Easson, 2011a). The main challenge lies in managing a large number of images over a long period of time and converting and analysing images for actionable intelligence by extracting specific features. In addition, the relationship between the different image regions is too complex to be solved by explicit programming (Momm & Easson, 2011a). Evolutionary computation is one of methods that can be used to improve feature extraction. However, the efficiency of this technique is seldom to be considered and optimized during the extraction of features from several images (Momm & Easson, 2011b). Although, the performance of the mutation and crossover has been compared (Luke S, Spector L, 1997), the range of parameter setting involving mutation and crossover operations specifically for remote sensing applications has not been assessed.
The efficiency of genetic programming algorithms was quantified based on the highest fitness value produced and the smallest computation time spent. Variations of input parameters controlling the evolutionary process were used to generate result datasets and to identify the optimal combination of input parameters based on the two assessment criteria. The paper describes the design and implementation of the proposed system. The proposed system contains two stages: (i) preliminary stage and (ii) formal exploratory stage. These two exploration stages were implemented to evaluate the optimal input parameter set based on the two different assessment criteria. These two stages were implemented sequentially and the findings from the preliminary exploration stage were used to select the range of parameter needed in the subsequent exploration stage.
The two exploratory stages were performed using an evolutionary computation framework composed of two major components: (i) data preparation and (ii) data processing. In the data preparation component, random candidate solutions were generated representing spectral band combinations. In the data processing component, traditional image processing and genetic programming algorithms were used to iteratively evolve spectral indices designed to improve the spectral separation of the feature of interest from the remaining image background. In this study, the selection of the input parameters controlling the evolutionary process was investigated. The manuscript is organized as follows: section 2 contains an overview of the remote sensing and genetic programming; section 3 provides details of the design and implementation of the system, while section 4 involves the evaluation of optimal parameters. In Section 5, we show the limitations and future work. Finally, the conclusion of the paper will be presented in the section 6.
2. BACKGROUND
2.1 Remote Sensing Data
Remote sensed data comprises of most digital images, captured by sensors which has four types of resolution: spatial, spectral, temporal and radiometric. There are three independently stages when processing the remote sensing data, which are pre-processing, processing and post-pre-processing, respectively. Pre-processing operations prepare the raw data for subsequent operations by minimizing imperfections and/or enhancing certain spectral characteristics (Momm & Easson, 2011a; Khorram et al., 2012). Algebraic operations of the spectral bands, such as division, addition, subtraction, or multiplication, are examples of the way in which images can be pre-procesed in order to enhance information. After pre-processing, satellite images are ready for an image classification process that converts the original spectral data, which are variable and may show complex relationships across several image bands, into a simple thematic map for end users (Khorram et al., 2012). The classification procedure extracts important and valid information from multidimensional data set that is otherwise
difficult to understand. Each pixel in an image is assigned to a particular category in a set of categories of interest such as a set of land cover types. In the proposed system, K-means was the unsupervised classification algorithm that was used to automatically cluster image pixels with similar spectral characteristics (Momm & Easson, 2011a). This algorithm was selected due to its simplicity and low computational cost; however, any other clustering/classification algorithm could had been used.
The quantitative measure of the classification accuracy constitutes a post-processing step. In this step, accuracy is calculated by comparing the resultant thematic image with user provided reference information through the utilization of the kappa coefficient of agreement (Momm & Easson, 2011b; Gong, 2003).
2.2 Genetic Programming
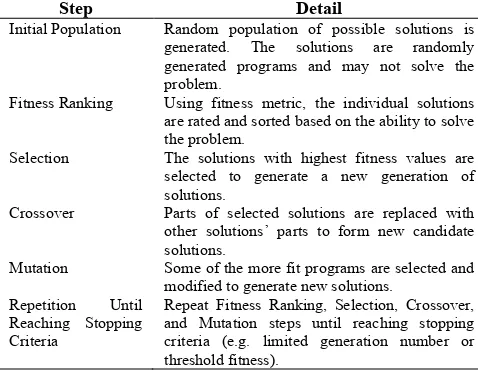
Genetic programming (GP) is an automated method for generating computer programs that solve specific problems based on principles of natural selection (Robinson, 2001; (Abraham et al., 2006). Genetic programming starts with thousands of randomly created computer programs where the only successful individuals are progressively evolved over a series of generations. Fitness function in genetic programming determines the successful individuals according to how well they are able to solve the problem. The new generations are created based on mutation and crossover operations. Mutation is the operation where a function only replaces a function in a solution, while the crossover operation means two solutions are combined to form two new solutions or offspring (Robinson, 2001). Table 1 shows genetic programming steps (Robinson, 2001; Abraham et al., 2006; Koza, 1992). In the proposed system, solutions are images that are created based on one satellite image.
Step Detail
Initial Population Random population of possible solutions is
generated. The solutions are randomly
generated programs and may not solve the problem.
Fitness Ranking Using fitness metric, the individual solutions
are rated and sorted based on the ability to solve the problem.
Selection The solutions with highest fitness values are
selected to generate a new generation of solutions.
Crossover Parts of selected solutions are replaced with
other solutions’ parts to form new candidate solutions.
Mutation Some of the more fit programs are selected and
modified to generate new solutions.
Repetition Until
Reaching Stopping Criteria
Repeat Fitness Ranking, Selection, Crossover, and Mutation steps until reaching stopping criteria (e.g. limited generation number or threshold fitness).
Table 1. Genetic programming steps
3. PROPOSED SYSTEM
The proposed system has two subsystems:
• Data preparation: representing the input data in the
format expected by the data processing subsystem.
• Data processing: is responsible for performing
evolutionary computation and identifies the feature of interest from the remote sensed image.
3.1 Data Preparation:
One of the most common pre-processing methods used in remote sensing applications is the use of spectral transformations (mathematical operations using the spectral channels as arguments). These spectral indices apply pixel-to-pixel operations to create a new value for individual pixel-to-pixels according to some pre-defined function of spectral values (Momm & Easson, 2011a). These operations enhance the image and some features become more discernible. The proposed system generates a set of candidate solutions that are internally stored as binary expression trees and externally represented as computer programs (Momm & Easson, 2011a)(Figure 1). The candidate solutions are created such that they meet the requirements of image bands combinations. The leaves of these binary expression trees are image spectral bands, and the nodes are operands such as summation, subtraction, multiplication, division, logarithms, and square root. The proposed system generates the number of candidate solutions with predefined heights and these candidate solutions are used for the data processing subsystem.
Figure 1. Example of candidate solution represented as hierarchical tree expression (internally) and computer program (externally).
3.2 Data processing:
The input to this subsystem consists of the multispectral image to be classified, reference data, and the parameters controlling the execution of the system. The reference data consists of positive examples (pixels where the feature is found) and negative examples (pixels where the feature is not found). The input parameters include the number of image channels, generation number, population size (number of candidate solution simultaneously considered), percentage of mutation and crossover and the order of mutation and crossover.
The proposed system applies each candidate solution independently to the original multi-spectral image, in order to produce transformed images (processed image). Each processed image is used as input to the K-means clustering method to produce a two-class binary image using the (Moore, 2011). The two classes in the binary images indicate the presence and absence of the target feature (Momm & Easson, 2011b). Then, the system individually compares each binary image to the reference image, which consists of both positive examples (where the feature is found) and negative examples (where the feature is not found), to produce fitness value using Kappa coefficient of agreement. All candidate solutions are sorted according to their fitness values to produce the next generation of candidate solutions. The system stops, if the user-defined stopping criteria are met, and it outputs the highest fitness value of each generation in the fitness exploration stage, generation number, and their respective computation time. If none of these criteria are met, the system will apply the genetic operations on
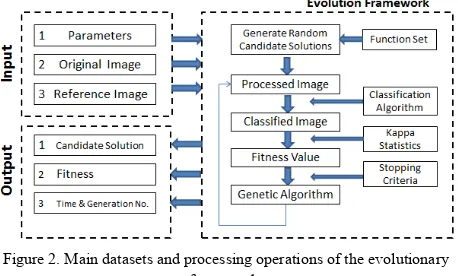
top most fit candidate solutions. Assuming that the parameter of the mutation and crossover are x% and y%, respectively, and the order of the mutation and crossover is mutation over crossover, then mutation operation is applied on the highest x% and the crossover operation that is applied on the next highest y% of the generation (Momm & Easson, 2011a; 2001b), the remaining (100-x-y)% individuals of the population are copied to the next generation with no change (replication). The system iteratively repeats until the stop criteria are met. Multi-thread techniques are applied with the process of generating initial candidate solutions and the genetic evolution. Each thread of generating individual candidate solution and calculating individual fitness values is mutually independent and executed simultaneously. Figure 3 displays the overview of the evolutionary framework.
Figure 2. Main datasets and processing operations of the evolutionary framework.
3.3 Preliminary stage
The preliminary exploration stage was designed to explore the approximate optimal input parameters controlling the genetic programming algorithm applied in image processing. In this stage, the maximum generation number, used as the main the stopping criterion in this stage, is a fixed value (e.g. 100) and the explored parameters include the population size and the order and percentage of mutation and crossover. The primary assessment criterion in this stage is the highest fitness value that can be achieved from different parameters setting. However, the tendency of the highest fitness obtained from each generation is not sufficiently regular. Therefore, multiple replications were carried out to provide additional auxiliary assessment criteria such as the mean, minimum, and standard deviation of fitness for all generations. The fitness exploration supported to identify the approximate maximum fitness value after specific generations. This preliminary investigation contributed to the definition of the fitness value used as the other stopping criteria for the iterative evolutionary process. The approximate optimal parameters obtained from the fitness exploration will reduce the range of the parameter setting, which need be explored in the subsequent formal exploration stage.
The search space containing all the possible input parameters values is very large and therefore it is not feasible to explore all possible values for each parameter. Instead, limited and representative range of parameters setting was selected to explore possible values set. The set of investigated values was also used to predict the possible performance of other values of each parameter, which were not explored to estimate the overall tendency of different parameter setting. Table 2 illustrates the explored range of values of each parameter in the stage of fitness exploration.
Parameter Explored Values
Generation Number Fixed value (100), which is the
stopping criteria
Population Size Vary from 100 to 2000, common
difference is 100 Percentage of
Mutation & Crossover
The total percentage of Mutation and Crossover is 20%, 30% and 40%. If the total percentage is 20% and mutation varies percentage from 0 to 20%, then crossover takes priority.
Order of Mutation & Crossover
Mutation is over Crossover and Crossover is over Mutation
Table 2 Range of parameter setting explored in the fitness exploration stage
3.4 Formal stage
The results of the preliminary exploration stage indicates that the trend of the maximum, minimum, average and standard deviation of the fitness gradually stabilizes when population size or total percentage of mutation and crossover reaches a relative fixed value. The results of the maximum and average fitness also indicate that the it is more difficult for the system to generate higher fitness values when the fitness already reaches a relative fixed value (e.g. 0.95 for image 2003). In other words, the system is unable to find a lower minimum independent of the number of generations and genetic operations. Therefore, computation time is also accounted in this stage to achieve more meaningful and accurate optimal parameters and the desirable fitness (a relative high fitness) is used as stopping criteria in this stage.
Based on analysis of the result from the preliminary exploration stage, an approximate range of fitness values have been selected. Hence, the fitness threshold is set as 0.95, which is selected between average and highest fitness. System running time and generation number are collected from each explored parameter setting after fitness threshold (stopping criterion) reached. All explored range of the parameter setting is illustrated in Table 3.
Parameter Explored Values
Generation Number Not consider
Population Size Vary from 800 to 1500, common
difference is 100 Percentage of
Mutation & Crossover
The total percentage of Mutation and Crossover is 20%, 30% and 40%. If the total percentage is 20% and mutation varies percentage from 0 to 20%, then crossover has priority.
Order of Mutation & Crossover
Mutation is over Crossover and Crossover is over Mutation
Table 3 Range of parameter setting explored in the time exploration stage
4. PERFORMANCE EVALUATION
We implemented our system on a computer cluster that consisted of 8 blade servers, with each server consisting of two CPU-Intel Xeon CPU E5-2450 2.10GHz, eight cores and 47 GB internal memory size. The total available number of processing cores of each server was 32. The operating system was the Ubuntu 12.04. The original satellite image used for the performance evaluation was acquired with the QuickBird sensor of Oxford, Mississippi, USA, and was composed of four spectral bands: Blue (485 nm), Green (560 nm), Red (660 nm), and Near Infra-red (830 nm) (Momm et al., 2008) (Figure 3). The system was evaluated based on two primary performance benchmarks: highest fitness value in the preliminary exploration stage and the computation time in the formal exploration stage.
Figure 3. Example of a satellite image obtained with the QuickBird Sensor (RGB – 432)
4.1 Highest Fitness Value
Obtaining the higher possible fitness value (also referred to as global minimum) is the primary objective of stochastic methods such as genetic programming. Therefore, highest fitness is the one major assessment criterion. Due to the randomness associated with the development of the first generation in the genetic programming algorithm, the highest fitness generated in each generation has no obvious regularity. Hence, multiple replications for each configuration were used. All diagrams in Figure 4 illustrate the mean, minimum, maximum and standard deviation of all highest fitness obtained from each generation when using different parameter setting.
Investigations of population size demonstrate the relationship between population size and mean, minimum, and standard deviation of all highest fitness is exponential and when the population size is increased into 1,500, the growing trend of mean, minimum, and standard deviation become less noisy (e.g. Figure 4.X.1, Figure 4.X.2, and Figure 4.X.4). Although the exponential relationship between the population size and highest fitness is not explicit, it can be noted that the growing trend of highest fitness become slowly when the population size increasing into 1,500 (e.g. Figure 4.1.3, Figure 4.2.3, and Figure 4.3.3 and Figure 4.4.3). These evidences demonstrate that the difference of the performance is extremely small when the population size exceeds 1,500. However, the larger population size will consume more computer resource (e.g. CPU and Memory) and execution time. There is a tradeoff between computational time and additional generations (additional iterations). Therefore, the optimal population size derived from results of the fitness exploration stage is around 1,500.
Regarding the percentage of mutation and crossover, the results reflect that there is no significant difference between the mean, minimum, maximum and standard deviation of top fitness values when using different parameter setting. However, it still worth noting that better performance arises from higher percentage of mutation and crossover and the growing trend of mean, maximum, minimum, and standard deviation of all highest fitness becomes smother when increasing the total percentage of mutation and crossover. This can be attributed to higher percentages of crossover and mutation contributes to increased population diversity and therefore faster convergence. When the total percentage is 20%, the best percentage of mutation is arranges from 12% to 20% (that is, the percentage of crossover is result of using 20% subtract the percentage of mutation and the remaining 80% is replication). When the total percentage is 30% or 40%, mutation is arrange 25% to 30% and from 30% to 40%, respectively. Moreover, the performance of mutation over crossover and crossover over mutation indicate the optimal order of mutation and crossover is mutation over
crossover when the total percentage of mutation and crossover is 20%.
Figure 4.1.1 Mean Fitness of All Highest Fitness
Figure 4.1.2 Minimum Fitness of All Highest Fitness
Figure 4.1.3 Maximum Fitness of All Highest Fitness
Figure 4.1.4 Standard Deviation of All Highest Fitness
Figure 4.1 Total Percentage of Mutation and Crossover is 20% (Crossover over Mutation)
0 1 2 3 4 5 6 7 8 910 11 12 13 14 15 16 17 18 19 20
Percentage of Mutation Population Size
Percentage of Mutation Population Size
Percentage of Mutation Population Size
Percentage of Mutation
S
Figure 4.2.1 Mean Fitness of All Highest Fitness
Figure 4.2.2 Minimum Fitness of All Highest Fitness
Figure 4.2.3 Maximum Fitness of All Highest Fitness
Figure 4.2.4 Standard Deviation of All Highest Fitness
Figure 4.2 Total Percentage of Mutation and Crossover is 20% (Mutation over Crossover)
Figure 4.3.1 Mean Fitness of All Highest Fitness
Figure 4.3.2 Minimum Fitness of All Highest Fitness
Figure 4.3.3 Maximum Fitness of All Highest Fitness
Figure 4.3.4 Standard Deviation of All Highest Fitness
Figure 4.3 Total Percentage of Mutation and Crossover is 30% (Mutation over Crossover)
0 1 2 3 4 5 6 7 8 9 10 11 12 13 14 15 16 17 18 19 20
Percentage of Mutation Population Size
Percentage of Mutation Population Size
Percentage of Mutation Population Size
Percentage of Mutation
S
Percentage of Mutation Population Size
Percentage of Mutation Population Size
Percentage of Mutation Population Size Percentage of Mutation
S
Figure 4.4.1 Mean Fitness of All Highest Fitness
Figure 4.4.2 Minimum Fitness of All Highest Fitness
Figure 4.4.3 Maximum Fitness of All Highest Fitness
Figure 4.4.4 Standard Deviation of All Highest Fitness
Figure 4.4 Total Percentage of Mutation and Crossover is 40% (Mutation over Crossover)
Figure 4. Mean, Min, Max and Standard Deviation of all highest fitness generated in each generation for various population size and percentage
of mutation and crossover
4.2 Computation Time:
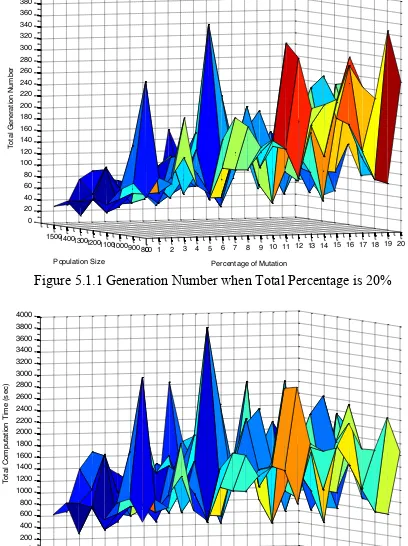
The generation number directly impacts on the computation time, hence the total generation number is also considered as an auxiliary factor to measure the computation time. Figure 4 shows the total generation number and computation time taken by different parameter setting after reaching the threshold of fitness. The results also demonstrate that the trend of generation number is extremely similar with the computation time for different parameter setting.
The diagrams indicate that the computation time for each random combination of the parameters is highly unpredictable and irregular because of the huge change between the computation time. Although there is no obvious evidence to determine which specific parameter setting is optimal, the trend of the computation time still illustrate that the less computation time resulted from the more total percentage of the mutation and crossover as well as the higher population size, and the downward trend of computation time becomes more and more smoothly when increasing the total percentage of the mutation and crossover or the population size. Moreover, the diagrams also reflect that the optimal percentage rate of the mutation and crossover should be 1:19 or 19:1 for each total percentage. Therefore, the conclusion resulted from this time stage is that the optimal population size is 1500, the optimal percentage of mutation ranges from 0 to 5% and the optimal percentage of crossover ranges from 40% to 35% or mutation ranges from 35% to 40% and then crossover ranges from 5% to 0.
Figure 5.1.1 Generation Number when Total Percentage is 20%
Figure 5.1.2 Computation Time when Total Percentage is 20% 0 1 2 3 4 5 6 7 8 910111213141516171819202122232425262728293031323334353637383940
100
Percentage of Mutation Population Size
0 1 2 3 4 5 6 7 8 9 10111213141516171819202122232425262728293031323334353637383940 100
Percentage of Mutation Population Size
0 1 2 3 4 5 6 7 8 9 10111213141516171819202122232425262728293031323334353637383940 100
Percentage of Mutation Population Size
Percentage of Mutation
S
Percentage of Mutation Population Size
Percentage of Mutation Population Size
Figure 5.1.3 Computation Time for Population Size, 1,500 Figure 5.1 Total Percentage of Mutation and Crossover is 20% (Mutation over
Crossover)
Figure 5.2.1 Generation Number when Total Percentage is 20%
Figure 5.2.2 Computation Time when Total Percentage is 30%
Figure 5.2.3 Computation Time for Population size, 1,500 Figure 5.2 Total Percentage of Mutation and Crossover is 30% (Mutation over
Crossover)
Figure 5.3.1 Generation Number when Total Percentage is 40%
Figure 5.3.2 Computation Time when Total Percentage is 40%
Figure 5.3.3 Computation Time for Population Size, 1,500
Figure 5.3 Total Percentage of Mutation and Crossover is 40% (Mutation over Crossover)
Figure 5 Generation Number, Computation Time, and Computation Time when Population Size is 1,500 after reaching the threshold of
fitness
5. DISCUSSION AND FUTURE WORK
Variations of input parameters have a significant impact on the convergence of the algorithm and the time spent to arrive at the optimal solution. These distinct differences also demonstrate that different parameter setting with genetic algorithm could result in varying efficiency of feature extraction. The main reason for these differences in performance is the randomness associated with the development of the initial population. Genetic operations, mutation and crossover, change the structure of the candidate solutions, especially the crossover, which exchanges the subtree of the each candidate solutions mutually. These promote the diversity of the population, which
0 2 4 6 8 10 12 14 16 18 20
Percentage of Mutation
T
0 1 2 3 4 5 6 7 8 9 101112131415161718192021222324252627282930
800
Percentage of Mutation Population Size
Percentage of Mutation Population Size
Percentage of Mutation
T
0 1 2 3 4 5 6 7 8 910111213141516171819202122232425262728293031323334353637383940
800
Percentage of Mutation Population Size
0 1 2 3 4 5 6 7 8 910111213141516171819202122232425262728293031323334353637383940
800
Percentage of Mutation Population Size
Percentage of Mutation
T
is an important characteristic for successful evolution of the algorithm. In both preliminary and formal exploration stages, a large number of input parameters have been explored. The result data from both two stages indicates the approximate performance tendency. Additional range of parameter setting will be explored to complement the experiment and make a complete evaluation of optimal parameters more accurately in the future.
Due to the randomness of the genetic algorithm, it would be beneficial to run additional replications of the system to generate a larger experiment data set. Moreover, working with additional images would assure that the solutions developed are not too specific to the training dataset and therefore it would ensure the optimal parameters are more representative when applied to images with different characteristics.
Finally, the most significant factor to estimate the optimal parameters is the selection of the assessment. Different assessment criterion could lead to different optimal parameters.
6. CONCLUSION
The findings we have presented in this paper is from a large number of runs over a wide range of parameters. Our analysis of the data indicates that the difference between the performance of different parameter setting is small, and often statistically insignificant, especially the performance of achieving a pre-determined fitness value. However, it still demonstrates that some particular range of parameter setting can result in better performance than others. The overall finding from this study is that better performance, measured through pre-defined fitness value and less computation time, is obtained from larger values of population size and percentage of genetic operations. However, the increasing performance trend gradually levels off after some parameters are reached. Therefore, the optimal parameters were selected among these fixed values after carefully comparing the subtle difference between the performances achieved by these fixed values. Based on the analysis of the results obtained from the fitness and time exploration stage, the final optimal population size is around 1500, the optimal percentage of mutation and crossover ranges from 35% to 40% and from 5% to 0, respectively, and the mutation should be applied with the top best candidate solutions before crossover.
ACKNOWLEDGEMENTS
This work is supported in part by a National Science Foundation (NSF) Grant HRD-1137466, Department of Homeland Security (DHS) SLA grant 2010-ST-062-0000041, 2011-ST- 062-0000046 and 2014-ST-062-000059
REFERENCES
Abraham, A., Nedjah, N. and Mourelle, L. D. M., 2006. Evolutionary Computation: from Genetic Algorithms to Genetic Programming. In: Genetic Systems Programming: Theory and
Experiences, Vol. 13, pp 1-20.
http://www.softcomputing.net/gpsystems.pdf (July 2014).
Gong, P., 2003. “Information Extraction: In Remote Sensing and Image Analysis,” University of California at Berkeley http://nature.berkeley.edu/~penggong/textbook/chapter7/html/se ct73.htm (Sept. 2013).
Khorram S., Nelson S. A.C., Koch, F. H. and Van Der Wiele, C. F., 2012. Remote Sensing, Springer-Verlag, US, pp: 17-28. 39-56.
Koza, J. R., 1992. On the Programming of Computers by Means of Natural Selection, Cambridge, MA: The MIT Press.
http://www.ru.lv/~peter/zinatne/ebooks/MIT%20-%20Genetic%20Programming.pdf (Sept. 2013).
Momm, H. and Easson, G., 2011a. Feature Extraction from High-Resolution Remotely Sensed Imagery using Evolutionary Computation. In: Evolutionary Algorithms, Prof. Eisuke Kita, Ed..
Momm, H. and Easson, G., 2011b. Evolving spectral transformations for multitemporal information extraction using evolutionary computation. Journal of Applied Remote Sensing, 5(1).
Momm, H., Easson, G. and J. Kuszmaul, 2008. Uncertainty analysis of an evolutionary algorithm to develop remote sensing spectral indices, in Image Processing: Algorithms and Systems VI, edited by Jaakko T. Astola, Karen O. Egiazarian, Edward R. Dougherty, Proceedings of SPIE-ISandT Electronic Imaging, SPIE Vol. 6812, 68120A.
Moore, A., (2001). “K-means and Hierarchical Clustering–
Tutorial Slides,”
http://www-2.cs.cmu.edu/~awm/tutorials/kmeans.html (Jan 2014).
Robinson, A., 2001. Division III thesis “Genetic Programming: Theory, Implementation, and the Evolution of Unconstrained Solutions”, Hampshire College, Amherst, MA. http://faculty.hampshire.edu/lspector/robinson-div3.pdf (Sept. 2013).
Luke S, Spector L. A comparison of crossover and mutation in genetic programming[J]. Genetic Programming, 1997, 97: 240-248.