LAND USE LAND COVER CLASSIFCATION USING LOCAL MUTIPLE PATTERNS
FROM VERY HIGH RESOLUTION SATELLITE IMAGERY
Suresh kumar Ramaswamy a*, Mahesh Balaji Arumbaakam Ranganathan a a
Audio Visual Intelligence Center of Excellence (AVI-COE), Global Technology Office, Cognizant Technology Solutions, India * [email protected] and [email protected]
Commission VIII, WG VIII/8
KEY WORDS: LULC classification, Local Multiple patterns WorldView-2, Texture, Neural network classifier
ABSTRACT:
The recent development in satellite sensors provide images with very high spatial resolution that aids detailed mapping of Land Use Land Cover (LULC). But the heterogeneity in the landscapes often results in spectral variation within the same and spectral confusion among different LU/LC classes at finer spatial resolution. This leads to poor classification performances based on traditional spectral-based classification. Many studies have been addressed to improve this classification by incorporating texture information with multispectral images. Although different methods are available to extract textures from the satellite images, only a limited number of studies compared their performance in classification. The major problem with the existing texture measures is either scale/orientation/illumination variant (Haralick textures) or computationally difficult (Gabor textures) or less informative (Local binary pattern). This paper explores the use of texture information captured by Local Multiple Patterns (LMP) for LULC classification in a spectral-spatial classifier framework. LMP preserve more structural information and involves less computational efforts. Thus LMP is expected to be more promising for capturing spatial information from very high spatial resolution images. The proposed method is implemented with spectral bands and LMP derived from WorldView-2 multispectral imagery acquired for Madurai, India study area. The Multi-Layer-Perceptron neural network is used as a classifier. The proposed classification method is compared with LBP and conventional Maximum Likelihood Classification (MLC) separately. The classification results with 89.5% clarify the improvement offered by the LMP for LULC classification in comparison with the conventional approaches.
1. INTRODUCTION
Satellite images are becoming available at very finer resolutions since last two decades that offer great potential for earth observation. Especially the launch of WorldView-2 is making a major contribution towards the advancement of detailed mapping of landscape features (Pacifici et al, 2009). Hence proving the commercial remote sensing industry is providing higher possibilities for mapping and monitoring Land Use (LU)/Land cover (LC) features (Aitkenhead & Aalders 2011). However mapping LULC from Very High Resolution (VHR) imagery possesses many challenges (Giada et al, 2003): 1) Complexity owing to the high internal variability in landscape units causing spectral confusion within same and different LULC units (Lu et al, 2010), 2) Requirement of adapting special image analysis techniques to extract useful input features to stack with spectral profiles (Lu et al, 2010), 3) Failure of traditional classification technique such as using parametric classifiers in classifying complex landscapes (Chellasamy et al, 2014a) and many more. Thus, in this paper a classification technique that can cope with the three above mentioned challenges is addressed.
An image analysis widely followed by researchers to improve LULC classification from VHR imagery is texture analysis (Chellasamy et al, 2014a, Puissant et al, 2005, Herold et al, 2003). Incorporation of spatial information/image texture
reduces the effect of spectral variation with in same landscape class. The studies have proved the improvement in overall classification accuracy of LULC classification by using spatial information inherent in VHR images. Several approaches can be found in the literatures for measuring texture information. Omni directional Grey Level Co-occurrence Measures (GLCM) are used by Herold et al, (2003) to characterize the spatial information. The texture measures are calculated by second-order statistics such as variance and contrast at displacement of five pixels. Geostatistics from spectral variogram are used by Yoo et al, (2006) to estimate level index map for determining the complexity of landscapes in VHR images and shown to be promising for LULC mapping. Wang et al, (2006) used Local Binary Patterns (LBP) to capture the spatial details of structured landscape features like roads. The study by Wassenaar et al, (2002) used Discrete Fourier Transform (DFT) to capture the texture details of different crop types and proved to show good performance in mapping irrespective of variable soil surface and spatial structure within same crop types. Gabor filters has been a power tool for texture feature extraction due to their optimal localization characteristics in spatial-frequency domain (Clausi & Jernigan, 2000, Unser 1995).
While many approaches are available for characterizing spatial details, the performance of each approach is found to be dependent on nature of the imagery, types of landscape features, scale of measurement, orientation etc. (Lloyd et al, 2004). The International Archives of the Photogrammetry, Remote Sensing and Spatial Information Sciences, Volume XL-8, 2014
Although there are potential remarks about the above mentioned texture analysis for LULC mapping, some literatures (Lloyd et al, 2004, Lucieer et al, 2005) address their failure certain cases. LBP extraction which is one of the structural methods of texture analysis is said to have limitation as it do not produce adequate information to characterize the complex patterns (Lloyd et al, 2004). The study by Shahbahrami et al, (2012) shows that process of computing GLCM is computationally intensive and time consuming. Also GLCM suffers from its dependency on scale, orientation and illumination (Goswami, 2010). Although Gabor textures, a feature-based texture analysis derives texture measures directly from the image is claimed to be invariant to scale and orientation, still it depends on number of scale and orientation and also has computational complexity (Sandler & Lindenbaum, 2006). It is critical to choose an apt texture analysis for exploring spatial information from images at finer resolutions.
The key contribution of this paper is to address the use of texture information captured by Local Multiple Patterns (LMP) for LULC classification using VHR imagery. The use of LMP has received a very little attention in the remote sensing community (Zhu et al, 2010). The basic idea of LMP is the extension of binary patterns. It claims to preserve structural information better than LBP and has less computational complexity than other existing geostatistical, co-occurrence and wavelet textures (Zhu et al, 2010, Zhou et al, 2013). LMP represents the local spatial information in rapid extension of feature dimension thereby providing adequate information to represent spatial details and also it is found to be robust in flat image area analysis. Being a growing hot topic in texture analysis, many literatures are not available for further discussion in this section.
As aforementioned, the choice of classifier is also important for accurate LULC classification, nonetheless Neural Networks (NN) is widely used recently (Chellasamy et al, 2014a, Briem et al, 2002, Chandra & Yao, 2006, Kumar et al, 2013). The non-parametric classifiers with multi-input are widely used for addressing the problem of differentiating complex classes. NN is one of the non-parametric classifiers that show promising results with unknown non-linear models (Chellasamy et al, 2014b). They can model the non-linearity underlying the input data distribution through parallel processing. The adaptive capability of NN in learning multiple data with good generalization is one of the attractive features for the researchers relying on NN.
The experimental setup for this study concerns LULC classification based on VHR imagery and mainly involves two contributions: 1) addressing the use of LMP textures features from WorldView-2 (WV-2) multispectral 2) evaluating the performance of LMP at various resolution Neural Network (NN), a powerful classifier trained with different inputs is used for classification.
2. STUDY AREA AND DATASET
The study area is situated in Madurai, India, third largest city in Tamil Nadu. The city of Madurai lies on the flat and fertile plain of the river Vaigai, which runs in the northwest-southeast direction through the city. A part of Madurai city that occupies an area of 400 hectare with complex landscapes (15 classes) was selected as study area after detailed analysis of the input data.
The study area is covered by multispectral World View-2 (WV-2) imagery acquired on 2009 during summer. WorldView-2 imagery brings a high degree of spectral and spatial details for reliable discrimination of LULC classes in comparison to other multi-spectral satellite imagery. Its increased spectral fidelity due to the addition of new bands like coastal blue, yellow, red edge, two Near Infra-Red (NIR) bands with traditional bands (blue, green, red) at very fine spatial details (2m) is the reason for this data to be selected for LULC mapping.
3. METHODOLOGY
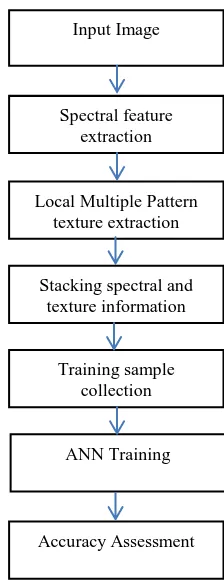
In this paper, we propose a novel texture measure LMP coupled with spectral information based image classification algorithm. Detailed flow of the algorithm is presented in fig 1. The input world view 2 image containing 8 spectral band is combined with the LMP texture feature. Details of the texture feature computation are presented in section 3.1.
Figure 1. Work flow of the proposed methodology
3.1 Local Multiple Pattern (LMP)
LBP is composed of 0s and 1swhich does not have sufficient information to discriminate multiple patterns. An extension of LBP is LMP from binary patterns to multiple patterns made to be more robust for image analysis, including the analysis of flat image areas (Zhu & Wang, 2012). Number of middle patterns between 0 and 1 are added which led LMP more informative than LBP. The mathematical expressions involved in calculating LMP measures are given below as
The in LMP is defined as
where is defined as and its approximate form can be expressed as
where corresponds to the gray values of the centre pixel of a local neighbourhood.
corresponding to gray values of p of pixels equalyy spaced on a circle of radius R(R > 0) that form a circularly symmetric set of neighbors.
,
where and are the maximum and minimum
values of , respectively. N is an odd number corresponds to the number of divided patterns for suitable analysis of the flat areas. When the representation of N equals 3, LMP leads to Local Triple Pattern (LTP) and can be expressed as below.
Figure 2 depicts the LTP computation for a 3X3 image sample containing the flat area with little noise. Here Th0 is set to 3 and an example of LTP8,1. Even though the samples area is flat and contains very less difference, there is a significant difference in the computed LTP which leads to
much higher performance than the LBP in terms of noise reduction.
3.2 Artificial Neural Network
Since 1980, ANN has been widely used for classifying the remotely sensed data producing a good accuracy compared to statistical classifiers. Multi Layer Perceptron (MLP) is one of the most popularly and widely used NN which is composed of three layers namely input layer, hidden layer and output layer. Sigmoid function, which falls in a continuous range from 0 to 1, is used as the rule for calculating the output signal. Back propagation followed by conjugate gradient descent algorithms is used in this study. The performance of the neural network depends on two factors, namely external and internal factors. The external factors are the characteristics of the input data while the internal factors depend upon the selection of appropriate weights, learning rate, momentum, network structure (16:15:15), number of iterations and nodes etc. Trial and error method is the widely used technique to fix this problem and hence learning rate (0.4), momentum (0.4), network structure (16:15:15) are adopted in this study. The spectral and texture information is stacked together for training
sample collection. The “winner-takes-all” approach is chosen for training and testing the system.
3.3 Training Sample Collection
Density and appropriate selection of training and test samples selection plays a key role in image classification. Taking this in to consideration, 150 pixels are selected carefully from each class which totals to 2250 out of which 75 pixels are used for training and the rest is used for testing.
4. RESULTS AND DISCUSSION
The steps involved in image classification are entirely performed in MATLAB R2013b. The samples obtained for training and testing the data are performed using Neural Network Toolbox. The LTP texture features are computed by extending to combine neighbors with different sizes or different shapes. By altering P and R, multiresolution analysis can be achieved by combining the information provided by multiple operators of varying (P,R). For example, the neighbors with different R, such as LTP8,1 + LMP8,2 + LTP8,3, are combined to 14 6 4 2 1 1 1 3 9
3 5 0 1 0 2187 27 11 7 2 2 1 0 729 243 81
LTP Pattern: 21100121
LTP Code: 2*1+1*3+1*9+0*27+0*81+1*243+2*729+1*2187=3902
Figure 2. Computation of LTP
Sum of Product - LTP
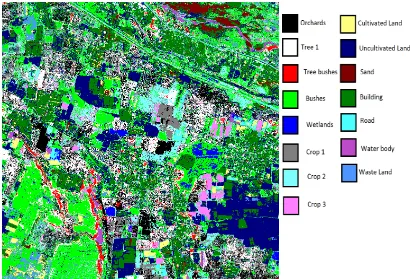
Figure 3. Classified image using stacked spectral and LTP8,1 feature
Figure 4. Classified image using MLC using spectral features
extract features for texture classification and the classification accuracy was evaluated. The threshold values has evaluated in trial and error basis and was estimated to be 5 as the optimal value giving better classification accuracy.
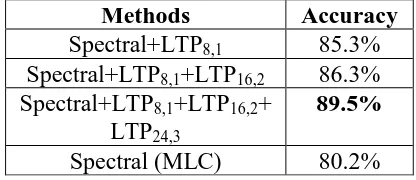
The spectral information extracted from the image is stacked with the LTP texture feature with multiresolution information. 75 pixels/class is used to for training the ANN. The accuracy of the proposed method is depicted in table 1 which is 89.5% (Figure 3). The results are compared with the conventional MLC classifier and the accuracy is 80.2% (Figure 4). The effect of multiresolution analysis LTP8,1 + LMP8,2 + LTP8,3 gave the maximum testing results. Individual (P,R) combinations results are reported in table 1. Stacking the texture feature to spectral information significantly increased the accuracy to ~9%. Orchids and Tree 1 had greater misclassification results in spectral approach while incorporating the texture information, there is a 5% increase in accuracy specific to that class. Water bodies and Road class topped the individual class accuracies. In the classified image, tree bushes and bushes classes are well demarcated since the multi-resolution LTP texture feature incorporation. Also, even though the cultivated and uncultivated land share the same spectral information, incorporation of the contextual information which even has the ability to discriminate the flat regions increased the interclass accuracies and reduced the misclassification between other classes. Out of 15 classes, the accuracies of many classes have increased numbers compared to conventional spectral based approach.
5. CONCLUSION & FUTURE WORK
A robust VHR image classification technique is proposed and proved to show promising results. The rotation invariant feature in Local Multiple Pattern approach plays a significant role in feature extraction. Besides, LMP is resilient to noise and hence with inclusion of variance which highlights the class transition regions, the feature extraction can be made efficient. Hence as part of future work, implementation of a method that’s results in increased accuracy by inclusion the aforementioned feature will be carried out.
ACKNOWLEDGEMENT
The WorldView-2 data used in this research was provided by Digital Globe data provides in connection to WorldView-2 eight band challenge proposal. We sincerely thank them for supporting with the data.
REFERENCES
Aitkenhead, M. Aalders, I.,2011. Automating land cover mapping of Scotland using expert system and knowledge integration methods. Remote Sensing of Environment, 115, pp. 1285-1295.
Briem,G.J., Benediktsson,J.A. & Sveinsson,J.R., 2002.Multiple classifiers applied to multisource remote sensing data.Geoscience and Remote Sensing, IEEE Transactions on, 40, pp. 2291-2299.
Chellasamy,M., Zielinski,R.T. & Greve,M.H.,2014a. A Multievidence Approach for Crop Discrimination Using Multitemporal WorldView-2 Imagery.Selected Topics in Applied Earth Observations and Remote Sensing, IEEE Journal of, 7, pp. 3491-3501.
Chellasamy,M., Ferre,T.& Humlekrog Greve,M., 2014b. Automatic Training Sample Selection for a Multi-Evidence Based Crop Classification Approach.ISPRS-International Archives of the Photogrammetry, Remote Sensing and Spatial Information Sciences, 1, pp. 63-69.
Clausi,D.A. & Jernigan,M., 2000. Designing Gabor filters for optimal texture separability. Pattern Recognition, 33, pp. 1835-1849.
Giada, S., De Groeve,T., Ehrlich,D. & Soille,P., 2003. Information extraction from very high resolution satellite imagery over Lukole refugee camp, Tanzania. International Journal of Remote Sensing, 24, pp. 4251-4266.
Goswami,B., 2010. Texture Based Image Segmentation using GLCM.
Herold, M., Liu, X. & Clarke, K.C.,2003. Spatial metrics and image texture for mapping urban land use. Photogrammetric Engineering & Remote Sensing, 69, pp. 991-1001.
Kumar, R. S., Menaka, C. & Cutler, M.,2013. Ann Based Robust LULC Classification Technique Using Spectral, Texture and Elevation Data. Journal of the Indian Society of Remote Sensing, 41, pp. 477-486.
Lloyd, C., Berberoglu, S., Curran, P. & Atkinson, P., 2004. A comparison of texture measures for the per-field classification of Mediterranean land cover. International Journal of Remote Sensing, 25, pp. 3943-3965.
Lu, D., Hetrick,S. & Moran, E., 2010. Land cover classification in a complex urban-rural landscape with QuickBird imagery.Photogrammetric Engineering & Remote Sensing, 76, pp. 1159-1168.
Lucieer, A., Stein,A. & Fisher,P., 2005. Multivariate texture based segmentation of remotely sensed imagery for extraction of objects and their uncertainty.International Journal of Remote Sensing, 26, pp. 2917-2936.
Pacifici, F., Chini, M. & Emery,W.J., 2009. A neural network approach using multi-scale textural metrics from very high-resolution panchromatic imagery for urban land-use classification. Remote Sensing of Environment, 113, pp. 1276-1292.
Methods
Accuracy
Spectral+LTP
8,185.3%
Spectral+LTP
8,1+LTP
16,286.3%
Spectral+LTP
8,1+LTP
16,2+
LTP
24,389.5%
Spectral (MLC)
80.2%
Table 1. Comparison of overall classification accuracy
Puissant, A., Hirsch, J. & Weber, C., 2005. The utility of texture analysis to improve per‐ pixel classification for high to very high spatial resolution imagery.International Journal of Remote Sensing, 26, pp. 733-745.
Sandler, R. & Lindenbaum,M., 2006. Gabor filter analysis for texture segmentation. in Computer Vision and Pattern Recognition Workshop, 2006. CVPRW'06. Conference on, pp. 178-178.
Shahbahrami, A., Pham, T.A. & Bertels, K., 2012.Parallel implementation of Gray Level Co-occurrence Matrices and Haralick texture features on cell architecture.The Journal of Supercomputing, 59, pp. 1455-1477.
Unser, M., 1995. Texture classification and segmentation using wavelet frames. Image Processing, IEEE Transactions on, 4, pp. 1549-1560.
Wang, Y., Tian, Y., Tai, X. & Shu, L., 2006. Extraction of Main Urban Roads from High Resolution Satellite Images by Machine Learning.Computer Vision – ACCV 2006, 3851, pp. 236-245.
Wassenaar, T., Robbez-Masson, J.M., Andrieux, P. & Baret, F., 2002.Vineyard identification and description of spatial crop structure by per-field frequency analysis. International Journal of Remote Sensing, 23, pp. 3311-3325.
Yoo, H.Y., Lee, K. & Kwon, B.D., 2006. Spatial Pattern Analysis of High Resolution Satellite Imagery: Level Index Approach using Variogram.Korean Journal of Remote Sensing, 22, pp. 357-366.
Zhou, L., Fang, B., Li, W., Chen, H. Wang, L.,2013. An adaptive fuzzy fusion framework for face recognition under illumination variation based on local multiple patterns. International Journal of Pattern Recognition and Artificial Intelligence, 27.
Zhu, C. Wang,R., 2012. Local multiple patterns based multiresolution gray-scale and rotation invariant texture classification, Information Sciences, 187, pp. 93–108.
Zhu, C., Zhou, H., Wang, R. & Guo, J.,2010. A novel hierarchical method of ship detection from spaceborne optical image based on shape and texture features. Geoscience and Remote Sensing, IEEE Transactions on, 48, pp. 3446-3456. The International Archives of the Photogrammetry, Remote Sensing and Spatial Information Sciences, Volume XL-8, 2014