ANALYSIS AND CORRECTION OF THE DEPENDENCY BETWEEN LASER SCANNER
INTENSITY VALUES AND RANGE
Robert Blaskow, Danilo Schneider1
1
Institute of Photogrammetry and Remote Sensing, Technische Universität Dresden, Germany [email protected]
Commission V, WG V/3
KEY WORDS: terrestrial laser scanning, intensity, range, correction
ABSTRACT:
Intensity values, which are registered by a terrestrial laser scanner system (TLS) for each point of a 3D point cloud in addition to its coordinates, are affected by the characteristic of the measured object and the parameters of the environment. The backscattered electromagnetic signal is influenced in his strength by the reflectivity of the scanned object surface, the incidence angle, the distance between laser scanner and object and the atmospheric respectively system specific setting of the TLS-measurement. The entity of all influences on the signal can be summarized in the laser range equation of Jelalian1. For the investigations of this study the named
influences where divided into two groups. Group 1 includes the surface specific influences. The second group contains all other influences. The correction of the intensity values from the effects of group 2 theoretically allows the determination of similar materials, using similar intensity values in laser scanner point clouds. In this paper the dependency between laser scanner intensity values and range are investigated on the basis of laser scanner data recorded with a Riegl LMS-Z420i. The results are compared with data from the phase-difference laser scanner Zoller+Fröhlich Imager 5006i.
1 Jelalian, 1992
1. INTRODUCTION
The relation between signal intensity and measured distance of points of a terrestrial laser scanner point cloud was already subject of different research projects. For example (Antilla et. al., 2011) present a calibration of signal intensities of terrestrial laser scanners, in order to derive surface reflectivity values of snow covered areas. As a reference Spectralon® targets are used in the same way as in the investigations of (Kaasalainen et. al., 2009). Other research studies analyses the influence of surface characteristics (Buksch et al., 2007) resp. surface inhomogeneities (Pesci & Teza, 2008) on the accuracy of distance measurements and intensity values. Furthermore the geometric and physical influences on the intensity values are investigated in some research projects. For instance (Pfeifer et. al., 2007) and (Pfeifer et. al., 2008) examine the influence of the distance on the intensity. Data-driven and model-driven approaches for the correction of this dependency of airborne laser scanner intensity data are already developed in (Höfle & Pfeifer, 2007). The geometric caused influence of the angle of incidence on the laser scanner signal is subject of investigations of (Kaasalainen et al., 2011) and (Pesci & Teza, 2008).
The study presented in this paper is focused on the analysis of the influence of the distance between laser scanner and object surface on the intensity values. The used instruments are the time-of-flight laser scanner Riegl LMS-Z420i and the phase-difference laser scanner Z+F Imager 5006i. For the investigation of the dependency between intensity and range a white painted board and two Spectralon® (50/99) targets were used. The target board was scanned in different range steps and was orientated perpendicular to the laser scanner, in order to minimize the influence of the incidence angle on the intensity values. The described setup enabled the visualization and analysis of the distance-related decrease of the signal intensity.
This measurement setup was realised in an indoor and outdoor environment.
As the intensity-range-relation depends strongly on the surface structure, there were two Spectralon® targets scanned additionally with the described setup as a reference. Since the Spectralon® targets represent ideal diffuse reflection characteristics, it was possible to evaluate the reflection characteristic of the standard target. The range-intensity-relation of the Spectralon® 99 target was used for a generation of a static correction model. To evaluate the correction model, intensity values representing surrounding walls in a room where corrected.
2. THEORETICAL BACKGROUND
The recorded signal intensity of a laser scanner indicates - from a simplified perspective - the magnitude of the laser pulse back-scattered from the object surface. The influences on the pulse and thus on the signal intensity are all effects beginning from the signal origin up to the signal processing. All influences can be summarized in the laser equation (Pfeifer et al., 2007):
(1)
where PR = detected signal power PE = transmitted signal power α = angle of incidence
ρ = material reflectance coefficient ηAtm = atmospheric transmission factor ηSys = system-caused transmission factor r = range
The effects on the laser signal can be categorized for a better overview. For the investigations presented here the influences are subdivided into the following three groups:
(A) system-caused effects (B) atmospheric effects (C) surface specific effects
This classification is visualized in Fig. 1. Concerning the motivation of this study – the determination of different materials on the basis of intensity values – group A and B can be stated as “undesired” and group C as “desired”.
Figure 1. Classification of effects on the laser signal
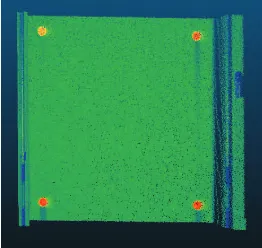
The elimination of influences of group A and B would theoretically allow for a derivation of surface characteristics on the basis of signal intensity. However, a clear separation of these influences is not trivial in practice, because the system-caused and dynamic interventions in the signal processing are not known or accessible for the user of terrestrial laser scanners. These circumstances are obvious in the following example: Fig. 2 shows the intensity values of a point cloud of a section of a white wall, containing 4 retro-reflecting targets at the corners, which have significant higher intensity values (red colour). Below the targets there are points visible with a lower intensity as their neighbour points, although it is exactly the same material. This issue might be explained by a dynamic regulation of the receiver sensitivity.
Figure 2. Intensity problems below retro-reflecting targets
In fact, the described intensity problems are low but nevertheless clearly visible within the data – the difference between “wrong intensity points” and their neighbourhood is 0.022
2 The intensity values processed within this study are directly exported
from the laser scanner software (Riegl: RiScan Pro, Z+F: Lasercontrol). The values have no unit, the range of values is
despite it is the same material.
3. EXPERIMENTS
3.1 Terrestrial laser scanner
For the investigations two laser scanners were used (Tab. 1). The time-of-flight scanner Riegl LMS-Z420i features a high range up to 1000 m. The phase-difference scanner Z+F Imager 5006i has in contrast a high measurement resolution potential and a higher point rate in comparison to the Riegl scanner.
Riegl LMS-Z420i
Z+F Imager 5006i
measurement method time-of-flight phase-difference wavelength [nm] ca. 15003 650 - 690 beam divergence [mrad] 0.25 0.22 measurement range [m] < 1000 < 79
special feature 2 laser modes
Table 1. Specifications of the used terrestrial laser scanners
The Z+F Imager 5006i features two different laser modes, low power and high power. The characteristics of both laser instruments are very different due to the different range measurement methods and both instruments have already been subject of numerous scientific investigations.
3.2 Targets
The analysis is based on different targets, on the one hand with a white painted wooden board with a size of 1 x 1 m² (in the following named as “standard target”) and on the other hand with two Spectralon® targets with a size of 0.30 x 0.30 m² one with approx. 99% and the other one with 50% diffuse reflectance. The standard target is designed considering approximately the Rayleigh roughness criterion (Rees, 2013):
(2)
where λ = wavelength Θ0 = angle of incidence ∆h = surface roughness
This means that the target material has a roughness higher than the threshold regarding the applied wavelengths, when the laser beam is perpendicular to the object surface. Since the material of the standard target shows from a photometrical point of view weak reflections, additionally the two Spectralon® targets were scanned (Fig. 3, right). These targets have an almost ideal diffuse reflecting surface.
Figure 3. Standard target (left); Spectralon® target (right)
3.3 Measurement setup
The laser scanners and the targets were arranged horizontally for each measurement and the targets were approximately aligned orthogonal with respect to the laser scanner. Because of Lambert’s cosine law a precise orthogonal alignment was not necessary:
0
cosΘ
=I
Ireflected (3)
where I = incident signal intensity Ireflected = reflected signal intensity
When the targets are for example rotated by 10°, according to that equation still 98.4% of the incident signal is reflected back to the laser scanner‘s direction.
The targets were scanned several times in different ranges (1m-steps) in an indoor as well as in an outdoor environment.
indoor outdoor
Riegl LMS Z420i 30 m 50 m
Z+F Imager 5006i 38 m -
Table 2. Measurement setup and applied maximum ranges
4. RESULTS
4.1 Single scans (one individual range step)
For each single target position an intensity-distance-diagram can be derived from the recorded data. Fig. 4 visualizes such a dependency diagram for the Riegl scanner with the standard target in 2 m distance. Points labelled with (II) represent points from the border of the target (where only a part of the beam hit the target) and points labelled with (I) are points with significantly higher intensity values in comparison to their surrounding points.
Figure 4. Intensity distribution (range: 2 m; standard target)
Figure 5. Intensity distribution (range: 2 m; Spectralon® 99)
Points in (I) as well as the comparison with the diagram based on data of the Spectralon® target (Fig. 5) show that the standard target has no ideal diffuse backscattering characteristics of the incident laser beams.
The raw data sets were cleaned (deleting points in areas I and II) and an equal-weighted average value was calculated for each individual range step. As result a pair of values (average intensity and average distance) was available for each target position for further analysis.
4.2 Multiple Scans (all range steps for each target)
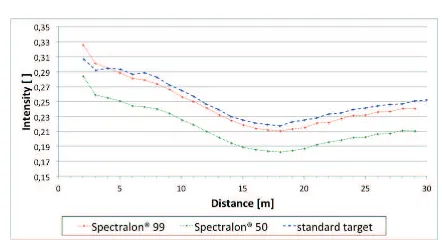
The pair of values (average intensity and average distance) for each range step can be visualised in an intensity-distance-diagram over the whole range of scanned distances.
Riegl LMS-Z420i – Indoor
Figure 6. Averaged intensity diagram (Riegl, indoor)
For the Riegl laser scanner this diagram shows a very similar characteristic as already presented in (Pfeifer et al., 2007). Contrary to the physical theory the signal intensity increases slightly behind a distance of 18 m for all used targets (Fig. 6). Comparing the results from the standard target with those from both Spectralon® targets there is besides the constant offset over the whole range a small variation below 7 m visible, possibly due the shortcomings of the standard target (in particular the non-ideal diffuse reflection properties).
Riegl LMS-Z420i – Outdoor
Figure 7. Averaged intensity diagram (Riegl, outdoor)
The outdoor measurements over a range of 50 m were carried out using the standard target only. The intensity-distance-diagram shows that the signal intensity (after the increase in a distance of 18 m) decreases again behind a distance of 38 m (Fig. 7). In spite of different atmospheric and lighting conditions there are no significant differences of the average intensity values from the indoor and outdoor investigations visible.
I
II
Z+F Imager 5006i – Indoor
Figure 8. Averaged intensity diagram (Z+F, indoor)
The intensity-distance-diagram of the Z+F data (Fig. 8), achieved analogue to the description in section 4.1, shows in contrary to the same diagram of the Riegl laser scanner an decreasing course over the whole range of scanned distances – apart from the very close range (< 4 m), where the instrument seems to attenuate the signal intensity slightly in order to avoid overmodulations. The illustrated values base on the “high-power-mode” of the Z+F laser scanner.
5. INTENSITY CORRECTION MODEL
5.1 Polynomial approximation
As basis for the static correction model the intensity-distance-curves were functionalized. The Spectralon® 99 data served as reference. By means of a regression a sixth-power polynomial with the following form was fitted into the curves:
(4)
where Ia= approximated intensity an=0…6 = polynomial coefficients
D = distance between scanner and object surface
Due to the low average signal intensity values below 4 m the intensity curve of the recorded Z+F laser scanner data was approximated with two subsequent sixth-power polynomials in order to achieve a higher fitting accuracy, one for distances below 12 m and the other one for higher distances. The fitted polynomials for the Riegl and Z+F intensity data are visualized in Fig. 9 while their properties are summarized in Tab. 3.
Figure 9. Fitted polynom Riegl (left) and Z+F (right)
Riegl Z+F
distance [m] 2 - 29 <12 12 - 29 determinateness r2 0.9985 0.9992 0.9999 min. difference dImin 0.00003 0.00013 0.00002 max. difference dImax 0.00334 -0.00253 -0.00018 Table 3. Properties of fitted polynomials (Riegl and Z+F)
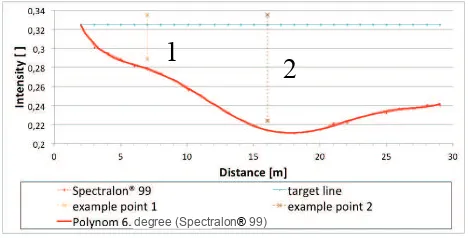
5.2 Static correction model concept
Applying the polynomial derived from the Spectralon® 99 measurements as a reference, for each arbitrary intensity value an offset can be computed. This offset is the difference between a defined target value and the calculated intensity value applying the correction polynomial on the position of a specified distance (Fig. 10). The target value is defined as the maximum intensity value (in case of the Riegl data set in a distance of 2 m) and constitutes the “target line”. In Figure 10 the calculated offset for two example points is indicated.
Figure 10. Concept of the intensity correction (Riegl)
The correction model is named as “static”, since a constant and not changeable correction polynomial is the basis of that model. Intensity-range-diagrams of materials, which are not diffuse-reflective, might vary strongly in their characteristics from those presented in this study. With the presented correction model this issue cannot be compensated.
5.3 Applying the correction model to the standard target
In order to evaluate the static correction model derived from the Spectralon® 99 measurements the raw laser scanner data of the standard target were corrected. Figure 11 illustrates the uncorrected (original) and the corrected signal intensities for all range steps. Obviously the bended original intensity course could be corrected to an almost constant linear intensity course, which means that – assuming the same angle of incidence – same materials result in almost the same intensity values after the correction. Only for short distances, where the intensity curves of the Spectralon® and the standard targets are not parallel (compare Fig. 6), the correction does not perform properly.
Figure 11. Correction of raw intensity values of the standard target (Riegl, indoor)
By computing the averaged intensity values for each range step (each target position) the effect of the correction becomes apparent. As apparent from Table 4, for example the difference between maximal and minimal averaged intensity value was reduced from 0.090 (original data) to 0.026 (corrected data).
1
2
degree (Spectralon® 99)
original corrected average intensity (entire data set) [ ] 0.253 0.332 RMS of all intensity values 0.027 0.006 maximal averaged intensity [ ] 0.218 0.311 minimal averaged intensity [ ] 0.308 0.337
Table 4. Comparison of original and corrected intensity values
5.4 Applying the correction model to scanned wall areas
Finally more realistic example data, scanned walls of a room with different orientation and different distance with respect to the laser scanner (Fig. 12), were corrected applying the presented correction model derived from the Spectralon® 99 measurements. These walls have a bright and homogeneous rough surface, so that similar intensity behaviour can be assumed. The used intensity values of the selected wall areas have been already pre-corrected from the influence of the angle of incidence within the scope of a previous study.
Figure 12. Point cloud of a room (wall areas used for the analysis are labelled)
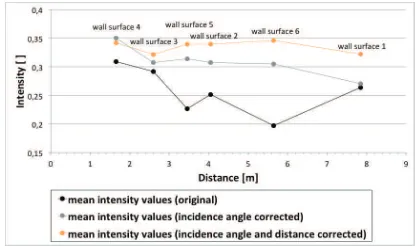
Analogue to the already presented investigations of the standard target, an average signal intensity value was computed for each wall area. This was carried out triply: (a) with original values, (b) with values after the correction of the dependency from the angle of incidence and finally (c) with values after the subsequent correction of the dependency from the distance. The intensity-distance-curves are shown in Figure 13.
Figure 13. Intensity-distance-curves of selected wall areas after different correction steps
It can be seen that the difference between minimal and maximal averaged signal intensity could be decreased from 0.112 to 0.080 after the correction of the dependency from the angle of incidence. The correction of the dependency from the distance, which is subject of this study, was able to further reduce the difference between minimal and maximal averaged signal intensity value from 0.080 to 0.024.
5.5 Applying the Z+F correction model
The correction model for the Z+F laser scanner intensity data, derived using the Spectralon® 99 targets, consists of two subsequent polynomials (Figure 9) and was applied to the Z+F measurements of the standard target in the same way as described in section 5.2 and 5.3 for the Riegl data. The results are presented in Figure 14.
Figure 14. Correction of raw intensity values of the standard target (Z+F, indoor)
Due to the strong decrease of the magnitude of the signal intensity with increasing distances, the correction effect turns out to be quite extensive. The difference between maximal and minimal averaged intensity value was reduced from 0.290 (original data) to 0.081 (corrected data).
The low signal intensities in distances longer than 24 m have the effect that the corrected intensity value contains about 80% of “correction value” and only 20% of “original value” – which means a correction factor of 1:4. This high correction factor limits the further use of the corrected intensity values, as they are highly correlated with the correction model.
6. CONCLUSIONS
The presented investigations show, how the distance dependency of signal intensities vary between different laser scanner devices and between different surface materials. The developed simplified correction model is able to correct intensity values easily. However, strong limitations have to be considered when this correction model is applied: for example already the correction of laser scanner points of a slight glossy painted wooden board shows shortcomings of the presented method, while the correction of points of surfaces which are similar to Spectralon® (e.g. the bright and rough wall areas) turned out to work very well. In particular, points of surfaces with specular reflection components (e.g. as present in case of the standard target) leads to a deviating intensity-distance-curve and are not respectively only insufficient correctable with the approach presented here.
Moreover, differences between intensity values of different surface materials vary only slightly, therefore in most cases the intensity values do not allow for a classification of different materials without any previous knowledge. This issue demonstrates the limitations of the presented correction method well.
1
2
3 4
5 6
ACKNOWLEDGEMENTS
The authors would like to thank the Centre for Integrated Petroleum Research (Bergen, Norway) and in particular Tobias Kurz for providing the Spectralon® targets. Furthermore the authors thank Mandy Schulze for supporting the time-consuming practical measurements.
REFERENCES
Anttila, K., Kasalainen, S., Krooks, A., Kaartinen, H., Kukko, A., Manninen, T., et al. (2011). Radiometric Calibration of TLS Intensity: Application to Snow Cover Change Detection. International Archives of the Photogrammetry, Remote Sensing and Spatial Information Sciences (XXXVIII-5), 175-179.
Bucksch, A., Lindenbergh, R., & van Ree, J. (2007). Error budget of terrestrial Laserscanning: Influence of the intensity remissionon the scan quality. III. International Scientific Congress Geo-Siberia .
Höfle, B., & Pfeifer, N. (2007). Correction of laser scanning intensity data: Data and model-driven approaches. ISPRS Journal of Photogrammetry & Remote Sensing (62), 415-433.
Jelalian, A.V. (1992). Laser Radar Systems. Artech House Radar Library. Arctech House, Incorporated. ISBN: 0890065543
Kaasalainen, S., Krooks, A., Kukko, A., & Kaartinen, H. (2009). Radiometric Calibration of Terrestrial Laser Scanners with External Reference Targets. Remote Sensing (1), 144-158.
Kaasalainen, S., Jaakkola, A., Kaasalainen, M., Krooks, A., & Kukko, A. (2011). Analysis of Incidence Angle and Distance Effects on Terrestrial Laser Scanner Intensity: Search for Correction Methods. Remote Sensing (3), 2207-2221.
Kersten, T., Mechelke, K., Lindstaedt, M., & Sternberg, H. (2009). Methods for Geometric Accuracy Investigations of Terrestrial Laser Scanning Systems. PFG-Photogrammetrie Fernerkundung Geoinformation (4), 301-314.
Pesci, A., & Teza, G. (2008). Effects of surface irregularities on intensity data from laser scanning: an experimental approach. Annals of Geophysics (51), 839-848.
Pfeifer, N., Dorninger, P., Haring, A., & Fan, H. (2007). Investigating terrestrial laser scanning intensity data: quality and functional relations. 8th Conference on Optical 3-D Measurement Techniques , 328-337.
Pfeifer, N., Höfle, B., Briese, C., Rutzinger, M., & Haring, A. (2008). Analysis of Backscattered Energy in Terrestrial Laser Scanning Data. IAPRS (37), 1045-1052.
Rees, G. W. (2013). Physical Principles of Remote Sensing. Cambridge: Cambridge University Press.