Lisa C. Konick and Lee Friedman
Background: This article presents a meta-analysis of thalamic size reduction in schizophrenia.
Methods: Reviewed studies were based on magnetic resonance imaging or postmortem material and included measures of thalamic volume or thalamic area in schizo-phrenic patients and comparison subjects. Meta-analysis I was based on absolute thalamic values (not controlled for overall brain size), and Meta-analysis II evaluated tha-lamic size adjusted for brain size.
Results: Meta-analysis I included data from 15 studies (485 schizophrenic subjects and 500 control subjects). Twelve (80%) of the studies had negative effect sizes, which is consistent with the hypothesis that thalamic size is smaller in schizophrenic subjects compared to control subjects. The composite effect size was20.29 (p,.0001; without outliers: 20.41, p , .0001). Meta-analysis II included data from 11 studies (313 schizophrenic patients and 434 control subjects). Ten (91%) of the studies had negative effect sizes. The composite effect size was20.35 (p ,.0001; without outlier:20.30, p, .0001).
Conclusions: Both meta-analyses indicate a statistically significant, small-to-moderate effect size for thalamic size reduction in schizophrenia; however, the effect size for thalamic size reduction is modest in comparison to that of other structural abnormalities noted in schizophrenia. Biol Psychiatry 2001;49:28 –38 © 2001 Society of Bio-logical Psychiatry
Key Words: Thalamus, schizophrenia, meta-analysis
Introduction
T
he role of the thalamus in schizophrenia has been studied extensively in recent years (for reviews see Andreasen 1997; Heckers 1997; Jones 1997; Weinberger 1997). The thalamus comprises a complex circuitry be-tween multiple brain regions, including the prefrontal cortex, basal ganglia, anterior cingulate, cerebellum, and the sensory, motor, and association regions of the cerebral cortex. Additionally, as pointed out by Andreasen (1997)and Jones (1997), its presumed roles within the brain pose strong implications for a relationship between thalamic abnormalities and schizophrenia.
According to several theories, the etiology of schizo-phrenia is related to a defect in brain circuitry involving the thalamus (Andreasen 1997; Jones 1997; Weinberger 1997). Andreasen and colleagues have postulated a theory of “cognitive dysmetria” in which schizophrenia, as a neurodevelopmental disorder, is caused by a deficit in prefrontal–thalamic– cerebellar circuitry (Andreasen 1997). Jones (1997) discusses the linkage in the break-down of “collective” thalamic components to fragmenta-tion of thought processes common in schizophrenia. Wein-berger (1997) emphasizes that the thalamus has important connections with prefrontal and temporolimbic cortices— two brain areas widely implicated in the pathophysiology of schizophrenia.
Although some studies have reported statistically sig-nificant thalamic size reductions in groups of schizo-phrenic patients compared to normal control subjects (Dasari et al 1999; Flaum et al 1995; Frazier et al 1996; Pakkenberg and Gundersen 1989; Staal et al 1998), most studies have failed to replicate these findings (Andreasen et al 1990; Arciniegas et al 1999; Buchsbaum et al 1996; Corey-Bloom et al 1995; Gur et al 1998; Hazlett et al 1999; Jernigan et al 1991; Lawrie et al 1999; Lesch and Bogerts 1984; Portas et al 1998; Rosenthal and Bigelow 1972). This pattern of inconsistency suggests that there is either no effect or that the magnitude of the effect size—the difference between the means of two groups divided by their pooled standard deviations—is at best only moderate.1
Meta-analysis allows for the integration of studies and enhances statistical power in the estimation of the true population effect size. It has been used to estimate effect sizes for a number of structural abnormalities noted in schizophrenia (Elkis et al 1995; Friedman et al 1992; Hoge et al 1999; Nelson et al 1998; Raz and Raz 1991; Van Horn and McManus 1992; Ward et al 1996; Woodruff et al 1995; Wright et al 2000). Reliable documentation of thalamic size reductions in schizophrenia would have significance for the pathophysiology of the disorder and
From the Department of Psychiatry, Case Western Reserve University School of Medicine, Cleveland, Ohio.
Address reprint requests to Lee Friedman, Ph.D., University Hospitals of Cleve-land, Department of Psychiatry, Hanna Pavilion, B68, 11100 Euclid Avenue, Cleveland OH 44106.
Received April 7, 2000; revised June 22, 2000; accepted June 22, 2000.
1A reviewer suggests a third alternative—that thalamic size reductions are only
found in a subgroup of patients.
© 2001 Society of Biological Psychiatry 0006-3223/01/$20.00
suggest avenues for further research in this area. A recent meta-analysis did attempt to evaluate thalamic size reduc-tions in schizophrenia but included only three studies of thalamic volume (Wright et al 2000), whereas we have included 11–15 studies. In this meta-analytic review, we attempt to determine if the published literature, taken as a whole, supports a conclusion that there is a reduction in absolute or relative (to brain size) thalamic size in schizo-phrenic patients. Because magnetic resonance imaging (MRI) studies of thalamic volume are generally consid-ered to be the “best” studies (as opposed to MRI studies of thalamic area or postmortem neuroanatomic studies), data from such studies is included in the overall estimates and also presented separately.
Methods and Materials
Sample of Studies
Two meta-analyses were conducted. Meta-analysis I was based on raw thalamic values unadjusted for brain size (absolute size), and Meta-analysis II evaluated thalamic values adjusted for brain size (relative size).
Studies were identified through literature searches of MEDLINE using the Internet Grateful Med website (http:// igm.nlm.nih.gov) at the National Library of Medicine. The searches were based on the following medical subject heading categories: thalamus, schizophrenia. The initial search was con-ducted in August 1999 and produced more than 190 articles. To include more recent articles, additional searches were performed through March 2000. Titles and abstracts were evaluated for appropriateness for this study. Case reports, review articles, and letters were culled from the list. Additional articles were identi-fied through the references of relevant studies and review articles. After a review of the articles, with consideration of the inclusion and exclusion criteria below, 16 studies were selected for inclusion in one or both meta-analyses (Meta-analysis I: 15 studies; Meta-analysis II: 11 studies). Selected studies were published between 1972 and 1999. All studies included in the meta-analyses were independently reviewed and evaluated by both authors of this study to obtain consensus on inclusion criteria and quantifiable data.
Inclusion and Exclusion Criteria for Studies
Studies for the meta-analyses had to measure either thalamic volume or thalamic area in a group of patients with schizophre-nia, and compare these data with a nonpsychiatric and nonneu-rologic control group. The studies had to be written in the English language and include sufficient quantitative information for computation of an effect size (see “Effect Sizes” below). It was necessary that effect size estimates were not contaminated by statistically significant differences in age or gender. Analysis of variance andx2analyses were conducted on each study that provided sufficient information to establish that the patient and comparison groups did not differ significantly in age or gender distribution. If this was not possible, and the authors indicated
that there were no significant differences between groups, we included the study. Special procedures were necessary for one study (Flaum et al 1995; see table footnotes). In one study (Gur et al 1998), the groups differed significantly on age even though the age difference was less than 3 years. In our judgment, this difference was not likely to confound comparison of thalamic size and the study was included in the meta-analysis.
Two excluded studies had insufficient information to calculate an effect size (Andreasen et al 1994; Gaser et al 1999). In several cases, data representing the same group of subjects were refer-enced in multiple publications (Pakkenberg 1990, 1992, 1993; Pakkenberg and Gundersen 1989); in these cases, the study containing the most comprehensive, quantitative data were in-cluded in the meta-analyses (Pakkenberg and Gundersen 1989). Two studies (Corey-Bloom et al 1995; Howard et al 1995) included groups of schizophrenic patients with illness onsets after 45 years of age. Data from such groups are not included, because they represent such an unusual and potentially distinc-tive form of the disorder; however, the early onset (,45 years) group from the Corey-Bloom et al (1995) study was incorporated into our analyses.
Effect Sizes
D-STAT software (Johnson 1989) was used for statistical anal-ysis. The effect size employed was the “standardized mean difference,” which is defined as the difference between the mean of the schizophrenia group and the mean of the control group, divided by their pooled SD. The effect sizes were typically calculated from means and SDs, although F values and t values were also employed. The standardized mean differences were corrected for bias due to sample size (a bias found with small samples) with the outcome expressed as “d” (Hedges and Olkin 1985). The direction of effect size was negative if schizophrenic patients had smaller thalamic size compared to control subjects. D-STAT recomputes rough estimates for p values for effects, and we report these as “Our p value” in the data tables. A weighted mean effect size was calculated from the d-scores (Hedges and Olkin 1985). The heterogeneity of effect sizes (Q-statistic) was also tested (Hedges and Olkin 1985); a significant p value in this test suggests that a set of studies is not homogenous.
Fixed Effects Model versus a Random Effects Model
Publication Bias, Funnel Plots, and Fail-Safe N The tendency to publish only significant findings or only those findings in the direction of the hypothesis leads to publication bias. Publication bias can often be detected graphically through “funnel plots” (Light and Pillemer 1984), which plot the total sample size in each study by its effect size. Based on the law of large numbers, larger studies will be most representative of true population effects, and smaller samples will be randomly scat-tered around the central effect size of larger studies, with scatter increasing as study size decreases. This creates an inverted funnel appearance. Publication bias is present when the portion of the funnel surrounding the 0.0 effect size is missing, suggest-ing that small studies with nonsignificant results have not been published. This is often referred to as the “file-drawer problem” (Rosenthal 1979). Orwin (1983) developed a method to deter-mine the number of unpublished studies with null effects (termed the “fail-safe N”) that would be required to reduce the overall effect size to a negligible level.
To understand fail-safe N, assume that there are X studies that are unpublished that have an effect size of 0.0, i.e., absolutely no effect. Further suppose that we will consider our estimate of the thalamic effect size, based on published papers, to be trivial if it is as small as, say, 0.1 (the figure we used in the present meta-analyses). Fail-safe N tells us how many unpublished studies with absolutely no effect are required to bring our computed effect size, based on published studies, down to the trivial target level. Suppose that the fail-safe N is a huge number, for example 1000. It is highly unlikely that there are 1000 studies with no effect that are unpublished, so we don’t have to worry about our conclusion that there is an important effect. Suppose that the fail-safe N is 1. Now we are in trouble, because it is quite likely that there is at least 1 unpublished study with no effect. In other words, a large fail-safe N means that our meta-analytically determined effect size based on published studies is not likely to be threatened by unpublished studies with no effect. Typically, the fail-safe N is employed heuristically (Orwin 1983).
Moderators of Effect Sizes
The influence of various study characteristics as mediators of effect size can be assessed with meta-analytic processes compa-rable to fixed effects analysis of variance or linear regression (Hedges and Olkin 1985). Several potential moderators of effect size were coded for further analysis.
Continuous variables:
1. Study Date: earlier studies on a topic often employ lesser developed methods, with methodology generally becom-ing more advanced over time. This can result in an enlarged or reduced effect size. Therefore, study year was included as a potential predictor of effect size.
2. Percent Male: the percentage of patients that were male was coded to allow for assessment of gender effects. 3. Age: the age of schizophrenic patients was coded to assess
potential age effects.
Categorical variables:
1. Study Method: most studies employed MRI measures, whereas others used postmortem measures.
2. Geometry: some studies were based on volumetric mea-sures, and others were based on measurements of thalamic area.
3. Plane: studies generally employed measurements from one of three planes— coronal, midsagittal, or axial. 4. Reliability: some studies reported interrater reliability
statistics and others did not.
5. Medication: it is reasonable to hypothesize that patients who were medicated may differ significantly from neuro-leptic-naive patients.
6. Control Type: some studies recruited normal volunteers, whereas others used a medical sample.
7. Hemisphere: some studies employed measurements based on the total thalamus, whereas others used only the left or right thalamic region.
8. Covariate Type: for Meta-analysis II, we compared studies that controlled for intracranial size with studies that controlled for brain size.
There was some degree of ambiguity in several cases in assign-ing a study to one category or another, but we made our best estimate and include this information in the relevant table.
In some cases, there were less than four studies in a given category. In these cases, we refrained from formal statistical analysis owing to poor representation of certain levels of an effect.
Results
Meta-Analysis I: Absolute Thalamic Size
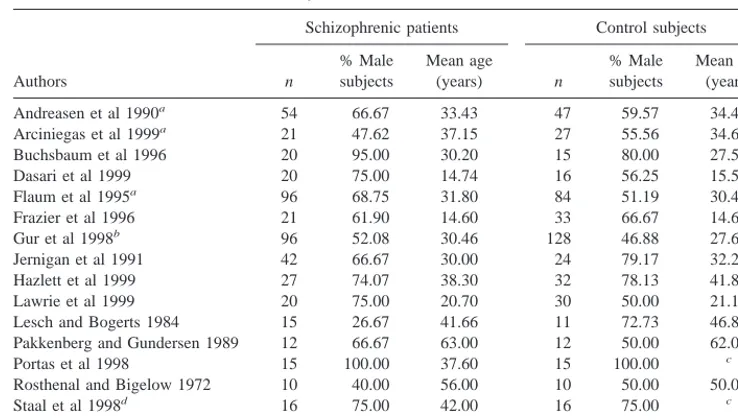
GENERAL DESCRIPTION OF STUDIES. Data from 485 schizophrenic subjects and 500 normal comparison subjects contributed to Meta-analysis I, as outlined in Table 1. The average patient sample size per study was 32.33, compared to an average size of 33.33 in the control group. With two exceptions (Lesch and Bogerts 1984; Rosenthal and Bigelow 1972), all studies were conducted between 1989 and 1999. The average percentage of male subjects across these studies was 65% for the schizo-phrenic groups and 59% for control subjects. The mean age of schizophrenic patients was 34.78, compared to 33.75 in control subjects. With the exception of one study (Flaum et al 1995), the groups were not statistically different in the proportion of male subjects, and with one minor exception noted above (Gur et al 1998), were not statistically different on age.
(47%) reported nonsignificant findings, and four lacked statistical data. Thus, a vote-count of statistically signifi-cant studies would conclude there was no effect. Twelve studies were based on MRI and three on postmortem measures. Four studies employed area measures and the remaining 11 employed volumetric measures. Special considerations for particular studies are footnoted in Table 2.
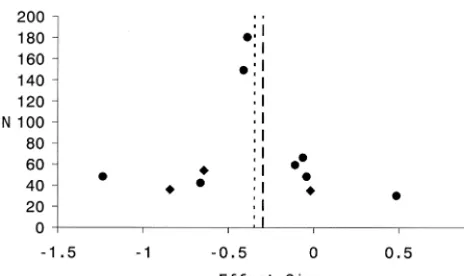
THE COMPOSITE EFFECT SIZE. The composite ef-fect size for all studies in Meta-analysis I was20.29 (95% confidence interval [CI]: 20.42 to 20.16; p , .0001); however, the set of effect sizes in this analysis was heterogeneous (Q 5 30.24, p5.005). Two studies were considered as outliers. One was a volumetric MRI study with a large sample size (Gur et al 1998; n5224) and an effect size near zero (0.01). The other was a volumetric postmortem study with a small sample size (Rosenthal and Bigelow 1972; n 5 20) and a large positive effect size (0.75). These outliers were removed to obtain homogene-ity (Q5 18.50, p5 .10). After removing these outliers, the composite effect size for the remaining 13 studies was 20.41 (95% CI:20.56 to20.26, p,.0001), a moderate effect size based on Cohen’s nomenclature (Cohen 1988) The funnel plot for this analysis is presented as Figure 1. The funnel plot reveals marked variability in effect size across studies. Such variability is consistent with the small sample sizes (total N) in most of these studies. There is no
clear evidence for publication bias, as studies with small N’s were published with quite small positive and negative effect sizes. The fail-safe N for this study, based on 13 studies after the removal of outliers, was 67.
COMPOSITE EFFECT SIZES FOR MRI VOLUMETRIC
STUDIES. As suggested above, there is a general consen-sus that MRI volumetric studies provide the best estimates of thalamic size. An analysis was conducted that included only such studies (see also Figure 1). The composite effect size for the eight volumetric MRI studies in this analysis was20.22 (95% CI:20.37 to20.07; p5.0043). This set of effect sizes was heterogeneous (Q514.62, p5.041). One study (Staal et al 1998) was removed to obtain homogeneity (Q5 7.96, p5 .24). After removal of the outlier, the composite effect size was 20.18 (95% CI: 20.33 to20.02; p5.024). When this set of “best” studies (n58) is meta-analytically compared to all other studies (postmortem area, postmortem volumetric, MRI area, n5 7) there was a statistical trend for the “best” studies to have a smaller effect size (p 5 .09, two-tailed). (The composite effect size for all MRI studies, regardless of geometry [area or volume] was20.28, p ,.0001.)
MODERATORS OF EFFECT SIZE. Moderators Not Formally Analyzed The following coded variables did not contain sufficient variability to support formal statis-tical analysis: method (n 5 15 studies, with only three Table 1. List of Studies in Meta-Analysis I—Absolute Thalamic Size
Authors
Schizophrenic patients Control subjects
n
% Male subjects
Mean age
(years) n
% Male subjects
Mean age (years)
Andreasen et al 1990a 54 66.67 33.43 47 59.57 34.43
Arciniegas et al 1999a 21 47.62 37.15 27 55.56 34.63
Buchsbaum et al 1996 20 95.00 30.20 15 80.00 27.50
Dasari et al 1999 20 75.00 14.74 16 56.25 15.59
Flaum et al 1995a 96 68.75 31.80 84 51.19 30.48
Frazier et al 1996 21 61.90 14.60 33 66.67 14.60
Gur et al 1998b 96 52.08 30.46 128 46.88 27.60
Jernigan et al 1991 42 66.67 30.00 24 79.17 32.20
Hazlett et al 1999 27 74.07 38.30 32 78.13 41.80
Lawrie et al 1999 20 75.00 20.70 30 50.00 21.10
Lesch and Bogerts 1984 15 26.67 41.66 11 72.73 46.83
Pakkenberg and Gundersen 1989 12 66.67 63.00 12 50.00 62.00
Portas et al 1998 15 100.00 37.60 15 100.00 c
Rosthenal and Bigelow 1972 10 40.00 56.00 10 50.00 50.00
Staal et al 1998d 16 75.00 42.00 16 75.00 c
N5485 65% Mean534.78 N5500 59% Mean533.75 aWeighted mean age for male and female subjects.
bPreviously treated and neuroleptic-naive patient groups were combined as a weighted mean. cData not available.
dSubject information is based on a “matched” (according to the authors) comparison of 16 control subjects and 16
based on postmortem measures); reliability (n515; only three lacked reliability data); control type (n515 studies; only three were based on a medical sample); hemisphere (n 5 15 studies; 13 were based on measures of the total thalamus, one was based on the left hemisphere, and one was based on the right hemisphere).
Moderators Formally Analyzed but Not Statistically Significant None of the coded variables were significant predictors of effect size. The following coded variables were tested, but were not significant: geometry (n5 15; volumetric: 11 studies; area: 4 studies; p 5 .12); plane (n 5 12; coronal: 6 studies; axial: 6 studies; p 5 .21); medication (n510; medicated patient sample: 6 studies; partially medicated sample: 4 studies; p5.11); study year (n515, p5.10); percent male (n515, p5.72); mean age (n515, p5 .71).
Meta-Analysis II: Relative Thalamic Size
DESCRIPTION OF THE STUDIES. Table 3 provides a list of the 11 studies included in Meta-analysis II. Data from 313 schizophrenic patients and 434 control subjects contributed to the meta-analysis, with an average patient sample size of 28.5 subjects and an average control group
size of 39.5 subjects per study. All studies were published between 1991 and 1999. Male subjects comprised 71% of the patient samples and 59% of the control samples. The average age of schizophrenia subjects was 33.15 years compared to 31.73 years in control subjects. The groups
Figure 1. Funnel plot for Meta-analysis I, relating effect size to total sample size. Each solid dot represents the position of a single magnetic resonance imaging (MRI) volumetric study. Each diamond represents the position of a single study that employed either area and/or postmortem measures. The dotted line reflects the composite effect size before the removal of outliers. The dashed line reflects the composite effect size after the removal of outliers.
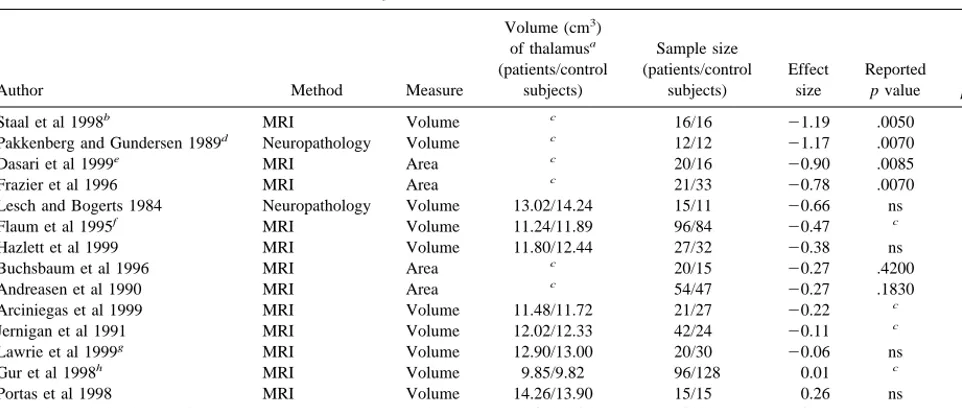
Table 2. Methods and Effect Sizes for Meta-Analysis I—Absolute Thalamic Size
Author Method Measure
Volume (cm3)
of thalamusa (patients/control
subjects)
Sample size (patients/control
subjects)
Effect size
Reported
p value
Our
p value
Staal et al 1998b MRI Volume c 16/16 21.19 .0050 .0015
Pakkenberg and Gundersen 1989d Neuropathology Volume c 12/12 21.17 .0070 .0079
Dasari et al 1999e MRI Area c 20/16 20.90 .0085 .0101
Frazier et al 1996 MRI Area c 21/33 20.78 .0070 .0059
Lesch and Bogerts 1984 Neuropathology Volume 13.02/14.24 15/11 20.66 ns .0987
Flaum et al 1995f MRI Volume 11.24/11.89 96/84 20.47 c .0019
Hazlett et al 1999 MRI Volume 11.80/12.44 27/32 20.38 ns .1510
Buchsbaum et al 1996 MRI Area c 20/15 20.27 .4200 .4277
Andreasen et al 1990 MRI Area c 54/47 20.27 .1830 .1844
Arciniegas et al 1999 MRI Volume 11.48/11.72 21/27 20.22 c .4480
Jernigan et al 1991 MRI Volume 12.02/12.33 42/24 20.11 c .6539
Lawrie et al 1999g MRI Volume 12.90/13.00 20/30 20.06 ns .8440
Gur et al 1998h MRI Volume 9.85/9.82 96/128 0.01 c .9237
Portas et al 1998 MRI Volume 14.26/13.90 15/15 0.26 ns .4788
Rosenthal and Bigelow 1972 Neuropathology Volume 12.02/10.82 10/10 0.75 ns .1024
MRI, magnetic resonance imaging.
aThese are based on our calculations of total thalamic size in cm3. In some cases, thalamic size was based on weighted means of males and females.
bEffect size information is based on a “matched” (according to the authors) comparison of 16 control subjects and 16 schizophrenic patients. cData not available.
dData were reported on mediodorsal thalamic nuclei only.
eAdditional information was provided by the authors for calculation of an effect size.
fTo compute an effect size unconfounded by gender, a separate effect size was calculated for male (20.54) and female (20.41) subjects. These effect sizes were then
averaged for an overall effect size.
gData were reported separately on the left and right thalamic regions; these data were analyzed separately to provide an effect size for each region, and then averaged
to produce an overall absolute effect size.
did not differ significantly in the proportion of male subjects and were not statistically different on age.
Effect sizes and related data extracted from each study for this meta-analysis are presented in Table 4. Ten of the 11 studies (91%) had negative effect sizes, which are consistent with the hypothesis that thalamic size is smaller among schizophrenic subjects versus normal control sub-jects. Statistical probabilities were reported in nine of the studies. Of these, four (36%) were statistically significant in support of the hypothesis and five (45%) were reported as nonsignificant. Once again, a vote-count of statistically significant studies would conclude that there was no
effect. All were based on MRI measures. Three (27%) studies employed area measures and the remaining eight used volumetric measures. Special considerations for par-ticular studies are footnoted in Table 4.
THE COMPOSITE EFFECT SIZE. The composite ef-fect size for all 11 studies included in this analysis was 20.35 (95% CI:20.51 to 20.20; p , .0001); however, this set of effect sizes was heterogeneous (Q520.45, p5 .025). One MRI volumetric study (Staal et al 1998) with a very large negative effect size (21.23) was removed before obtaining homogeneity (Q 5 12.94, p 5 .165). Table 3. List of Studies in Meta-Analysis II—Relative Thalamic Size
Author
Schizophrenic patients Control subjects
n
% Male subjects
Mean age
(years) n
% Male subjects
Mean age (years)
Arciniegas et al 1999 21 47.62 37.15 27 55.56 34.63
Buchsbaum et al 1996 20 95.00 30.20 15 80.00 27.50
Corey-Bloom et al 1995a 14 71.43 59.40 28 46.43 61.20
Dasari et al 1999 20 75.00 14.74 16 56.25 15.59
Flaum et al 1995b 96 68.75 31.80 84 51.19 30.48
Frazier et al 1996 21 61.90 14.60 33 66.67 14.60
Gur et al 1998c 21 61.90 28.90 128 46.88 27.60
Jernigan et al 1991 42 66.67 30.00 24 79.17 32.20
Hazlett et al 1999 27 74.07 38.30 32 78.13 41.80
Portas et al 1998 15 100.00 37.60 15 100.00 d
Staal et al 1998e 16 75.00 42.00 32 75.00 d
n5313 71% Mean533.15 n5434 59% Mean531.73 aData based on early-onset (onset before 45 years of age) group only.
bWeighted mean age for males and females in control group. cEffect size calculated on neuroleptic-naive patient group only. dData not available.
eAccording to Staal et al (1998) the subjects were “matched” for age, but mean age for the patient sample was not specifically
reported. We took the sum (42.0) of the mean age of onset (20.1) and the mean illness duration (21.9) to represent the mean age of patients in that study.
Table 4. Methods and Effect Sizes for Meta-Analysis II—Relative Thalamic Size
Author Method Measure Covariate
Sample size (patients/control
subjects) Effect size
Reported
p value
Our
p value
Staal et al 1998 MRI Volume Total brain volume 16/32 21.23 .0010 .0001
Dasari et al 1999a MRI Area Intracranial volume 20/16
20.84 .0139 .0157
Corey-Bloom et al 1995b MRI Volume Cranium size 14/28
20.66 c .0366
Frazier et al 1996 MRI Area Cerebral volume 21/33 20.64 .0200 .0215
Gur et al 1998d MRI Volume Cranial volume 21/128
20.41 .0800 .0130
Flaum et al 1995 MRI Volume Cranial volume 96/84 20.39 ,.01 .0098
Hazlett et al 1999 MRI Volume Brain volume 27/32 20.11 ns .6821
Jernigan et al 1991 MRI Volume Intracranial volume 42/24 20.06 ns .8005
Arciniegas et al 1999 MRI Volume Total brain volume 21/27 20.04 .9000 .8884
Buchsbaum et al 1996e MRI Area Whole brain slice area 20/15
20.02 c .9593
Portas et al 1998 MRI Volume Intracranial volume 15/15 0.49 ns .1887
MRI, magnetic resonance imaging.
aAdditional information was provided by the authors for calculation of an effect size. bData based on early-onset (onset before 45 years of age) group only.
cData not available.
dRelative effect size reflects only neuroleptic-naive patients.
eRelative data were reported on anterior, middle, and posterior regions of the left and right thalamus; these data were analyzed separately to provide an effect size for
After this outlier was removed, the composite effect size for the remaining studies was 20.30, demonstrating a small to moderate effect. The composite effect size was significant (95% CI: 20.46 to 20.14; p , .0001). The fail-safe N, based on ten studies after the removal of the outlier study, was 40. The funnel plot for this analysis is presented as Figure 2. Once again, variability in effect size across studies, probably due to sampling variation from studies with small samples, is noted.
COMPOSITE EFFECT SIZES FOR VOLUMETRIC AND
MRI STUDIES. A separate analysis was conducted on the volumetric MRI studies, excluding the three area studies in Meta-analysis II (see also Figure 2). The composite effect size in this analysis was20.32 (95% CI:20.49 to20.15; p,.0001), demonstrating a small to moderate effect size. This set of effect sizes was heterogeneous (Q 5 16.37, p 5 .022). One outlier study (Staal et al 1998) was removed to obtain homogeneity (Q58.13, p5.229). The composite effect size for the remaining seven studies was 20.25 (95% CI:20.43 to20.07; p5.003). Because all of the studies in this meta-analysis were based on MRI and only three employed thalamic area, a formal statistical comparison between the “best” studies and the others was not conducted; however, an examination of Figure 2 does suggest that the MRI area studies were not distinct from the MRI volumetric studies.
MODERATORS OF EFFECT SIZE. Moderators Not Formally Analyzed The following coded variables did not contain a sufficient amount of variability to be con-sidered for analysis: method (n511 studies, all based on
MRI measures); geometry (n 5 11, with only three employing area measurements); plane (n511, with only one study employing midsagittal measures and three employing coronal measures); reliability (n 5 11, all of which included interrater reliability data); medication (n5 11, two of which did not include a medicated patient sample, and three of which were based on a mixed sample); control type (n 5 11, all of which included normal volunteers as a control group); hemisphere (n5 11, all of which were based on measures of total thalamus).
Moderators Formally Analyzed but Not Statistically Significant None of the potential modifiers of effect size were statistically significant. The following variables were tested but were not significant as predictors of effect size: study year (n511, p5.64); percent male (n511, p5 .14), mean age (n511, p5.78); and covariate type (n5 5 brain and n56 intracranial, p5 .82).
Discussion
The main findings of the present meta-analytic review are that patients with schizophrenia do indeed have smaller absolute thalamic size and smaller relative (to brain size) thalamic size than control subjects. The effect sizes for thalamic size reductions in schizophrenia were small to moderate in magnitude (absolute size:20.29 before out-lier removal, 20.41 after outlier removal; relative size: 20.35 before outlier removal,20.30 after outlier remov-al). Although the effect sizes are not large, the results of this study provide evidence that patients with schizophre-nia have a statistically significant reduction in thalamic size compared to normal control subjects. Nonetheless, this conclusion should be tempered by the evidence of marked variability in effect size across studies. This variability probably arises from sampling variation due to small sample sizes in most studies. Although we intended to evaluate several moderators of effect size, in the final analysis, there was either insufficient variability or insuf-ficient statistical power to evaluate the influence of most of the proposed moderators; however, there were no statistically significant relationships between age or gen-der and effect size in either meta-analysis.
The study by Gur et al (1998) deserves special com-ment, because it is such a large study (n5224), because its results are somewhat inconsistent with the results of the present review, and because it employed a distinctive design. The study consisted of 3 groups, comparison subjects (n5 128), neuroleptic-naive patients (n 5 21), and previously treated patients (n575). We were not able to include the large group of previously treated patients (n 5 75) in Meta-analysis II, owing to insufficient Figure 2. Funnel plot for Meta-analysis II, relating effect size to
information. Had we been able to, it is likely that the composite effect sizes for Meta-analysis II would be reduced somewhat but would probably still be statistically significant with a very low p value. Second, the paper seems to suggest that thalamic volume may be increased by medication, because the largest thalamic volumes noted were in the previously treated group (larger than compar-ison subjects), and because thalamic volume was posi-tively and statistically significantly correlated with neuro-leptic dose. We are not aware of any other data suggesting an increase in thalamic volume as an effect of antipsy-chotic medications, although such effects have been noted for other subcortical structures (Chakos et al 1994). Most of the studies in the present meta-analyses were based on medicated patients and, overall, the thalamic volumes in these patients were reduced, not enlarged. Two other points about this study are of interest. As noted above, it was the only study to be included in the final meta-analysis in which there was a statistically significant, albeit minor, difference in age between the patients and control subjects (patients slightly older). Furthermore, the thalamic volumes in the Gur et al (1998) study were unusually small (Table 2). The mean thalamic volume of all other studies was 12.4, but the thalamic volume reported by Gur et al (1998) was 9.8 and was more than 2.5 SD’s below the mean of the other studies. These points may offer some clue as to why the results are so distinct, but we are unable to carry the search further.
There was some evidence that the “best” studies, i.e., those based on MRI volumetric assessments, produced smaller effects than other studies when considering only absolute thalamic size. The contrast between the “best” studies and the other studies approached statistical signif-icance (p5.09). Nonetheless, the composite effect size of
these MRI volumetric studies was statistically significant and negative (20.18, p , .05). There was no evidence supporting an important difference between the “best” studies and the other studies for relative thalamic size.2
In our view, the data on absolute thalamic size is less interesting than the data on relative thalamic size for the following reason: It is known that patients with schizo-phrenia have small brains (Ward et al 1996; effect size with outliers removed was 20.31). It is likely that tha-lamic size is highly correlated with brain size. [Indeed, two of the papers reviewed herein provide the F test for the brain volume covariate—Dasari et al (1999), F(1,47) 5 28.9, p 5 .0001; Flaum et al (1995), F(1,183)551.2, p,.0001.] If thalamic size is correlated with brain size, and if brain size is reduced in schizophre-nia, then, given a large enough sample and sufficiently small measurement error, one would expect to find re-duced absolute thalamic size in this disorder.
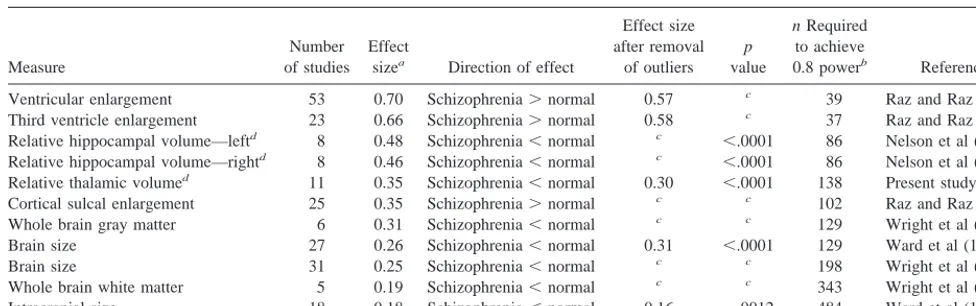
The reduction in relative thalamic size cannot be ex-plained as simply a manifestation of reduced brain size (or reduced intracranial size). The evidence suggests that the thalamus occupies a smaller proportion of total brain in patients with schizophrenia than in control subjects; how-ever, the effect size for this effect was moderate to small (0.35 or 0.30). It is useful to compare this meta-analytic finding with other meta-analytically determined effect sizes for brain structural abnormalities in schizophrenia (Table 5). The effect size for relative thalamic size reduction is smaller than the effect sizes for ventricular size enlargement and slightly smaller than the effect sizes for hippocampal size
2A reviewer suggests that the failure of the “best” or volumetric studies to have
decreased effect size may relate to definitional problems in tracing ventral thalamic borders and that thick slice “area” studies might avoid this. Table 5. List of Meta-Analytically Determined Effect Sizes of Structural Brain Measures in Schizophrenia
Measure
Number of studies
Effect
sizea Direction of effect
Effect size after removal
of outliers
p
value
n Required
to achieve
0.8 powerb Reference
Ventricular enlargement 53 0.70 Schizophrenia.normal 0.57 c 39 Raz and Raz (1991)
Third ventricle enlargement 23 0.66 Schizophrenia.normal 0.58 c 37 Raz and Raz (1991)
Relative hippocampal volume—leftd 8 0.48 Schizophrenia,normal c ,.0001 86 Nelson et al (1998)
Relative hippocampal volume—rightd 8 0.46 Schizophrenia,normal c ,.0001 86 Nelson et al (1998)
Relative thalamic volumed 11 0.35 Schizophrenia,normal 0.30 ,.0001 138 Present study
Cortical sulcal enlargement 25 0.35 Schizophrenia.normal c c 102 Raz and Raz (1991)
Whole brain gray matter 6 0.31 Schizophrenia,normal c c 129 Wright et al (2000)
Brain size 27 0.26 Schizophrenia,normal 0.31 ,.0001 129 Ward et al (1996)
Brain size 31 0.25 Schizophrenia,normal c c 198 Wright et al (2000)
Whole brain white matter 5 0.19 Schizophrenia,normal c c 343 Wright et al (2000)
Intracranial size 18 0.18 Schizophrenia,normal 0.16 .0012 484 Ward et al (1996)
aThese effect sizes are all adjusted for sample size according to Hedges and Olkin (1985). Also, effect sizes are sorted from largest to smallest, based on the effect size
before removal of outliers when applicable.
bPower calculation is based on the effect size after removal of outliers, when applicable, and assumes alpha50.05 (1-tailed). Also, n is n per group. This is the required
sample size for a single new study to have a 0.8 power.
cData not available.
reduction; however, the effect size for relative thalamic size reduction is comparable to the effect size for cortical sulcal enlargement and is larger than the effect size for brain or intracranial size reduction in schizophrenia.
Is this relative ranking of effect size an index of “importance”? As a general matter, we believe that effect size is one of several possible indicators of importance. It is worth noting that effect size will be influenced by the reliability of measurement; to the extent that brain mea-sures or diagnoses are unreliable, an effect size will be underestimated (O’Grady 1982). In the present case, it seems reasonable to conjecture that measures of small structures (e.g., hippocampus) are probably less reliable than measures of large structures (brain volume, intracra-nial volume) and thus the true effect size in the case of small structures may be underestimated. Also, the theoret-ical importance of an effect may have more to do with its existence, and/or its specificity to schizophrenia, than with its magnitude (Richardson 1996).
If relative hippocampal size is small and relative tha-lamic size is small, presumably some other structure (or structures) of the brain is (are) relatively large in schizo-phrenic patients. It is known that the ventricles and sulcal fluid spaces are larger in these patients. Further, the thalamus is adjacent to the ventricles. Therefore, a smaller thalamus is consistent with larger ventricles. Indeed, Portas et al (1998) reported large, and statistically significant, inverse correla-tions between thalamic size and ventricular size on the left (r5 2.65, p5.01) and right (r5 2.61, p5.05) in patients with schizophrenia. Of course, correlation does not prove causation, but it does raise the possibility that the decrease in thalamic size in schizophrenia is secondary to an increase in ventricular size, or vice versa.
In the meta-analysis discussed here, only reports that utilized conventional measures (area and volume) of thalamic size were included. Some new studies, based on completely different forms of analysis, could not be included, because they do not provide data in the same form. Nonetheless, such studies are relevant to the ques-tion of thalamic size and/or shape in schizophrenia. For example, Andreasen et al (1994) employed a “bounding-box” registration procedure to create effect-size maps of regional differences between patients with schizophrenia and control subjects. These authors reported that the thalamic size was reduced in schizophrenics; however, Wolkin et al (1998) did not find thalamic abnormalities with a similar approach with several more registration landmarks and scaling factors. Gaser et al (1999) used a nonlinear deformation approach and did find evidence for bilateral thalamic volume reductions. Hazlett et al (1999) reported shape differences in the thalamus of patients with schizophrenia, i.e., patients had fewer pixels in the left anterior region of the thalamus.
Of course, the relative size or overall shape of a large and complex brain structure is a very crude measure and may have little implication for the function of the thalamus in a disorder like schizophrenia. Other neuroanatomic approaches have provided more specific data on reduced neuronal and glial cell number or density of various thalamic nuclei (Pakkenberg 1990, 1992). (For a compre-hensive review of this topic, see Heckers 1997.) Blennow et al (1996) reported a remarkable 50% reduction in synaptic density in the left thalamus of patients with schizophrenia. A further analysis by this group empha-sized a potential reduction in synaptic terminals or pre-synaptic vesicles (Landen et al 1999; see also Davidsson et al 1999). Functional studies of the thalamus based on positron emission tomography (PET) and magnetic reso-nance spectroscopy (MRS) have produced mixed results (Heimberg et al 1998; see Hazlett et al 1999 for PET data and a brief review).
There are a number of interesting studies reporting statistically significant reductions in thalamic volume among asymptomatic first- and second-degree relatives of schizophrenia patients compared to control subjects (Law-rie et al 1999; Seidman et al 1997, 1999; Staal et al 1998). These findings suggest that the genetic liability to schizo-phrenia is expressed, in part, as a reduction in thalamic volume.
Although studies of late-onset cases (onset after 45 years of age) were not included in the formal meta-analyses, it is perhaps worth noting in passing that two studies that included such patients did not find evidence of reduced thalamic size (Corey-Bloom et al 1995; Howard et al 1995). Interestingly, Corey-Bloom et al (1995) found significantly larger thalamic volumes in late-onset schizo-phrenic patients compared to early-onset patients. These findings suggest that those who present with late-onset schizophrenia do not possess the same thalamic abnormal-ities as those who develop schizophrenia at a younger, more typical, age.
In summary, there is convincing evidence for a reduc-tion in thalamic size in schizophrenia; however, the effect sizes were quite variable across studies, probably reflect-ing samplreflect-ing variation from studies with small samples. The effect size, although highly statistically significant, is modest in comparison to other structural abnormalities noted in schizophrenia. Of course, the overall volume of a brain structure with the size and complexity of the thala-mus may be a very crude index of the health or normality of that structure.
References
Andreasen NC (1997): The role of the thalamus in schizophrenia.
Andreasen NC, Arndt S, Swayze V, Cizadlo T, Flaum M, O’Leary D, et al (1994): Thalamic abnormalities in schizo-phrenia visualized through magnetic resonance image aver-aging. Science 266:294 –298.
Andreasen NC, Ehrhardt JC, Swayze VW, Alliger RJ, Yuh WT, Cohen G, et al (1990): Magnetic resonance imaging the brain in schizophrenia: Pathophysiologic significance of structural abnormalities. Arch Gen Psychiatry 47:35– 44.
Arciniegas D, Rojas DC, Teale P, Sheeder J, Sandberg E, Reite M (1999): The thalamus and the schizophrenic phenotype: Failure to replicate reduced volume. Biol Psychiatry 45: 1329 –1335.
Blennow K, Davidsson P, Gottfries C-G, Ekman R, Heilig M (1996): Synaptic degeneration in thalamus in schizophrenia.
Lancet 348:692– 693.
Buchsbaum MS, Someya T, Teng CY, Abel L, Chin S, Najafi A, et al (1996): PET and MRI of the thalamus in never-medicated patients with schizophrenia. Am J Psychiatry 153:191–199.
Chakos MH, Lieberman JA, Bilder RM, Borenstein M, Lerner G, Bogerts B, et al (1994): Increase in caudate nuclei volumes of first-episode schizophrenic patients taking antipsychotic drugs. Am J Psychiatry 151:1430 –1436.
Cohen J (1988): Statistical Power Analysis for the Behavioral
Sciences, 2nd ed. Hillsdale, NJ: Erlbaum.
Corey-Bloom J, Jernigan T, Archibald S, Harris MJ, Jeste DV (1995): Quantitative magnetic resonance imaging of the brain in late-life schizophrenia. Am J Psychiatry 152:447– 449. Dasari M, Friedman L, Jesberger J, Stuve TA, Findling RL,
Swales TP, et al (1999): A magnetic resonance imaging study of thalamic area in adolescent patients with either schizophre-nia or bipolar disorder as compared to healthy control subjects. Psychiatry Res 91:155–162.
Davidsson P, Gottfries J, Bogdanovic N, Ekman R, Karlsson I, Gottfries CG, et al (1999): The synaptic-vesicle-specific proteins rab3a and synaptophysin are reduced in thalamus and related cortical brain regions in schizophrenic brains.
Schizo-phr Res 40:23–29.
Elkis H, Friedman L, Wise A, Meltzer HY (1995): Meta-analyses of studies of ventricular enlargement and cortical sulcal prominence in mood disorders. Arch Gen Psychiatry 54:735– 746.
Flaum M, Swayze VW, O’Leary DS, Yuh WT, Ehrhardt JC, Arndt SV, et al (1995): Effects of diagnosis, laterality, and gender on brain morphology in schizophrenia. Am J
Psychi-atry 152:704 –713.
Frazier JA, Giedd JN, Hamburger SD, Albus KE, Kaysen D, Vaituzis AC, et al (1996): Brain anatomic magnetic resonance imaging in childhood-onset schizophrenia. Arch Gen
Psychi-atry 53:617– 624.
Friedman L, Lys C, Schulz SC (1992): The relationship of brain imaging parameters to antipsychotic treatment response: A review. J Psychiatry Neurosci 17:42–54.
Gaser C, Volz H, Kiebel S, Riehemann S, Sauer H (1999): Detecting structural changes in whole brain based on nonlin-ear deformations—application to schizophrenia resnonlin-earch.
Neuroimage 10:107–113.
Gur RW, Maany V, Mozley D, Swanson C, Bilker W, Gur RC (1998): Subcortical MRI volumes in neuroleptic-naive and
treated patients with schizophrenia. Am J Psychiatry 155: 1711–1717.
Hazlett EA, Buchsbaum MS, Byne W, Wei T, Spiegel-Cohen J, Geneve C, et al (1999): Three-dimensional analysis with MRI and PET of the size, shape, and function of the thalamus in the schizophrenia spectrum. Am J Psychiatry 156:1190 – 1199.
Heckers S (1997): Neuropathology of schizophrenia: Cortex, thalamus, basal ganglia, and neurotransmitter-specific projec-tion systems. Schizophr Bull 23:403– 421.
Hedges LV (1994): Fixed effects models. In: Cooper H, Hedges LV, editors. The Handbook of Research Synthesis. New York: Russell Sage Foundation, 285–299.
Hedges LV, Olkin I (1985): Statistical Methods for
Meta-Analysis. Orlando: Academic Press.
Heimberg C, Komoroski RA, Lawson WB, Cardwell D, Karson CN (1998): Regional proton magnetic resonance spectros-copy in schizophrenia and exploration of drug effect.
Psychi-atry Res 83:105–115.
Hoge EA, Friedman L, Schulz SC (1999): Meta-analyses of brain size in bipolar disorder. Schizophr Res 37:177–181. Howard R, Mellers J, Petty R, Bonner D, Menon R, Almeida O,
et al (1995): Magnetic resonance imaging volumetric mea-surements of the superior temporal gyrus, hippocampus, parahippocampal gyrus, frontal and temporal lobes in late paraphrenia. Psychol Med 25:495–503.
Jernigan TL, Zisook S, Heaton RK, Moranville JT, Hesselink JR, Braff DL (1991): Magnetic resonance imaging abnormalities in lenticular nuclei and cerebral cortex in schizophrenia. Arch
Gen Psychiatry 48:881– 890.
Johnson BT (1989): DSTAT: Software for the Meta-Analytic
Review of Research Literature. Hillsdale, NJ: Erlbaum.
Jones EG (1997): Cortical development and thalamic pathology in schizophrenia. Schizophr Bull 23:483–501.
Landen M, Davidsson P, Gottfries CG, Grenfeldt B, Stridsberg M, Blennow K (1999): Reduction of the small synaptic vesicle protein synaptophysin but not the large dense core chromogranins in the left thalamus of subjects with schizo-phrenia. Biol Psychiatry 46:1698 –1702.
Lawrie SM, Whalley H, Kestelman JN, Abukmeil SS, Byrne M, Hodges A, et al (1999): Magnetic resonance imaging of brain in people at high risk of developing schizophrenia. Lancet 353:30 –33.
Lesch A, Bogerts B (1984): The diencephalon in schizophrenia: Evidence for reduced thickness of the periventricular grey matter. Eur Arch Psychiatr Neurol Sci 234:212–219. Light RJ, Pillemer DB (1984): Summing Up: The Science of
Reviewing Research. Cambridge, MA: Harvard University
Press.
Nelson MD, Saykin AJ, Flashman LA, Riordan HJ (1998): Hippocampal volume reduction in schizophrenia as assessed by magnetic resonance imaging: A meta-analytic study. Arch
Gen Psychiatry 55:433– 440.
O’Grady KE (1982): Measures of explained variance. Psychol
Bull 92:766 –777.
Orwin RG (1983): A fail-safe N for effect size. J Educ Stat 8:157–159.
number in mediodorsal thalamic nucleus and nucleus accum-bens in schizophrenics. Arch Gen Psychiatry 47:1023–1028. Pakkenberg B (1992): The volume of the mediodorsal thalamic nucleus in treated and untreated schizophrenics. Schizophr
Res 7:95–100.
Pakkenberg B (1993): Leucotomized schizophrenics lose neu-rons in the mediodorsal thalamic nucleus. Neuropathol Appl
Neurobiol 19:373–380.
Pakkenberg B, Gundersen HJ (1989): New stereological method for obtaining unbiased and efficient estimates of total nerve cell number in human brain areas exemplified by the me-diodorsal thalamic nucleus in schizophrenics. APMIS 97: 677– 681.
Portas CM, Goldstein JM, Shenton ME, Hokama HH, Wible CG, Fischer I, et al (1998): Volumetric evaluation of the thalamus in schizophrenic male patients using magnetic resonance imaging. Biol Psychiatry 43:649 – 659.
Raudenbush SW (1994): Random effects models. In: Cooper H, Hedges LV, editors. The Handbook of Research Synthesis. New York: Russell Sage Foundation, 301–321.
Raz S, Raz N (1991): Structural brain abnormalities in the major psychoses: A quantitative review of the evidence from com-puterized imaging. Psychol Bull 108:93–108.
Richardson JTE (1996): Measures of effect size. Behav Res
Methods Instrum Comput 28:12–22.
Rosenthal R (1979): The “file drawer problem” and tolerance for null results. Psychol Bull 86:638 – 641.
Rosenthal R, Bigelow LB (1972): Quantitative brain measure-ments in chronic schizophrenia. Am J Psychiatry 121:259 – 264.
Seidman LJ, Faraone SV, Goldstein JM, Goodman JM, Kremen WS, Matsuda G, et al (1997): Reduced subcortical brain volumes in nonpsychotic siblings of schizophrenic patients: A pilot magnetic resonance imaging study. Am J Med Genet 74:507–514.
Seidman LJ, Faraone SV, Goldstein JM, Goodman JM, Kremen WS, Toomey R, et al (1999): Thalamic and amygdala-hippocampal volume reductions in first-degree relatives of patients with schizophrenia: An MRI-based morphometric analysis. Biol Psychiatry 46:941–954.
Staal WG, Hulschoff Pol HE, Schnack H, van der Schot AC, Kahn RS (1998): Partial volume decrease of the thalamus in relatives of patients with schizophrenia. Am J Psychiatry 155:1784 –1786.
Van Horn JD, McManus IC (1992): Ventricular enlargement in schizophrenia: A meta-analysis of studies of the ventricle: brain ratio (vbr). Br J Psychiatry 160:687– 697.
Ward KE, Friedman L, Wise A, Schulz SC (1996): Meta-analysis of brain and cranial size in schizophrenia. Schizophr Res 22:197–213.
Weinberger DR (1997): On localizing schizophrenic neuropa-thology. Schizophr Bull 23:537–540.
Wolkin A, Rusinek H, Vaid G, Arena L, Lafargue T, Sanfilipo M, et al (1998): Structural magnetic resonance image aver-aging in schizophrenia. Am J Psychiatry 155:1064 –1073. Woodruff PWR, McManus IC, David AS (1995): Meta-analysis
of corpus callosum in schizophrenia. J Neurol Neurosurg
Psychiatry 58:457– 461.