V E R I F I C A T I O N O F T H E S E NT I NE L -4 F O C A L PL A NE S UB S Y ST E M
A irbus D efense and S pace, 85521 Ottobrunn, Germany - ruediger.hohn@ airbus.com
c
D epartment of C omputer S cience, Humboldt-Universität zu B erlin, Germany - reulke@ informatik.hu-berlin.de will present in detail the opto-mechanical laboratory set-up of the verification campaign of the S entinel-4 Qualification Model (QM)
which will also be used for the upcoming F light Model ( F M) verification. T he test campaign consists mainly of radiometric tests
performed with an integrating sphere as homogenous light source.
T he F PA s have mainly to be operated at 215 K ± 5 K , making it necessary to exploit a thermal vacuum chamber ( T V C ) for the test
accomplishment. T his publication focuses on the challenge to remotely illuminate both S entinel-4 detectors as well as a reference
detector homogeneously over a distance of approximately 1 m from outside the T V C . F urthermore selected test analyses and results will be presented, showing that the S entinel-4 F PS meets specifications.
* C orresponding author
1. I NT R OD UC T I ON
In this publication we report about the verification campaign of
the S entinel-4 UV -V IS and NIR F PS qualification models, with
focus on the opto-mechanical set-up as well as test results.
C hapter 2 gives a description of the overall system design and
the results of the verification campaign: S ub-chapter 2.1 gives
an overview over the S entinel-4 F PS design, consisting of F PA s and appended electronics. 2.2 deals with the GS E design, the
boundary conditions, opto-mechanical solutions, temperature
control and automatization approach. 2.3 is about data
evaluation and test results. W e discuss the gained results and
give an outlook for the upcoming F M verification in chapter 3,
before we close the publication with acknowledgements and references.
detectors, the detector-close electronics, as well as internal
L E D s for radiometric on-board calibration.
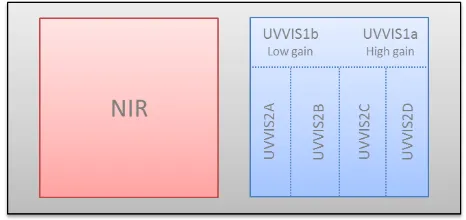
T he UV -V IS detector is a split frame detector: designated areas are read out in separate directions ( compare F igure 1). T his
allows for adaptation of integration time and gain settings,
depending on wavelengths hitting designated areas. T he image
zone of UV -V IS I is designed for wavelength range
305 nm … 343 nm, UV -V IS II for 343 nm … 500 nm.
UV -V IS I has the advantage of two different read out directions, with different fixed gain settings, to adapt for
different irradiation intensities. F or faster read out, UV -V IS II is
separated in four single read out registers with same gain
anti-reflective coating allowing only designated wavelengths to pass.
F igure 1: S entinel-4 detector design of UV -V IS and NIR
detector
T o maintain excellent operating conditions with low noise the
operating temperature of both detectors is 215 K ± 5 K .
T emperature transport from the detectors happens via “cold
fingers” made from S iC and a thermal flex harness to the heat
pipe. C ooling happens via heat pipes and radiators, while for active temperature control heating elements are attached to the
link heat pipe / thermal flex harness.
A part from both detectors, the F PA s have an operating
temperature of approx. 293 K . T o guaranty stable operating
conditions of the detectors, a thermal insulation is implemented
between detectors and F PA (compare F igure 2).
F igure 2: S entinel-4 F PA design
E ach F PA possess an according F E E that converts the analogue
signal into digital signals. T o minimize losses and noise, F PA s
V erification campaign comprises mostly of radiometric tests.
A n overview is provided in T able 1. S everal tests have been
conducted at the very beginning and the end of the verification
campaign to test for stability of the F PS equipment.
R adiometric tests have been performed exploiting a light source with high spatial homogeneity and long term stability. A n
integrating sphere ( IS ) was used for this purpose, 50 cm in
diameter, aperture 20 cm. F or the cross talk test a 635 nm D iode
laser was deployed, the internal L E D s for a remanence test.
T he MT F test has been performed on the E ngineering Model
identical in construction to the QM. S et-up and results will be
presented in an additional publication.
Performed test D eployed light source
L inearity and PR NU IS , S pectral F ilters Quantum E fficiency IS , S pectral F ilters
Photo R esponse T ests IS , S pectral F ilters
T able 1: Overview over performed verification tests
2.2.1 B oundar y C onditions: T he detectors had to be
verified under test-as-you-fly conditions: D epending on the
specific test the temperature had to be adjusted to 210 K , 215 K , 220 K , respectively. T he appended electronic ( F E E s, F S E ) had
to be stabilized at ~293 K . T wo separated tempering circles
have been implemented to control temperature according to
requirement.
A dditionally operation conditions demanded for vacuum
operations to reduce noise and to protect the hygroscopic A R -coating on each detector from degrading caused by humidity.
W e deployed a thermal vacuum chamber (T V C ), able to
generate a pressure < 5*10-6 mbar to meet these requirements. Pressure and temperature in our facility are long term stable
application under ambient atmospheric conditions.
A dditionally, the tight spatial set-up of F PA s and associated
F E E s does not allow for placement at the desired position. T o
overcome these circumstances while simultaneously generating
a homogeneous illumination the integrating sphere was placed outside the T V C in a distance, large enough to deploy an
outcome of the cos4-law: F or a sufficient large distance between light source and detector and for the correct ratio of size
between those two, illumination of an area (e.g. a detector) is
homogeneous ( L abshere 2016). T he IF OV (Instantaneous F ield
Of V iew) for all pixels is regarded to be equal in this special case. A schematic of this idea is shown in F igure 4a, the
adaption to the verification set-up in F igure 4b.
T he graph in F igure 5 shows the theoretical outcome of the
set-up calculated via cos4-law over the diagonal of the UV -V IS detector. Homogeneity of > 99.95 % is theoretically achievable.
T o manipulate wavelength and intensity, two filter wheels have been integrated into the beam path, one with interference filters
the second with neutral density filters (F igure 4b).
T he F PA s with associated electronic boxed will have a certain
non-perpendicular and non-parallel orientation on the satellite
bus. T he flex harnesses linking F PA s to F E E s are tightly
adapted to this orientation, with respect to lengths and shapes. T he required test-as-you-fly configuration demands for
sufficient space in the T V C ; we have been constrained to realize
a large and complicated mount to meet obligations.
F igure 4: a) principle of homogeneous illumination via remote
light source; b) adaption to verification set-up
F igure 5: Intensity distribution on the detector from a remote
source calculated per ^4 - law. S ee F igure 4 for dimensions
D ue to limited space in front of the T V C ’s entrance window, we
decided for a set-up that mounts the F PA s and a reference
detector along and parallel to the optical axis (OA ), with the
detectors facing the OA perpendicularly. T he OA is given by
T V C window with attached filter wheels and integrating sphere.
A folding mirror on a linear manipulator moving along the optical axis was exploited to subsequently transfer light to each
detector. In combination with a spatial off-set of each detector
with respect to the OA this allowed for equal optical path
lengths, guarantying equal illumination. A schematic is shown
in F igure 6.
F or the cross talk test, integrating sphere as well as filter wheels have been removed from set-up and replaced by a laser on a
4-axis manipulator.
2.2.3 T emper atur e contr ol: A s mentioned above,
verification of the whole F PS has been performed under
operating conditions. D epending on test this has been 210 K ,
215 K , and 220 K , respectively, for F PA s and 293 K for F E E s
and F S E . T he temperature was long term stabilized to < ± 50
mK .
T wo independent temperature controlling circuits have been
set-up, one controlling the in series connected F PA s, second
one controlling the in series connected electronics. D ue to the
higher thermal load UV -V IS F PA has been under supply first,
NIR F PA second. F E E s and F S E are also in series for the same
reasons: UV V IS F E E , NIR F E E , F S E ( see F igure 7) .
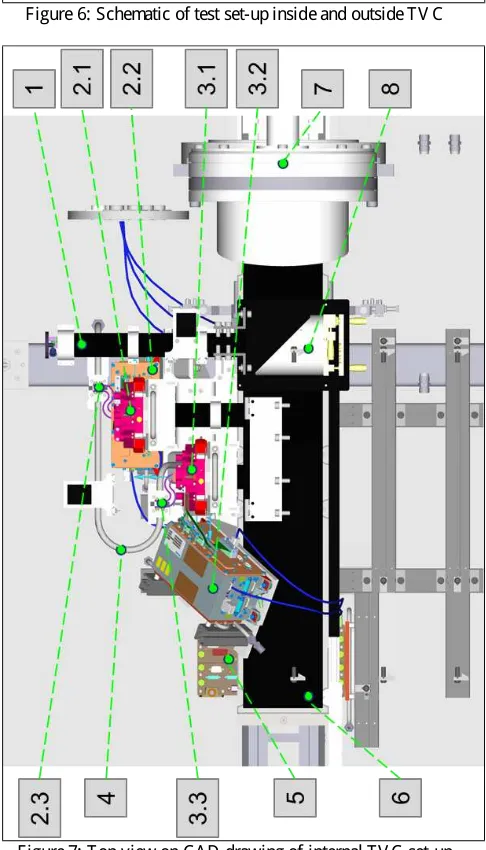
F igure 6: S chematic of test set-up inside and outside T V C
F igure 7: T op view on C A D drawing of internal T V C set-up
A n explanation of labelled parts in F igure 7 is given in T able 2.
L abel L abelled item
1 R eference D etector
2 UV V IS F PA
2.2 UV V IS F E E
2.3 UV V IS temperature control connection
3.1 NIR F PA
3.2 NIR F E E
3.3 NIR temperature control connection
4 F PA temperature circuit
5 F S E
6 L inear manipulator for mirror displacement
7 Optical window of T V C
8 F olding mirror
T able 2: E xplanation of labelled parts from F igure 7
2.2.4 A utomatization of T est C onduction: T he amount of
tests and repetitions demanded for an automatization process to
increase efficiency and reduce possible human failure to a
minimum. T he automatization software A utoIt® was exploited
to control the Matlab® -GUI of the IC U, enabling the automated
control of the S entinel-4-test equipment ( e.g. integration times,
frame numbers, modes, etc.), as well as control of our GS E (mirror position, temperature, etc.) .
2.3 D ata E valuation and R esults
In this chapter test results of the following verification tests will
be presented:
numbers) can be estimated the following equation 1:
( )
T able 3: S ymbols, meaning and units mentioned in equation 1
T he following noise components are expected to occur: photon
noise, dark signal, read noise. A s dark and photon noise are Poisson distributed, read noise follows a Gaussian normal
distribution. E quation 2 describes the relation:
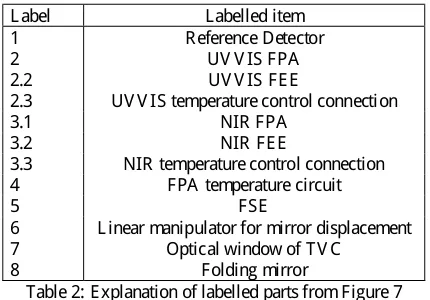
2 2 2 L inearity evaluation has been performed by integration time
variation with fixed irradiance. D ue to a misaligned aperture,
inhomogeneous shading occurred on both F PA detectors, p-v
approximately 20 % (compare F igure 8a).
T he shade had to be estimated and corrected prior to
determination of PR NU. S hade correction was performed as
following: A linear relation is expected between S ignal
ˆ
kdependency (pixel dependency) of the E xposer-term.
T he PR NU correction cannot be handled independently from based analysis of the slope has been performed (formula 5) :
(
)
(
(
)
)
linearity, by analyzing the maximum deviation from linearity.F igure 10 shows its spatial dependence: F igure 10a shows the
spatial distribution of pixels with varying deviation from
linearity; F igure 10b shows the non-linearity histogram, where
cross-marks indicate the derived histogram, the dotted line a fit
onto the derived histogram and the solid line mean value and
variance. Obviously, the deviation correlates with the shade; higher signals show a higher deviation (compare F igure 8a with
F igure 10a).
T he signal derivation of < 80 D N compared to the maximum
presentable value of the S entinel-4 detector of 65,536 D N is
< 0.13 %.
F igure 11 shows the slightly curved deviation from linearity for
the reference pixels of the UV V IS detector depicted in F igure
9a. D eviations are relatively small ( F igure 11a), they can easily
be corrected to follow an almost linear behavior (F igure 11b).
F igure 8:Graphical overview over shading, performed shade
correction and PR NU determination. a) inhomogeneous shading
on UV V IS detector. E nhanced false color mapping: blue = low
signal, red = high signal; b) PR NU and shade combined in one signal; c) calculated shading caused by inhomogeneous
illumination; d) corrected signal represents detector PR NU.
F igure 9: L inearity over UV V IS detector. a) map of analyzed
reference pixel of UV V IS detector; b) linearity without shading
correction; c) linearity with shading correction.
F igure 10: a) mapping of pixels with signal deviation from
linearity; b) histogram of number of pixels over signal (deviation) in D N.
F igure 11: a) uncorrected non-linear behavior of pixels; b) corrected non-linearity.
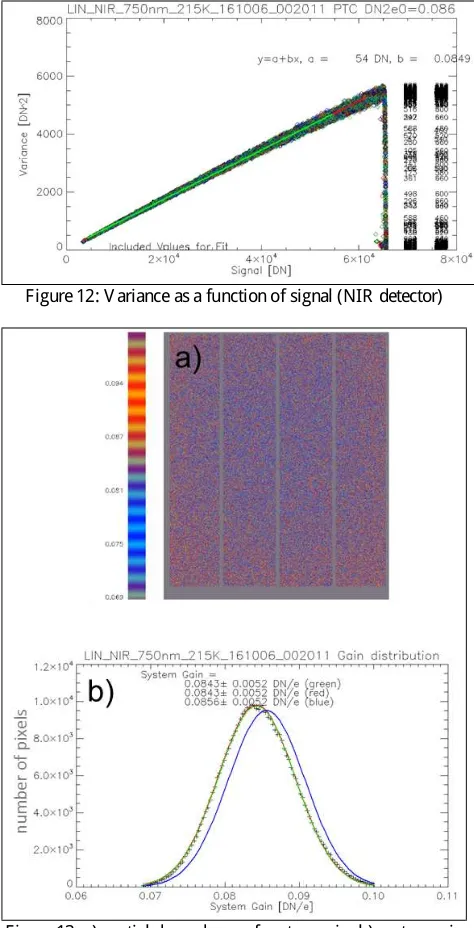
2.3.4 S ystem G ain D etermination: E xploitation of system
gain
SG
h
allows for translation of generated charge to digital numbers ( D N) without knowledge of quantum efficiency,following photon-transfer-method of (J anesick, 2007). T he
method uses the Poisson-distributed characteristics of incoming
radiation and dark current. F igure 12 shows the linear
correlation between mean signal and variance of the NIR
detector. T he relation between charge and D N is .
F igure 13a and F igure 13b depict the spatial dependency, and the histogram for system gain on NIR detector.
F igure 12: V ariance as a function of signal ( NIR detector)
F igure 13: a) spatial dependency of system gain; b) system gain histogram.
2.3.5 R emanence, also known as Residual Bulk Image
(R B I), is the effect of remaining charges on exposed areas of the detector, causing “ghost images” on subsequent frames
(J aniseck, 2001). F or this verification test the F PA -internal
L E D s have been exploited. T he basic test principle is to
intermittently illuminate the detector by named L E D s. T hey are
controlled via external activation mechanism. T he basic
assumption is that the L E D s can switch off sufficiently fast; fading or glowing does not occur or is in the nano-second (ns)
regime.
D uring image recording with fixed exposure times, an
asynchronously pulsed illumination has been triggered
externally. F igure 14 depicts exemplary for one pixel of the NIR
detector the acquired signal over time.
F igure 14: NIR detector output of a sequence of intermittent detector illumination. T he image shows the signal of one pixel
over time
A s can be seen in F igure 14 some of the measurement points are
providing neither “bright” nor “dark” information. T his
indicates that the pixel information has been acquired exactly at that moment where the L E D s for detector illumination have
been switched on or off. Here the focus was set on the falling
flank i.e. the transit where the L E D s have been switched off.
F or the analysis several Pixel have been assessed, located at
different positions on the detector. Once the switch off moment
has been identified on a measurement number n (image n of the series of images) the average pixel data of the 2nd and 3rd
following image have been computed to obtain a dark reference.
Here the assumption is that the 2nd and 3rd image following the
switch off point are not measurably impacted by any remanence
effect.
F rom signal level of the relevant pixel in frame n this average
dark level (of this pixel) has been subtracted to obtain offset corrected information of the “partially illuminated” pixel. In the
same way the pixel value of frame n+1 has been offset
corrected. F inally both offset corrected results are divided in the
manner “partially illuminated” / “first dark”. T he assumption is
that the first dark frame contains any remaining charges in case
of existing remanences of the detector and that the amount of charges is proportional to the “previous partially illuminated”
frame level why the absolute level of the partly illuminated
pixel is mostly irrelevant here.
A s the averaged results over all reference pixel of the detector is
in the order of X *10
-6
(A ttenuation in the order of 100 dB ) , we
conclude that remanence of the detector is negligible.
3. C ONC L US I O N A ND OUT L OO K
T he verification campaign of the S entinel-4 qualification
models of F PA s, F E E s and F S E , has been successfully completed. Our analyzes show that all detectors and appended
electronics are within specification. E .g. measured values of
PR NU are well below allowed upper limit (T able 4).
Measurement R esult /
S pecification
D etector
UV -V IS I UV -V IS II NIR
C alculated standard
deviation ( %)
0.288 0.187 0.18
C alculated amount of
pixel out of 3 σ (in %)
0.035 0.011 0.47
S pecified upper limit
(in %)
4.0
2.0 … 1.0
(depending on
wavelength) 4.0
T able 4: PR NU verification: C omparison of measured data to E S A specification
A lso non-linearity is very low and can be corrected easily;
deviation after correction is < 0.04 %.
C onsidering the obtained results, we are of the opinion that
optimization of any part of the F PA -electronics-system for the
upcoming flight models is not necessary.
A manual data evaluation of the remanence test showed that the
memory effect is smaller than 0.001 %. T his value gives
confidence that the memory values are well within specification.
D uring verification campaign, an anomaly occurred: the spatial
distribution on F PA s should have been homogeneous; instead it showed a shade of p-v ~20 % (compare figure 43a). A
misaligned aperture in the beam path has been identified as the
root cause of the shading. F or the F M verification, any such
misalignment will be avoided by adaption of the
opto-mechanical set-up.
A C K NO W L E D G E M E NT S
T he presented work has been performed under E S A contract. T he authors would like to express their thanks to their
respective colleagues at A irbus D efense and S pace, E S A and
E UME T S A T , and to all partner companies within the
S E NT INE L 4 industrial consortium for their valuable
contributions to the continuing success of this very challenging
program. T his article has been produced with financial assistance of the E U. T he views expressed herein shall not be
taken to reflect the official opinion of the E U.
R E F E R E NC E S
D ucharme, A ., D aniels, A ., Grann, E ., & B oreman, G., 1997.
D esign of an integrating sphere as a uniform illumination
source. IE E E T ransactions on education, 40(2), 131-134.
L abshere 2016, T echnical Guide – Integrating S phere T heory
and A pplications, North S utton, US A
https://www.labsphere.com/site/assets/files/2551/a-guide-to-integrating-sphere-theory-and-applications.pdf (14. A pril 2017)
J anesick, J . R ., 2007. Photon transfer. S an J ose: S PIE press.
J anesick, J . R ., 2001. Scientific charge-coupled devices (V ol.
83) . S PIE press.