DEVELOPMENT OF NETWORK-TYPE ARCHAEOLOGICAL INVESTIGATION
SYSTEM
F. Chiba a, *, S. Yokoyama a, A. Kaneda b, K. Konno c
a
LANG CO.,LTD, Morioka, Japan - (f-chiba, s-yokoyama)@lang-co.jp b
Nara National Research Institute for Cultural Properties, Nara, Japan - [email protected] c
Iwate University, Morioka, Japan - [email protected]
KEY WORDS: Archaeological Investigation System, Network, Underground Surveys, 3D Laser Scanner, Image Processing
ABSTRACT:
The Great East Japan Earthquake on March 11, 2011 is said to be a once-in-1000-year catastrophic quake. The Tsunami triggered by the earthquake destroyed broad coastal areas in northeast Japan. As recovery from the earthquake proceeds, the demand for new road construction, housing hill development, and residential construction is rapidly increasing. Culture plays a critical role in the district’s recovery. For that reason, before development, cultural properties in the corresponding districts must be urgently investigated. This is a must, although balancing cultural recovery with rapid economic recovery is no easy task. With this in mind, we have developed a new system focusing on speedy archaeological investigation and adequate documentation. The authors reexamined the existing investigation process to categorize tasks into two types: those that must be done only at archaeological sites (site A) and ones available at other places (site B). We then formulated a scheme where the tasks on both sites are performed simultaneously in parallel over the network. Experiments are ongoing. This presentation reports the process and issues of our research and development.
* Corresponding author
1. INTRODUCTION
In Japan, if a ground assigned as an archaeological site is to be changed, the site must be investigated before the change and an investigation report must be issued. The local government with jurisdiction over archaeological sites has been handling the investigation and report issue. At present, to reconstruct the towns destroyed by the Great East Japan Earthquake in 2011, new projects are increasing rapidly for transporting residences to hills or constructing roads. In this situation, however, archaeological investigation is needed before such reconstruction and there are not enough experts for the investigation. If archaeological sites are investigated as in the past, the long investigation time will interfere with smooth recovery. So taking quick action on this issue is desirable.
Since 2012, the authors have been working to construct a system that shortens the investigation time and allows reports to be created quickly. This paper describes progress to date.
2. METHODS
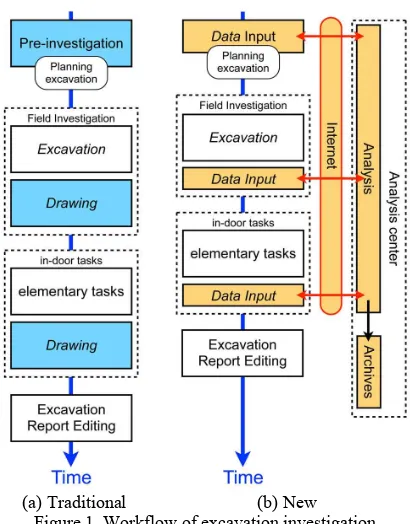
Figure 1(a) shows how the archaeological investigation has been done. General archaeological sites are formed by soil layers accumulated over many years. Field investigation at archaeological sites comprises two tasks: excavation that removes soil layers from the top and drawing that forms line images of excavated remains. In the course of the process, the excavated relics are carried indoors, washed out, assigned IDs, and other elementary tasks are performed to create order. The relics are then drawn through archaeological observation. The record drawings obtained in field investigation and that obtained through indoor tasks are edited to issue an excavation report.
(a) Traditional (b) New Figure 1. Workflow of excavation investigation
When an affected area (or site A) is excavated, an analysis center (or site B) is, at the same time, placed at a separate area to provide logistical support, and the two sites are connected through the Internet. At site A, excavation and various data input are intensively performed. At site B, the data and images sent continually from site A are processed and the information is shared immediately with site A. By using personal, intellectual and physical networks like this, the tasks at site A, originally including various restrictions, are simplified and effective archaeological investigation are achieved.
The following three points need to be improved over the traditional excavation investigation process:
(1) Determining distribution of remains before investigation: In the traditional investigation process, distribution of archaeological remains were determined by excavating a test pit at an arbitrary interval before the main investigation. The ground-penetrating radar (Figure 2) and a magnetic prospection device allow the stereoscopic distribution of remains to be determined without excavation. This also allows excavation and preservation of remains to be planned according to the distribution. Explored data is input at site A and the data is applied to data processing at site B, which supports rapid judgment regarding investigation progress.
Figure 2. Ground-penetrating radar device
(2) Recording measurement of remains:
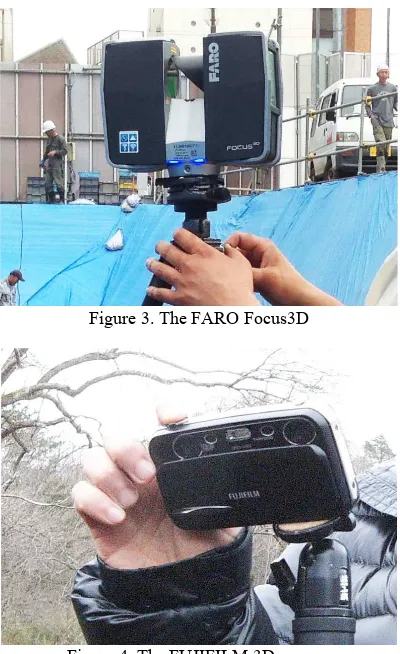
A 3-dimensional laser scanner and a digital camera are introduced to measure and record remains. The FARO Focus3D is used as the 3-dimensional laser scanner (Figure 3) and the FUJIFILM 3D Measurement System is used as a photogrammetric measurement device (Figure 4). Three-dimensional data is input at site A and the data is applied to image processing at site B. The result is shared between both sites. This can eliminate the need to draw remains. Both devices are easy and simple to handle. The devices are attracting attention, although there is room for improvement and operational testing is still needed.
Figure 3. The FARO Focus3D
Figure 4. The FUJIFILM 3D camera
(3) Recording measurement of relics:
A 3-dimensional laser scanner is also introduced to measure and record relics. To apply various characteristics of relics, the NextEngine 3D Scanner HD (Kaneda, 2009) and our original devices are used. Three-dimensional data is input at site A and the data is applied to image processing at site B. The result is shared between both sites. Doing so eliminates the need to draw relic shapes.
Underground surveys, 3-dimensional measurements, and image processing are not new technologies in archaeological study, but the authors further improve their performance and implement them in the comprehensive process for excavation and drawing. The authors’ goal is the situation where sites A and B are connected to each other with these technologies smoothly implemented as an integrated system.
3. RESULT AND DISCUSSION
3.1 Determining distribution of remains before investigation
The information obtained by underground surveys varies depending on the types of soil, and the data obtained at each area must be stored to compensate for the variations. In this project, the authors focused mostly on determining characteristics of northeast Japan. We used an array-type ground-penetrating radar and an array-type magnetic prospection device introduced with Grant-in-Aid for Scientific Research for our experiments.
remains in broad areas. Figure 5 shows the example of confirming the kiln site after magnetic prospection in Gifu. The data are processed at site B.
Ground-penetrating radar has not yet been used at an archaeological site of northeast Japan because of Radio Law restrictions.
Figure 5. Confirming the kiln site after magnetic prospection
3.2 Recording measurement of remains
We had seventeen experimental measurements to record remains (Table 1). Among these sites, the Koshida site in Miyako, Iwate and Moriai’s garden are located in the Tsunami-affected areas. Figure 6 shows how the measurement device is used.
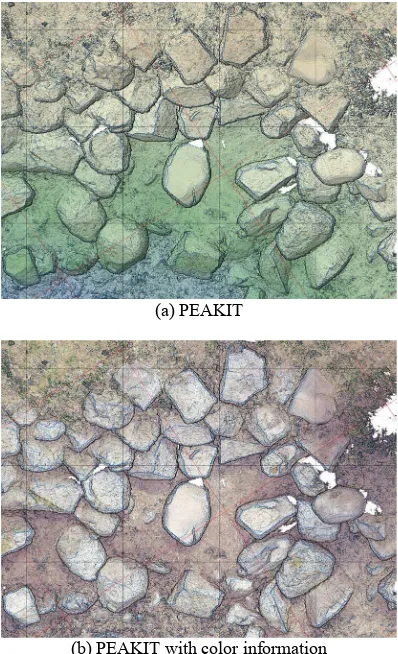
The 3-dimensional data was analyzed using PEAKIT, our original image processing method (Chiba and Yokoyama, 2009). Figure 7(a) shows the PEAKIT image of Moriai’s garden.
Site Name Location Date
Maruyama B site
Tokyo Pref. (2013) Jun. 14
Koshida site Iwate Pref. (2013) Jul. 9 Mizugami (2)
site
Aomori Pref. (2013) Jul. 17, Aug. 21, 29, Oct. 3, 14, 25, Nov. 6, (2014) Jul. 30, Sep. 23, Oct. 21, 29
Ohinoppara site Kanagawa pref. (2013) Aug. 20 Kawaratai site Aomori pref. (2013) Aug. 3 Moriai’s
garden
Iwate Pref. (2014) May 20
Nishiura Ishikiriba site
Shizuoka pref. (2014) Feb. 4
Table 1. Experimental measurements
Figure 6. Measuring remains
(a) PEAKIT
(b) PEAKIT with color information
Figure 7. PEAKIT image of the garden
The FARO Focus3D was introduced to obtain 3-dimensional data of an entire site within approximately hundreds to thousands of square meters. We achieved the following from this device:
(1) We collected know-how in field investigations to acquire appropriate data under various weather conditions such as in rain, wind, or sunsets.
(2) We developed two software applications to process point cloud data obtained from the 3-dimensional laser scanner: one is for interpolating missing data spots and the other interfaces with data processing. Figure 8 shows an example of the result of interpolating software processing.
(3) We developed a method to overlap the color of point cloud obtained by the scanner and the PEAKIT image (Figure 7(b)).
Figure 8. Missing data interpolation
This device is used to partially compensate for the data measured by the FARO Focus3D. We achieved the following using the FUJIFILM 3D Measurement System:
(1) We collected know-how to photograph in the environment suitable for constructing 3D data through repetitive experiments. Fine patterns in the background and physical undulation led to good results.
(2) We developed a software application to construct 3D data from photographs taken using SDK (Figure 9).
Figure 9. Developed software
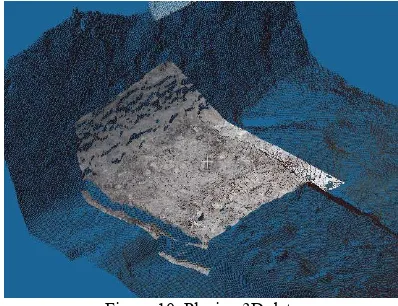
(3) We established a method to arrange two or more 3D data pieces and one to project the data to the site coordinate system. The FARO Focus3D data of an entire site (with site coordinate attached) is used as the base and the 3D data of photogrammetric measurement is placed using freeware CloudCompare (Figure 10).
Figure 10. Placing 3D data (Mitaka City Board of Education, 2015)
3.3 Recording Measurement of Relics
We produced two types of 3-dimensional measurement devices: rotational measurement and planar measurement. The suitable device was applied in experiments, depending on relic characteristics. PEAKIT was used to analyze the measured 3-dimensional data in the same way as remain analysis.
3.3.1 Rotational 3D Measurement: The NextEngine 3D Scanner HD was introduced for rotational measurement, used for earthenware or other cylindrical relics. We produced a device to enable automatic vertical movement of the NextEngine 3D Scanner HD. Figure 11 (a) shows the device and Figure 11 (b) shows a PEAKIT image of the measurement result of earthenware. To verify rotational measurements, the NextEngine 3D Scanner HD was installed at an in-site excavation office and a wooden product was measured. Figure 12 shows how the measurement was made.
(a) Device
(b) PEAKIT image of the measurement result
Figure 11. Rotational 3D measurement device
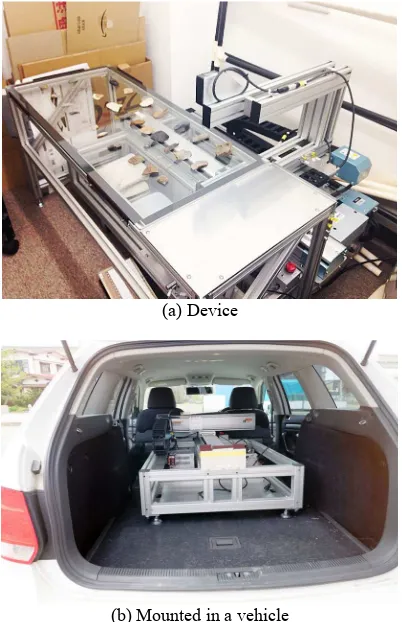
3.3.2 Planar-type 3D measurement: The planar type device is used to measure relics that have front and back sides, such as stone tools. Relics are placed on a glass plate and the laser measurements, this device was used to measure the stone tools in Mitaka, Tokyo (Figure 14).
(a) Device
(b) Mounted in a vehicle
Figure 13. Planar-type 3D measurement device
Figure 14. PEAKIT images of a stone tool (Mitaka City Board of Education, 2015)
4. CONCLUSIONS
As described in this paper, many methods are needed to measure varied archaeological materials effectively while taking into account the characteristics of each object. Many practical experiments revealed that the operation time required at site A could be significantly shortened. Table 2 compares the traditional and new methods.
We aim to put the “network-type site investigation system” into practical use, with which operations at sites A and B progress simultaneously in parallel. To do so, we will complete the subsystems for each operation and, at the same time, we will work more to share know-how, which includes how to use devices and to transfer and analyze data between the workers at both sites A and B.
It is obvious that the mechanism proposed in this development helps archaeological investigation and the corresponding report documentation. At the same time, huge numerical information is collected through the investigation process, which is also a significant feature of our project. In the future, we expect this system to be widely used, not only for recovery from disasters, but to produce new social values in digital archives of academic information and educational promotion projects. Table 2. Working Time at Side A
ACKNOWLEDGEMENTS
This research is made possible by the program to promote post-earthquake revitalization of Japan Science and Technology Agency.
REFERENCES
Chiba, F., and Yokoyama, S., 2009. New Method to Generate Excavation Charts by Openness Operators. 22nd International CIPA Symposium, Kyoto, Japan.
Kaneda, A., 2009. Application of A Low Cost Laser Scanner For Archaeology In Japan. 22nd International CIPA Symposium, Kyoto, Japan.
Mitaka City Board of Education, 2014. Hanezawadai Site,
Hanezawadai Tunnel Tombs Group 3 Site 2. Mitaka, Japan (in
Japanese).