DEFORESTATION ALONG THE MAYA MOUNTAIN MASSIF BELIZE-GUATEMALA
BORDER
S. D. Chicasa,b,*, K. Ominea, B. Arevaloc, J.B. Fordd, K. Sugimurae
aGraduate School of Engineering, Nagasaki University, 1-14 Bunkyo Nagasaki 852-8521, Japan- [email protected] bFaculty of Sciences and Technology, University of Belize, Belmopan, Cayo District, Belize- [email protected]
cFriends for Conservation and Development, Chi-Hah Street, Cayo District, Belize- [email protected] dWildlife Institute, Mike 67 Western Hwy, San Ignacio, Cayo District, Belize-[email protected]
eFaculty of Environmental Science, Nagasaki University, 1-14 Bunkyo Nagasaki 852-8521, Japan- [email protected]
KEY WORDS: Deforestation, Transboundry, Maya Mountain Massif, Protected Areas, Biodiversity, Belize
ABSTRACT:
In recent years trans-boundary incursions from Petén, Guatemala into Belize’s Maya Mountain Massif (MMM) have increased. The incursions are rapidly degrading cultural and natural resources in Belize’s protected areas. Given the local, regional and global importance of the MMM and the scarcity of deforestation data, our research team conducted a time series analysis 81 km by 12 km along the Belize-Guatemalan border adjacent to the protected areas of the MMM. Analysis drew on Landsat imagery from 1991 to 2014 to determine historic deforestation rates. The results indicate that the highest deforestation rates in the study area were -1.04% and -6.78% loss of forested area per year in 2012-2014 and 1995-1999 respectively. From 1991 to 2014, forested area decreased from 96.9% to 85.72% in Belize and 83.15% to 31.52% in Guatemala. During the study period, it was clear that deforestation rates fluctuated in Belize`s MMM from one time-period to the next. This seems linked to either a decline in deforestation rates in Guatemala, the vertical expansion of deforestation in Guatemalan forested areas and monitoring. The results of this study urge action to reduce incursions and secure protected areas and remaining forest along the Belize-Guatemalan border.
1. INTRODUCTION
From 1991 to 2014, forested area decreased from 96.9% to 85.72% in Belize and 83.15% to 31.52% in Guatemala. The majority of forest clearing is linked to Guatemalan agricultural settlements along the border and illegal settlements within Belize. This transnational border security problem has caused severe forest and resource degradation in the Maya Mountain Massif (MMM), which includes several protected areas adjacent to Belize’s western border with Guatemala. Population growth and poverty in Guatemala, and lack of law enforcement and border security in both Belize and Guatemala are largely responsible for the unabated and illegal forest clearing that has taken place along the border region over the past 3 decades.
Illegal incursions from Guatemala create critical financial, environmental, public health, and security problems for Belize. Deforestation continues despite the herculean efforts by NGO protected areas management organizations, to control incursions and illegal extraction. The primary effort to curb deforestation and illegal incursions in the trans-boundary area of Western Belize comes from Friends for Conservation and Development (FCD), a non-governmental protected areas management organization comprised of local conservation professionals. Likewise in Guatemala, it is primarily the non-governmental community that works to curb environmental degradation in the border area.
Given the local, regional and global importance of the MMM and the eco-system services it provides, enforcement efforts should be directed toward stopping incursions. Enforcement is complicated by the transnational nature of the incursions from Guatemala into Belize; and further complicated by the lack of effective law enforcement on either side of the Belize-Guatemala border. The incursion issue has been politicized on
several accounts on both sides of the border; notwithstanding the long-standing territorial claim over Belize by Guatemala. This study seeks to quantify deforestation rates over a 23 year time lapse series, and will hopefully provide further precedence for securing the border and adjacent protected areas. This research builds on previous studies of deforested areas within the Chiquibul Forest System (CFS), which is one of the 4 protected areas inside the MMM.
The study area included an area 81 km along the border, and 6 km inside both Belizean and Guatemalan borders. To determine deforestation rates within the study site, we used CLASlite algorithms to conduct a time-series analysis of Landsat satellite imagery from 1991-2014. We also compared and analysed deforestation rates in Belize and Guatemala to better understand the forest change dynamics within the study site. This study provides important analysis that will aid in identifying, planning and implementing effective and feasible conservation measures along the Belize-Guatemala border.
2. STUDY SITE
The tri-national area including Belize, Northern Guatemala and Southern Mexico is referred to Northern Mesoamerican Biogeographic Region (NMBR). The NMBR harbors one of the highest biodiversity concentrations in the world; and ranks second in the world among 25 “biodiversity hotspots” for species’ endemism (CEPF, 2004). The MMM is part of the NMBR which contains the largest block of intact, contiguous tropical forest north of the Amazon, totaling approximately 5l0,227.66 ha and accounting for 22.2% of Belize’s national territory (Briggs, Mazzotti et al., 2013). Despite Central America’s relatively small landmass, its biodiversity accounts for between 7% and 10% of global endemic species, and 14%
of terrestrial endemic species (CEPF, 2004). The International Union for Conservation of Nature (IUCN, 2015) red list identifies 102 endemic species in Belize, 255 species in Guatemala, and many more in Mexico as threatened (rare, endangered or critically endangered).
Due to the high threat level and the MMM’s high biodiversity value, it is ranked by Conservation International as the second most important of the 25 global hotspots (Baden, Särkinen et al., 2015). Historically, the MMM’s remote locale provided a buffer against illegal extraction. Since the mid-nineties, settlements along the border and incursions from Guatemalans have significantly degraded biological and cultural resources (UNEP, 2011).
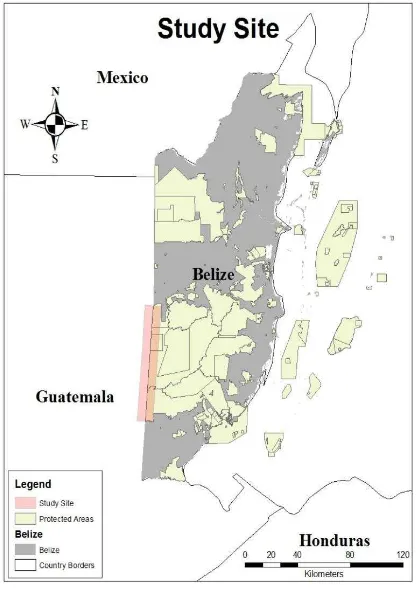
The MMM lies within UTM Zone 16 in southwestern Belize, and extends from the Vaca Forest Reserve (VFR) in the north to the Columbia River Forest Reserve (CRFR) in the south, sharing a border with Petén, Guatemala and contributing to the Chiquibul-Montanas Mayas Biosphere Reserve (CMMBR), Petén (Briggs, Mazzotti et al., 2013) (Fig. 1).
Figure 1. Belize-Guatemala MMM border
Petén is Guatemala’s northern most district and one of the fastest growing. It is Guatemala’s last frontier and national policy has encouraged immigration and agricultural expansion. Conversely, Belize is the least populated country in the Mesoamerican region, and its emptiest area, the MMM, shares a border with Petén.
3. METHODOLOGY
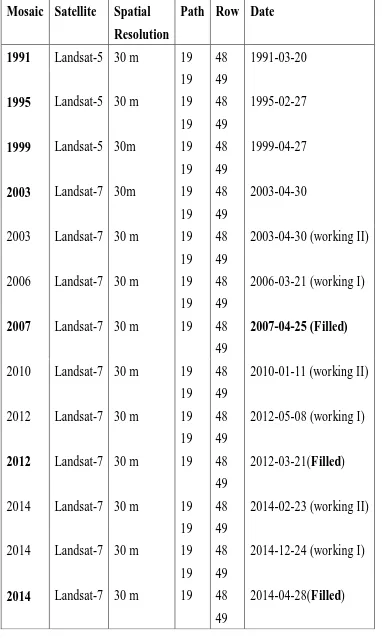
Satellite imagery from 1991 to 2014 was analyzed in 7 time steps (1991, 1995, 1999, 2003, 2007, 2012, and 2014). The satellite image bands obtained from the United States
Geological Survey global archives were stacked and a mosaic was created for each time step (Fig. 2). Landsat 5 Thematic Mapper imagery from 1991 to 1999, and Landsat 7 Enhance Thematic Mapper imagery from 2003 to 2014 (Table 1) were used. Next, we digitized the 81 km Belize-Guatemalan MMM border and created a 6 km buffer on each side. Then we used the buffer to clip the study site from the Landsat mosaics.
Figure 2. Flow diagram depicts the preparation and analysis of geospatial data in the forest cover and change analysis.
The study site datasets were then re-processed and classified by CLASlite algorithms. The algorithms classified forest as pixels where the photosynthetic vegetation cover was ≥ 80 and where bare substrate cover fraction was < 20. The algorithms classified non-forest as pixels where the photosynthetic vegetation cover was < 80 or where the bare substrate cover fraction was > 20 (Asner, 2009). Finally, we used the Puyravaud (2003) standardized approach to calculate deforestation rates for the 6 sub-time steps ( 1991-1995, 1995-1999, 1999-2003, 2003-2007, 2007-2012, 2012-2014).
3.1 Filling the Gaps of Landsat 7 ETM+ image
The scan-line corrector (SLC) for the ETM+ sensor on board Landsat 7 failed permanently on May 31, 2003, resulting in data gaps which comprise approximately 22% pixels of the image (Chen, Zhu et al., 2011). To compensate for this loss required filling the mosaics with other images of similar dates. We
generated the filled mosaics for 2007, 2012 and 2014 by utilizing two other Landsat images (Table 1). The data from the working images I and II were used to fill the pixels in the filled image.
3.2 Pre-processing and Classification of Satellite Imagery
Our team used CLASlite algorithms to convert the Landsat images from raw digital number format (DN) to create forest cover and forest change maps. CLASlite’s image calibration consisted of four major automated and several minor data masking steps. Image calibration in CLASlite was followed by the Automated Monte Carlo Unmixing (AutoMCU) algorithm which calculated the image’s fractional cover of photosynthetic vegetation (PV), non-photosynthetic vegetation (NPV), and bare substrate (S) on a scale from 0-100% cover in every image pixel (Reimer, Asner et al. 2015). Finally, CLASlite processed outputs from AutoMCU and the reflectance steps, and applied a series of decision trees to estimate forest cover on single-date imagery and forest change on multi-temporal images (Reimer, Asner et al., 2015).
3.3 Post-Processing
The dataset post-processing consisted of 4 steps. First, we vectorized the forest cover and forest change datasets generated by CLASlite algorithms. We removed areas in each dataset that were less than 1 hectare. Second, we reclassified the datasets ENVI classification raster layers and conducted change statistics for the 7 time-steps.
3.4 Comparison with other work
In order to verify the results of this study, we compared the results of this study with the only deforestation dataset available to us for the study region, Deforestation in Belize 1980-2010 (Cherrington, Ek et al., 2010).
3.5 Estimation of deforestation rates
We calculated forest cover and deforestation rates in the study site using the standardized approach proposed by Puyravaud (2003) and modified by Remere (2015).
Deforestation rate yr− 1 =
{[1/(time A2 – time A1)] × log(A2/A1)} × 100 (1)
Where A1 = Forest Area at beginning of time step A2 = Forest Area at end of time step
time A1 = Year and day count as digit number of beginning of time step
time A2 = Year and day count as digit number of end of time step
We used the resulting deforestation rates to compare deforestation in Belize and Guatemala during the study period.
4. RESULTS
Figure 3 depicts continuously increasing deforestation in Guatemala, extending across the border into Belize. The results illustrate that in 1991, there were three deforested areas in Guatemalan study area and only one in the northernmost part of the Belizean study area. From 1991-1995 deforestation remained largely stagnant, with the emergence of a small deforested area in the middle region in Guatemala. However, in the period of 1995-1999, existing deforested areas in Guatemala and Belize expanded and new deforestation emerged on both sides of the border. From 1999-2003, deforested areas expanded only slightly, especially in the southernmost region of Belize and Guatemala. However in 2003-2007, deforestation expanded rapidly connecting northern and central deforested areas in Guatemala. From 2007-2012, new deforestation remained relatively stagnant, with expansion occurring nearby deforested areas on both sides of the border. Then once again in 2012-2014, new deforested areas appeared in the northern and central parts in Belize.
The results of the forest cover and forest change analysis along the MMM Belize-Guatemala border indicate that in 1991 the total forest cover was 89.99% of the study area (88,002.3 ha of 97,794.09 ha) (Figure 4). By 2014, the total forest cover was reduced by 31.52% to 58.47% of the study area (57,176.8 ha). The highest forest loss occurred from 1995-1999; with a loss of 9.76% (9,553.8 ha). This reduction was followed by the period of 2003-2007 with a forest loss of 5.66% (5,539 ha). The lowest forest loss was observed in 2012-2014, at 3.38% or (3,308.1 ha).
Figure 3. Deforestation along the Belize-Guatemala western border 1991-2014
However, the highest deforestation rates occurred from 1995-1999 with a loss of -2.9% annual reduction and 2012-2014 with a -2.7% annual reduction of forested area. The lowest deforestation rates occurred between 1991-1995 and 2007-2012, both with -1.1% forest loss. Figure 4 illustrates that the Forest Total and Forest Gua curves follow a similar slope in both forested and non-forest areas. On the other hand, Forest Bz and No-Forest Bz slope vary, indicating lower deforestation.
Figure 4. Study site forest cover and forest loss 1991-2014
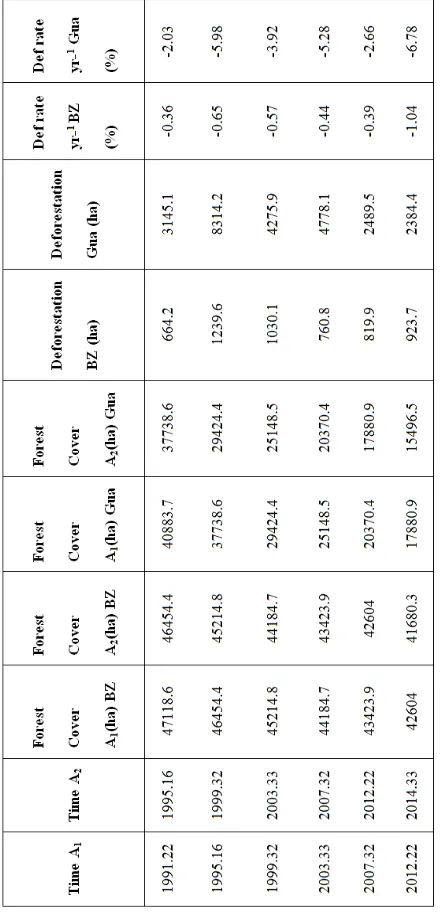
In Belize in 1991 the forest cover was 47,118.6 ha or 96.9% of the study area. By 2014, the forest cover declined to 85.7% (Table 2). The results of the forest cover change show that the highest forest loss occurred between 1995-1999 and 1999-2003 with a loss of 1,239.6 ha and 1,030 ha respectively. On the other hand, the highest deforestation rates occurred in 2012-2014 and 1995-1999 with losses of -1.04% and -0.65%. The lowest forest loss and deforestation rate occurred in 1991-1995, 664.2 ha or -0.36%.
Table 2. Forest Cover and deforestation rate in Belize and Guatemala 1991-2014
In Guatemala in 1991, the forest cover was 40,883.7 ha or 83.15% of the Guatemalan side of the study area. By 2014, the forest cover had decreased to 31.52% (Table 2). The results indicate that the highest forest loss occurred in 1995-1999 with forest loss of 8,312.2 ha and 2003-2007 with a forest loss of 4,778.1 ha. On the other hand, the highest deforestation rates occurred in 2012-2014 (-6.78%) and 1995-1999 (-5.98%). In 1991-1995 deforestation rate was the lowest at -2.03% or 3,145.1 ha.
4.1 Comparison with other work
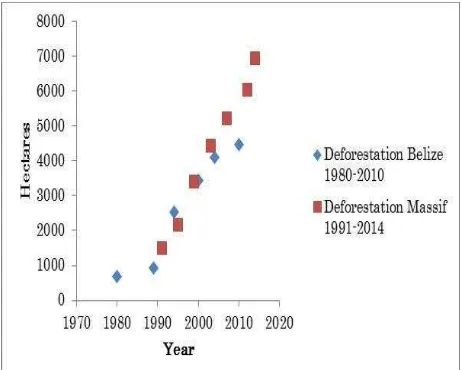
Figure 5 compares the results of the accumulated deforestation between 1980 and 2004 in Belize. The datasets used to do this comparison cover different study periods (1980-2010 & 2014); however, there is an overlap of the study periods 1991-2004. The 1980-2010 study dataset is the most comprehensive national deforestation study that has been conducted in Belize.
Figure 5. Accumulated deforestation comparison, Deforestation in Belize 1980-2010 and Maya Mountain Massif 1991-2014.
The datasets are similar; especially in years where the time-steps are spaced one year apart, as is the case of 1994 & 1995, 1999 & 2000 and 2003 & 2004.
5. DISCUSSION
Deforestation incursions occurred inside Belize well before 1991. Satellite imagery analysis indicated that before 1991, in Belize, 1,507.67 ha of forest already appeared to be deforested (Fig. 4). Deforestation in Guatemala intensified from 1991 to 2014, an event and time which correlated with escalation of incursions across the border into Belize’s protected areas. Guatemalan communities along the border are highly dependent on forest resources. For many, their food supply and economic livelihood is dependent on expanding agriculture on already marginal lands, and extracting resources from forested areas. The slash and burn agricultural system, while intensive and sustainable when well-managed, is the major cause of deforestation and fires along the western border. Timber and NTFP extraction, wildlife poaching and other illicit activities are also associated with these incursions and settlements.
By 2014, only fragmented patches of forest remained within the Guatemalan study area. With the forest that once served as a buffer for Belize gone, and given the limited monitoring capabilities by managing organizations in both countries, deforestation and incursions inside Belize’s MMM increased (Fig. 3). Our data suggests that between 1999-2007, the average annual deforestation rate in Guatemala`s 6 km buffer was 4.6% per annum. This conclusion is similar to that of the study conducted by Castellanos et al. (2011) which describes deforestation rates in Peté at 4% per year from 2001-2006 (Blackman, 2015). Lopez, Carr et al., (2012) confirm that most deforestation was caused by migration of cattle ranches and subsistence agriculture along the ever-expanding agricultural
frontier. In both Belize and Guatemala, the highest deforestation rates occurred in 20122014 and 19951999 with rates of -1.04% and -0.65% and -6.78% and -5.98% respectively (Table 1). The high deforestation rates where due to internal Guatemalan migration to Petén, local population growth, landlessness, poverty, depletion of forest resources and unsustainable agricultural practices (Ovando, 2008; Gómez & Mendez, 2005; Brooks, 2002; Carr, 2009). The second lowest deforestation rate in Belize and Guatemala occurred in 2007-2012, -0.39% and -2.66% respectively as a result of increased monitoring by Belize’s NGOs; chiefly Friends for Conservation and Development in Belize.
Throughout the study period, the deforestation rates in Guatemala followed a pattern of increase and decrease from one time-step to the next (Table 1). In 2003-2007 deforestation rate decreased in Belize while in Guatemala deforestation rate increased. This could be due to the vertically expansion of deforestation that occurred in 2003-2007, which connected the isolated deforested patches in Guatemala that appeared in 1999; therefor making horizontal expansion into Belize slower (Fig.3). The 2003-2007 time-step illustrates a trend that emerged during the study period in which isolated deforested patches appeared in the study site, and over time the deforestation that followed filled the gaps between the isolated patches. A similar pattern seems to have occurred in Belize where deforestation occurred vertically along the border.
In 2007-2012 there was also a decrease in the deforestation rate. This can be attributed to two factors: First, there was a decrease of deforestation rate in Guatemala. Second, NGOs in Belize increased monitoring along the Belize-Guatemala border, and in 2007 the Belize Defence Force started destroying illegal crop fields inside Belize’s MMM (Friends for Conservation and Development, 2007). However, amidst the increased monitoring and destruction of crops, the deforestation rate in Belize increased dramatically from 2012-2014. This increase can be attributed directly to increased deforestation rates in Guatemala, especially along the border. This deforestation depleted the only buffer between Guatemalan agricultural areas and Belize’s MMM (Table 2 & Fig. 3).
The accuracy of the results in 2007, 2012 and 2014 could be improved if satellite imagery without the scan-line corrector (SLC) error were used. Also, due to security reasons, limited studies have been conducted on the ground within the study area. Extensive ground data is lacking, making it difficult to conduct accuracy assessments of historic datasets. In order to verify the results of this study, we compared the results of this study with the only deforestation dataset available to us for the study region; Deforestation in Belize, 1980-2010. Although this 1980-2010 dataset covered different study periods, it was possible to compare the results of this study with our own. Although there are some differences between the two datasets in terms of accumulated deforestation, after 24 years, the accumulated outputs differed by only 8%.
The disappearance of forest along the Belize-Guatemalan border represents testing ecological and environmental implications for Belize’s MMM, a critical conservation area. The increase of deforestation will further aggravate the current ecological, environmental, public health and diplomatic situation. Although this study quantified landscape scale deforestation along the border, analysis of soil erosion, water quality degradation, and ecological impacts are lacking. In order to address the current situation, good collaborative networks
need to be established between the border area stakeholders, and more resources need to be leveraged by both Belizean and Guatemalan authorities to improve security along the border. Bilateral collaborations need to be established which include partnerships with NGOs, Governments and community organizations. More binational research needs to be conducted to understand socioeconomic dimensions of this problem, and to directly consider socio-economic challenges within management plans. Policy needs to be updated that will secure the area and provide legal guidelines for economic development. The results of this study will serve as a catalyst to establish national and binational collaboration and to garner support from the MMM stakeholders to effectively address deforestation and degradation.
6. CONCLUSION
From 1991-2014, forest cover in the study area declined from 89.99% to 58.47%. In Belize, the forested area declined from 96.9% to 85.7%, and in Guatemala, forested area declined from 83.15% to 31.52%. During the study period, it was clear that deforestation rates fluctuated in Belize`s MMM from one time-period to the next. This seems linked to either a decline in deforestation rates in Guatemala or the vertical expansion of deforestation in Guatemalan forested areas. Although monitoring and security along the border has increased and curbed some illicit activity, incursions and rates of deforestation continue to increase. This is due, in part, to limited resources and poor national and binational collaboration. As a result of the disappearance of the Guatemalan forest along the border, now more than ever, it is imperative to establish binational collaborations to address the incursion problem. In Guatemala, as well as in Belize, there is interest by NGOs, government and communities to protect the natural resources. Failure to develop binational management plans will result in continued ecological and environmental degradation, and damage public health, welfare and finances.
ACKNOWLEDGEMENTS
We would like to acknowledge the Japanese Ministry of Education, Culture, Sports, Science and Technology (MEXT) for their support.
REFERENCES
Asner, G. P., Knapp, D. E., Balaji, A., & Páez-Acosta, G., 2009. Automated mapping of tropical deforestation and forest degradation: CLASlite. Journal of Applied Remote Sensing, 3(1), pp. 033-543.
Baden, H. M., T. Särkinen, et al., 2015. "A Botanical Inventory of Forest on Karstic Limestone and Metamorphic Substrate in the Chiquibul Forest, Belize, with Focus on Woody Taxa." Edinburgh Journal of Botany: pp.1-43.
Blackman, A., 2015. "Strict versus mixed-use protected areas: Guatemala's Maya Biosphere Reserve." Ecological Economics, 112, pp. 14-24.
Blackman, A., A. Pfaff, et al., 2015. "Paper park performance: Mexico's natural protected areas in the 1990s." Global
Environmental Change 31, pp. 50-61.
Briggs, V. S., F. J. Mazzotti, et al., 2013. Conceptual Ecological Model of the Chiquibul/Maya Mountain Massif, Belize. Human and Ecological Risk Assessment: An International Journal 19(2), pp. 317-340.
Brooks, T. M., Mittermeier, R. A, et al., 2002. Habitat loss and extinction in the hotspots of biodiversity. Conservation Biology, 16(4), pp. 909-923.
Carr, D. L., 2009. Population, rural development, and land use among settler households. Journal of Global and International Studies, 1(1), pp. 51-69.
CEPF., 2004. Critical Ecosystems Partnership Fund. Ecosystem Profile. Northern Region of the Mesoamerica Biodiversity Hotspot: Belize, Guatemala & Mexico http://www.cepf.net/Doc uments/final.mesoamerica.northernmesoamerica.ep.pdf (18 Dec. 2015)
Chen, J., Zhu, X., Vogelmann, J. E., Gao, F., & Jin, S., 2011. A simple and effective method for filling gaps in Landsat ETM+ SLC-off images. Remote Sensing of Environment, 115(4), pp. 1053-1064.
Cherrington, E. A., E. Ek, et al., 2010. Forest Cover and Defo- restation in Belize: 1980-2010. Panama, Water Center for the Humid Tropics of Latin America and the Caribbean.
Friends for Conservation and Development., 2007. Chiquibul National Park Guatemalan Incursions: A Case for Urgent Action.: 7
Gómez, I. and V. E. Mendez., 2005. Association of Forest Communities of Petén, Guatemala. Indonesia, Center for International Forestry Research 51.
IUCN., 2015. Red List. Table 5: Threatened species in each country (totals by taxonomicgroup) http://www.iucnredlist.org/ documents/summarystatistics/2013_1_RL_Stats_Table_5.pdf (12 Jul. 2015)
López-Carr, D., J. Davis, et al., 2012. "Space versus place in complex human–natural systems: Spatial and multi-level models of tropical land use and cover change (LUCC) in Guatemala." Ecological Modelling, 229, pp. 64-75.
Ovando, D. A. C., 2008. Road Impact On Deforestation And Jaguar Habitat Loss In The Maya Forest PhD, Duke.
Puyravaud, J.-P., 2003. Standardizing the calculation of the annual rate of deforestation. Forest Ecology and Management, 177(1-3), pp. 593-596.
Reimer, F., G. P. Asner, et al., 2015. "Advancing reference emission levels in subnational and national REDD+ initiatives: a CLASlite approach." Carbon Balance Manag 10(1), pp. 5.