THE ROLE OF SATELLITE DERIVED DATA FOR FLOOD INUNDATION MAPPING
USING GIS
Kuldeepa*, P. K. Garga
a
Geomatics Engineering Group, Civil Engineering Department, Indian institute of Technology Roorkee, India - (kchaurasia.nitb, pkgiitr)@gmail.com
Commission IV, WG IV/7
KEY WORDS: Remote Sensing, Image Classification, Object Extraction, Flood Mapping.
ABSTRACT:
River flooding in planar region is the most significant type of natural disaster that modern society is exposed to, affecting several thousand people each year. Recent flood events, population growth concerns have augmented the call for global methods which utilise both spatial and temporal dynamics. Object oriented classification approaches based on the segmentation are being adopted for extraction of variety of thematic information from high resolution satellite images. Generation of landuse/cover map which is one of the important inputs to the model for flood inundation mapping and for accurate assessment of damage due to floods requires advanced methods of image classification. The Cartosat-1 (PAN) satellite data has been fused with the LISS-III (MX) to obtain the color image containing both high spatial and spectral information. The fused image is further classified to obtain the landuse/cover map using object based classification approach. The classification results are assessed by calculating overall accuracy and kappa index with the help of error matrix. The overall accuracy of classification has been obtained 86.00% with kappa index 0.7815. The objective of this study is to develop a GIS aided model for flood inundation mapping of the surrounding of the part of the Yamuna River which flows through the two districts i.e. Yamuna Nagar and Saharanpur in states of Haryana and Uttar Pradesh respectively. The model considers the five parameters viz. topography (slope, elevation) information, landuse/cover, time series data of surface water elevation, river geometry and location of the rain gauge station. Field survey has been conducted to validate the positional accuracy of the DEM and landuse/cover classes using DGPS. A final flood inundation map has been prepared by combining all weighted layers with in GIS environment. The flood inundation maps can further be used for quick identification of areas of potential flood hazard to minimize the flood losses.
1. INTRODUCTION
Since past few decades, riverine flooding and flash flooding along floodplains have received considerable attention of researchers. As the severity and frequency of flood events have considerably increased, there is a growing global concern about the requirement to lessen the fatalities due to flood and associated economic losses. Identification of flood prone areas can therefore be one of the key solutions in flood mitigation. Predicting susceptible floodplains and high potential flash flood prone areas can assist authorities to better plan management strategies for mitigation of flood (Sarhadi et al., 2012). Accurate identification and delineation of the flood prone areas requires detailed elevation data however, high-resolution elevation data is costly and commonly unavailable, hence only freely available elevation datasets such as US Geological Survey (USGS) Digital Elevation Models (DEM), National Remote sensing centre (NRSC) Cartosat-1 DEM and contour maps are typically relied on (Chen et al., 2009). During mansoon season in India, major rivers overflow to cause flooding in various regions. Collection of sufficient observations of flood inundation extent is a very tedious and time consuming task which has augmented the need of some sort of automatic model for flood inundation mapping.
Horritt et al.(2002) have tested 1D and 2D models of flood hydraulics for predicting river flood inundation. They used
floodplain and channel friction as free parameters to the models. They found the different predictive performances of the models due to changes in friction parameterization. Jain et al. (2009) have developed a GIS-based urban flood inundation model which was composed of two components: a storm–runoff model and an inundation model. The output of the storm–runoff model i.e. cumulative surface runoff was given as input to the inundation model. Mason et al. (2009) have proposed a method for Calibration of uncertain flood inundation models using remotely sensed data. Fused SAR image and LIDAR data were used for delineation of waterlines with the help of active contour model (snake). The performance measure based on height differences of corresponding points along the observed and modeled waterlines was found to be significantly more sensitive to the channel friction parameter than the measure based on areal patterns of flood extent. A result of this was that there was less uncertainty in the final flood hazard map.
Sarhadi et al. (2012) have presented an exhaustive methodology of floodplain mapping at ungauged rivers. To delineate flood hazard maps and to enhance the accuracy of the hydraulic modeling, satellite stereoscope images of Cartosat-1 along with the Rational Polynomial Coefficients to extract a high resolution DTM were used. The detailed parameterization of the channel was evaluated to use it as input to 1D hydraulic model HEC-RAS. Historical flood events information was also utilized to evaluate the hydraulic model performance to predict flood inundations.
Saleh et al. (2013) have assessed the sensitivity of 1D Saint– Venant hydraulic model to different types of river morphological data. They concluded that the accuracy of predicted water levels and maximum water depths simulated by a Saint–Venant model relies on an accurate representation of channel geometry and bed level slopes along the river reach. Fosu et al. (2013) have suggested an approach for river inundation and hazard mapping with the help of GIS, spatial technology and HEC-RAS hydraulic tools. Affected buildings were delineated by overlaying the flooded area onto the topographic maps. They concluded that high water depth occurred along the main channel and spreads gradually to the flood plain.
Bates and De Roo (2000) have developed a new model for simulating flood inundation. The developed model was compared with other existing models such as a planar approximation to the free surface and a relatively coarse resolution two-dimensional finite element scheme. The developed model outperformed both the simpler and more complex process representations and correctly predicted 81.9% of inundated and non-inundated areas.
2. STUDY AREA AND DATA RESOURCES
Study Area: The study area belongs to a part of Yamuna
River which passes through two districts viz. Saharanpur and Yamuna Nagar in states of Uttar Pradesh and Haryana respectively. The part of the river contains many small size islands and other Riverine features. The upper left scene co-ordinates and the lower right scene co-co-ordinates are 30◦ 21ꞌ 40.65ꞌꞌ N, 77◦ 34ꞌ 12.60ꞌꞌ E and 30◦ 05ꞌ 0.60ꞌꞌ N, 77◦ 27ꞌ 20.08ꞌꞌ E respectively. The details of the satellite data used for analyses have been shown in Table 1.
Pre-processing of the satellite data is carried out in ERDAS Imagine software. Various maps of the study region are prepared in Arc GIS. The flood plain delineation mapping has been carried out using Arc Hydro within a Geographical Information System(GIS).
Table 1. Details of satellite data used for analysis
Data capture: Streamflow data
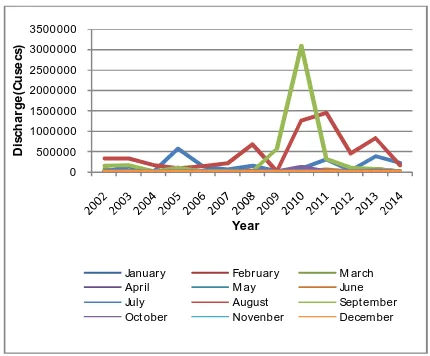
Discharges of Yamuna River are recorded by gauging station at the Hathnikund barrage situated in Yamuna nagar district of Haryana state, India at an elevation of 323m. This station is maintained by Irrigation department of Harayana state. Daily average discharges are available since 1995 with the exception of 1998-2001 period. The daily discharge values were obtained from station for the water years from 2002 to 2014 which has been ploted in Fig.1.
DEM Generation: A high resolution Digital Elevation
Model (DEM) is required to extract the topography information for reliable and accurate flood inundated area mapping. Some new data sources such as LIDAR and SAR
has also been used by various researches for generation of high resolution DEM (Geerling, 2009; Sanders, 2007). However, these data sets are available for limited regions. DEM of the study region has been generated from the stereo pair of Cartosat-1 images. The Cartosat-1 satellite carries two high resolution imaging PAN cameras viz. the foreward looking camera (Fore) and the afterward looking camera (Aft). Both the cameras capture panchromatic images with a spatial resolution of 2.5 m. The generation of detailed DEM involved five steps: interior orientation, exterior orientation, tie point generation, triangulation and model refinement using Ground Control Points (GCPs).
Figure 1. Plot of Discharge data (monthly average)
3. METHODOLOGY
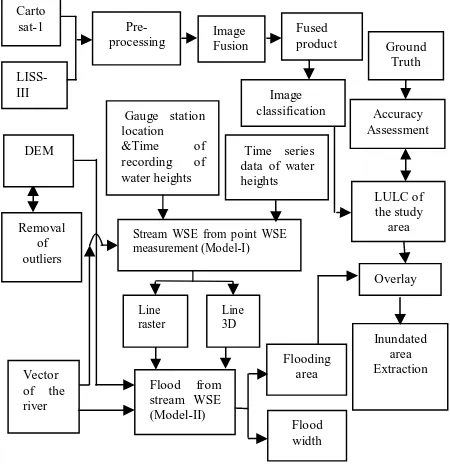
Methodology adopted in this research work mainly consist of 4 steps viz. Image fusion, object based image classification, generation of water surface elevation raster and flood inundated area vector generation. The complete flow of the processes has been shown in Fig 2.
Image fusion: Image fusion is a process combining two or
more images to produce a single image with high visual interpretability. On a high spatial resolution panchromatic image (PAN), detailed geometric features can easily be recognized, while the multispectral images contain affluent spectral information (Shi et al. 2005). The capabilities of the images can be enhanced if the advantages of both high spatial and spectral resolution can be integrated into one single image that can be done using a process known as image fusion. The outcome of image fusion is a new image which is more worthy for human and machine perception or further image-processing tasks such as segmentation, feature extraction and object recognition. In this paper, PAN (Cartosat-1) imagery has been fused with the MX (LISS-III) using resolution merge approach. Various fusion techniques are available in literature; here we have used resolution merge approach to fuse various images with one another. Resolution merge approach is adopted because it is found best for classification (yang et al. 2012).
Object oriented classification: Object oriented classification
approach involves the several steps to perform classification. The first step is to partition the image into meaningful objects called segments. The next step is to extract various features
S.N. Satellite Sensor Resolution
(m)
such as textural, spectral, spatial etc. Finally, image is classified based on the features obtained in the previous step. Image classification based on spectrum features faces the problem of proper categorisation of the different objects with the same spectral characteristics. This affects the classification accuracy seriously. Afore mentioned problem can be solved by incorporating the texture features along with the spectral features in classification. In this research work, spectral,textural and spatial features are extracted and further used for classification of satellite imagery using ENVI EX v4.8 which employs edge-based segmentation algorithm that is very fast and only requires one input parameter i.e. scale. The imagery has been classified into 9 landuse/cover classes.
Figure 2. Methodology the river were extracted from the Digital Elevation Model of the study region. The outcomes of the model are surface containing the water elevation in vector and raster formats. Raster surface was used as input to model-2 to produce the flood inundated region.
Model-2: This model takes 3 datasets as input viz. Raster surface with water elevation, vectorized stream and DEM of the study region as shown in Fig 4. The outcome of the model-2 is delineated flood plain surface corresponding to the discharged water volume.
4. RESULTS AND DISCUSSION
In this paper, IRS data (Resourcesat-1 and Cartosat-1) has been used for generating the fused product of 2.5 m spatial resolution as shown in Fig. 3.. Resolution merge technique
with Brovey transform has been adopted for merging the MX image with the PAN band.
Figure 3. Location of Gauge at Hathinikund barrage marked over fused imagery
The fused image has been segmented at the scale of 80. Spectral, textural and spatial features have been extracted from the segmented imagery. The segmented imagery has been categorised into 9 landuse/cover classes viz. Agriculture, crop land, wasteland, river, canal, built-up, mining/industrial and road based on extracted features using support vector machine classification. The classified imagery has been shown in Fig. 5.
processing Image Fusion
Fused
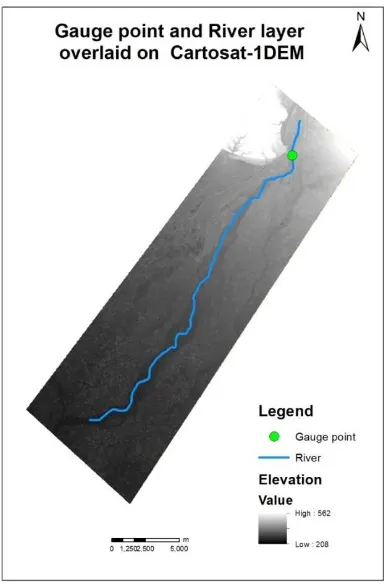
Figure 4. Location of Gauge and River layer overlaid on Cartosat-1 DEM
The accuracy of the classification results has been assessed by calculating overall accuracy and kappa index with the help of error matrix. The value of overall accuracy and kappa index has been shown in Table 2.
Table 2. Accuracy assessment of classified image
S.N. Scale
Overall accuracy(%)
Kappa coefficient
1 80 86.00 0.7815
Figure 5. Landuse map of the study area
Figure 6. Flood inundated layer overlaid on Landuse map
5. CONCLUSION
In this paper, fused imagery has been classified using object based classification approach. The fused image has been classified into 9 landuse/cover classes. The object based classification process has been found to be suitable for classification of high resolution satellite images with acceptable classification accuracy. Accuracy of the classification has been assessed with the use of Ground truth data collected using DGPS. The overall accuracy of classification has been obtained 86.00% with kappa index 0.7815. The model for delineating the flood inundated region has been found as one of the satisfactory approaches which utilises the satellite derived datasets as a primary input. Incorporation of data values from multiple gauge stations, network of streams and high resolution DEM is the future work of the study.
REFERENCES
Bates, P., and De Roo, A., 2000. A simple raster-based model for flood inundation simulation. Journal of Hydrology, 236(1), pp. 54-77.
Chen, J., Hill, A. and Urbano, L., 2009. A GIS-based model for urban flood inundation. Journal of Hydrology, 373(1), pp. 184-192.
Fosu, C., Forkuo, E. and Asare, M., 2013. River inundation and hazard mapping- A case study of Susan River-Kumasi, Proceedings of Global Geospatial Conference, Qubec City, Canada, pp. 14-17.
Geerling, G.W., Vreeken-Buijs, M.J., Jesse, P., Ragas, A.M.J., Smits, A.J., 2009. Mapping river floodplain ecotopes by segmentation of spectral (CASI) and structural (LiDAR) remote sensing. River Res. Appl. 25, pp. 795–813
Horritt, M. and Bates, P., 2002. Evaluation of 1D and 2D numerical models for predicting river flood inundation. Journal of Hydrology, 268(1), pp. 87-99.
Saleh, F., Ducharne, A., Flipo, N., Oudin, L. and Ledoux, E., 2013. Impact of river bed morphology on discharge and water levels simulated by a 1D Saint-Venant hydraulic model at regional scale. Journal of Hydrology, 476, pp. 169-177. Sanders, B.F., 2007. Evaluation of on-line DEMs for flood inundation modeling. Adv. Water Resour. 30 (8), pp. 1831– 1843.
Sarhadi, A., Soltani, S. and Modarres, R., 2012. Probabilistic flood inundation mapping of ungauged rivers: Linking GIS techniques and frequency analysis. Journal of Hydrology, 458, pp. 68-86.
Shi, W., Zhu, C., Tian, Y., and Nichol, J., 2005. Wavelet-based image fusion and quality assessment, International Journal of Applied Earth Observation and Geoinformation, 6, pp. 241–251.
Yang, S., Wang, M., and Jiao, L., 2012. Fusion of multispectral and panchromatic images based on support
value transform and adaptive principal component analysis, Information Fusion 13(3), pp. 177–184.