SEE-THROUGH IMAGING OF LASER-SCANNED 3D CULTURAL HERITAGE OBJECTS
BASED ON STOCHASTIC RENDERING OF LARGE-SCALE POINT CLOUDS
S. Tanakaa,∗, K. Hasegawaa, N. Okamotoa, R. Umegakia, S. Wanga, M. Uemuraa, A. Okamotob, K. Koyamadac
a
College of Information Science and Engineering, Ritsumeikan University, Kusatsu, Shiga 525-8577, Japan - (stanaka, hasegawa)@media.ritsumei.ac.jp
b
Research Institute of History, Otemae University, Nishinomiya, Hyogo 662-0965, Japan c
Academic Center for Computing and Media Studies, Kyoto University, Sakyo-ku, Kyoto 606-8501, Japan
Commission V, WG V/2
KEY WORDS: Large-Scale Laser-scanned Point Cloud, Cultural Heritage, See-through 3D Imaging, Opacity Control, Fused Visual-ization
ABSTRACT:
We propose a method for the precise 3D see-through imaging, or transparent visualization, of the large-scale and complex point clouds acquired via the laser scanning of 3D cultural heritage objects. Our method is based on a stochastic algorithm and directly uses the 3D points, which are acquired using a laser scanner, as the rendering primitives. This method achieves the correct depth feel without requiring depth sorting of the rendering primitives along the line of sight. Eliminating this need allows us to avoid long computation times when creating natural and precise 3D see-through views of laser-scanned cultural heritage objects. The opacity of each laser-scanned object is also flexibly controllable. For a laser-scanned point cloud consisting of more than107
or108
3D points, the pre-processing requires only a few minutes, and the rendering can be executed at interactive frame rates. Our method enables the creation of cumulative 3D see-through images of time-series laser-scanned data. It also offers the possibility of fused visualization for observing a laser-scanned object behind a transparent high-quality photographic image placed in the 3D scene. We demonstrate the effectiveness of our method by applying it to festival floats of high cultural value. These festival floats have complex outer and inner 3D structures and are suitable for see-through imaging.
1. INTRODUCTION
The recent rapid development of laser scanners has enabled the precise measurement of real cultural heritage objects (El-Hakim et al., 2005, Guidi et al., 2005, Ikeuchi et al., 2007b, Ikeuchi et al., 2007a, Laycock et al., 2008, Remondino et al., 2009, Koller et al., 2009, Dylla et al., 2009, Kersten et al., 2012). In such measure-ments, we acquire a large-scale point cloud that often consists of more than107 or1083D points. For example, the numbers
of 3D points acquired in our laser-scanning projects were as fol-lows: 3×10⁸
points for Khentkawes’ Tomb (Egypt),3×108
points for Machu Picchu (Peru), and9×108 points for Hagia
Sophia (Turkey).
The characteristic feature of the laser-scanned point clouds ac-quired from cultural heritage objects is the complexity of the recorded 3D shapes as well as their large size. For example, mod-ern range-sensing technology enables us to independently mea-sure both the inside and the outside of a large building and con-sistently merge both sets of data. However, conventional opaque rendering does not facilitate observing the inside and outside si-multaneously. A similar example is the measurement of the con-struction process of a 3D cultural heritage object to obtain time-series multiple point clouds (see Section 4.4 for details). By merging the measured point clouds with proper position adjust-ment, we can obtain a unified point cloud that records the whole 3D structure. However, the construction usually proceeds from the inside to the outside and from the bottom to the top, implying that the earlier-assembled parts tend to be occluded by the later-assembled parts. Thus, a method to quickly and reliably visual-ize large-scale and complex laser-scanned point clouds via see-through imaging, or transparent visualization, is urgently needed.
∗Corresponding author
For a laser-scanned point cloud, the most straightforward visu-alization strategy is point-based rendering (Sainz and Pajarola, 2004, Kobbelt and Botsch, 2004, Gross and Pfister, 2007, G¨unther et al., 2013), in which the measured 3D points are directly used as the rendering primitives. For opaque visualization, point-based rendering works quite well.
However, for transparent visualization, conventional point-based rendering encounters difficulties regarding depth. To achieve the correct depth feel, an object that is nearer to the camera position must be drawn more clearly (brightly). In conventional trans-parent visualizations, we achieve this visual effect by perform-ing depth sortperform-ing of the renderperform-ing primitives along the line of sight. The sorted primitives are drawn in the order of their depth, beginning with the farthest one. However, sorting a large num-ber of 3D points requires considerable computational time. In fact, the computational time is proportional tonptlognpt, where
npt is the number of 3D points to be sorted. For more than
108
3D points, sorting is often impractical for interactive visu-alization. Therefore, in some commercial software packages, the depth sorting step is skipped, and the depth orders of the visual-ized objects are unclear in the created images. Moreover, for a very dense point cloud, the depth-sorted orders of 3D points may become indefinite and result in rendering artifacts.
To the authors’ knowledge, no previous study has reported the transparent visualization of a large-scale laser-scanned point cloud consisting of more than107or1083D points at interactive speed
and with the correct depth feel. Here, by “interactive speed”, we mean a few fps. The transparent fused visualization of large-scale point clouds has also not previously been studied. In this paper, we achieve such visualizations. For this purpose, we introduce a stochastic algorithm that eliminates the need to perform the depth sorting of 3D points for transparent visualization.
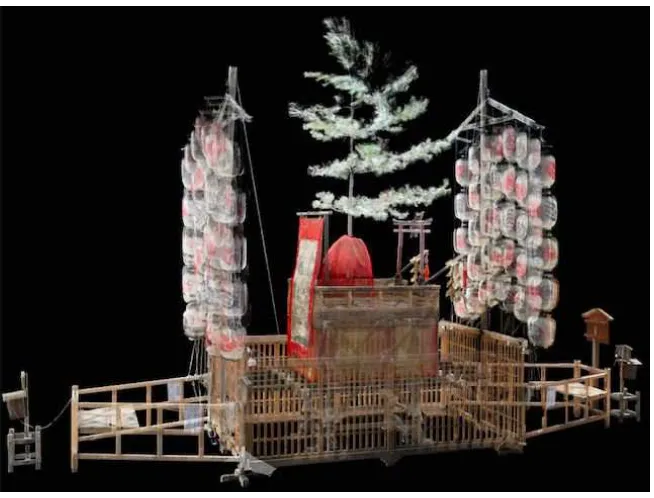
Figure 1. See-through imaging of a laser-scanned point cloud of the Hachiman-Yama float used in the Gion Festival
Figures 1 and 2 show examples of the application of our proposed method to laser-scanned point clouds of festival floats with high cultural value. The festival float shown in Figure 1 is Hachiman-Yama, and the float presented in Figure 2 isFune-Hoko. Both floats are used in the Gion Festival of Japan. A “Yama”-type float has a pine tree on its roof.
Figure 2. See-through imaging of a laser-scanned point cloud of the Fune-Hoko float used in the Gion Festival
The structure of this paper is as follows: In Section 2., we re-view the related work. In Section 3., we describe our proposed
method. In Section 4., we demonstrate our method by applying it to real laser-scanned data of cultural heritage objects. Section 5. presents the conclusions.
2. RELATED WORK
The visualization of laser-scanned point clouds has been stud-ied primarily based on opaque rendering (El-Hakim et al., 2005, Guidi et al., 2005, Ikeuchi et al., 2007b, Ikeuchi et al., 2007a, Laycock et al., 2008, Remondino et al., 2009, Koller et al., 2009, Dylla et al., 2009, Kersten et al., 2012, Shan and Toth, 2008, Her-itage and Large, 2009). However, such studies do not address the see-through imaging of 3D inner structures or the transparent fused visualization of multiple point clouds.
A pioneering approach to transparent point-based rendering is EWA (elliptical weighted average) splatting (Zwicker et al., 2002). However, this approach requires the sorting of finite-size 3D points; thus, it suffers from the long computation times and rendering ar-tifacts incurred when visualizing large-scale complex data.
3. PROPOSED METHOD
In this section, we describe our method for precise 3D see-through imaging (transparent visualization) of the large-scale complex point clouds acquired via the laser scanning of 3D cultural her-itage objects. In our method, the transparency originates from the stochastic determination of pixel intensities. This stochastic algorithm achieves the correct depth feel without requiring depth sorting the 3D points. Our method can be considered an extension of stochastic point-based rendering (Tanaka et al., 2012), which was developed for implicit surfaces and is not directly applicable to point clouds.
In Section 3.1, we explain our theory of the stochastic point-based realization of transparency. Then, in Section 3.2, we explain how to apply the theory to a laser-scanned point cloud. Finally, in Section 3.3, we explain how to perform the transparent fused vi-sualization of multiple laser-scanned point clouds.
3.1 Stochastic Point-based Realization of Transparency
Here, we explain how to realize the transparency of a surface defined as a high-density uniform point cloud using our stochastic algorithm.
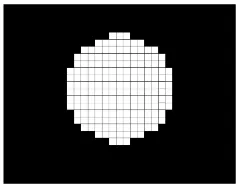
We consider an arbitrary small local surface segment of areaSon the surface (see Figure 3). We presume that this surface segment can be approximated as a flat plane and is parallel to the image plane. Letnbe the number of 3D points that are distributed uni-formly within the surface segment, and letN be the number of pixels contained in the image of the segment. That is, each 3D point within the segment is projected onto one of theseNpixels on the image plane. To each 3D point, we assign a cross sections, which is tuned such that its image overlaps only one pixel. Then, Nis related toSandsas follows:N=S/s.
Figure 3. Schematic illustration of a local surface element (white circle). The small squares represent the pixels in the image of the surface segment.
Let us focus on an arbitrary pixel from among theseNpixels. For the pixel of interest, let us consider the number of projected 3D points,x. Note thatxis an integer-valued random variable in the range0≤x≤n. Because of the assumed uniformity, the prob-ability that a 3D point on the surface segment is projected onto this pixel is1/N. Then,xshould obey the following probabil-ity function in the form of the binomial distribution, B(n,1/N): p(x) = (n!/x!(n−x)!)(1/N)x
(1−1/N)n−x
. Therefore, the probability that at least one 3D point is projected onto the pixel of interest is
Thisαis the probability that the pixel of interest is assigned the color of a point, i.e., the color of the surface segment. Conversely, 1−α=p(0)is the probability that the color of the pixel remains
identical to the background color. Thus, theαof (1) functions as the opacity. Because the pixel selection is arbitrary, thisαis also the opacity of the entire surface segment.
Then, based on formula (1), the 3D see-though image of the sur-face is created as follows:
• STEP 1: Prepare multiple uniform point clouds, each of which describes the surface equivalently but is statistically independent. Each point cloud should have the same point density and its arbitrary local surface segment with areaS includesn3D points. Below, we denote the number of point clouds byL.
• STEP 2: For each point cloud, project its constituent 3D points onto the image plane to create an intermediate image. In the projection process, we consider the point occlusion per pixel. A total ofLintermediate images are obtained.
• STEP 3: Average theLintermediate images to create the fi-nal transparent image. (Because the number of the averaged intermediate images isL,Lis available as the image-quality parameter.)
The created 3D image exhibits the opacity αgiven by (1) for the visualized surface in the portions parallel to the image plane. Note that the three steps listed above do not include any process-ing for depth sortprocess-ing.
We can consider the opacity of a local surface segment that is not parallel to the image plane in a similar manner. If the angle formed by a local surface segment with the image plane isθ, then the surface opacity of the segment becomes
α(θ) = 1−
because the image size of the segment is reduced by a factor of cosθcompared with the parallel case. Formula (2) implies that a local surface segment that is more slanted with respect to the image plane appears more opaque; this phenomenon manifests in rendering as a shading effect. This shading effect works well even for surface data in which no surface normals are provided. This shading effect can also be easily switched off by replacing the cross sectionsof a point withscosθto make it view dependent.
Here, we comment on the meaning of formula (1). For small n, that is, smallα, the right-hand side is approximated by the following:
α≃ns
S . (3)
This is the ratio of the total point cross sectionnsto the local surface segment areaS. This ratio is merely the probability that the image of the surface segment becomes the point color, if re-dundant projection to the same pixels does not occur.
We also comment on how to set the point cross sections. As mentioned above, s is tuned such that its image overlaps one pixel. Therefore, for a user, it is more convenient to indirectly controlsthrough image resolution. Additionally, in perspective projection, we makeslarger for a 3D point that is closer to the camera and smaller for a 3D point that is farther from the camera based on a standard size determined at the bounding-box center of the visualized objects. We can achieve interactive zooming by updating the sizes ofsaccording to the current camera position.
3.2 Application to a Laser-scanned Point Cloud
We apply the theory of stochastic point-based transparency de-scribed above to a laser-scanned point cloud, that is, a set of laser-scanned 3D points. To this end, we must apply two types of pre-processing before executing the three steps listed in Sec-tion 3.1: (1) the preparaSec-tion ofLstatistically independent point clouds from the given set of laser-scanned 3D points and (2) the adjustment of the number of 3D points for each prepared point cloud based on a user-defined value ofα. We explain (1) in Sec-tion 3.2.1 and (2) in SecSec-tion 3.2.2.
To perform the pre-processing, we assume that the laser-scanned 3D points are distributed uniformly. In many cases, this is a good approximation for modern laser-scanned data. Even in the non-uniform case, theαof formula (1) can still be interpreted as the average opacity.
3.2.1 Preparation of Statistically Independent Point Clouds from a Given Set of Laser-scanned 3D Points: To execute the three steps described in Section 3.1, we requireLstatistically in-dependent point clouds. However, we possess only one set of laser-scanned 3D points for each record of, for example, a cul-tural heritage object. Fortunately, modern laser-scanning technol-ogy generates very dense 3D points. Therefore, we can prepare Lpoint clouds by randomly dividing a given set of 3D points into Lsubsets as follows:
1. Choose a user-defined value of the opacityαto be realized and calculate the value ofncorresponding to thisαvalue using formula (1). Further, choose a user-defined value ofL to control the statistical quality of the final image.
2. Consider a sufficiently small hypothetical sphere that is cen-tered at one of the given laser-scanned 3D points. (We can select any arbitrary 3D point as the center because of the uniformity of the distribution.) Its great circle, which best approximates the 3D points contained in the sphere, is de-fined as the local surface segment of interest. The area of the great circle becomes the segment areaS. (In our im-plementation, we set the radius of the sphere to1/50of the diagonal length of the bounding box of the 3D points.)
3. Count the number of 3D points,nraw, inS for the given
set of laser-scanned 3D points. (In our implementation, we prepare1000spheres by randomly choosing centers from among the 3D points. Thenrawvalues calculated for these
spheres are averaged and used as the final value.)
4. Calculatenraw/Land compare the result with the value of
nobtained in 1. Then, executepoint-number adjustment, which is explained in Section 3.2.2, for the initial laser-scanned 3D points. After the adjustment, the number of 3D points inSbecomesnL.
5. Randomly divide the adjusted laser-scanned 3D points into Lpoint clouds, each of which has the same number of 3D points,n, inS.
After executing the above five steps, we obtainLstatistically in-dependent point clouds, each of which has the proper number of 3D points,n, in S, corresponding to the user-defined value of opacityαbased on formula (1).
The above five steps work as STEP 1 defined in Section 3.1. Then, by applying STEP 2 and STEP 3 to theLpoint clouds thus obtained, we can create a see-through image of the laser-scanned
surface with the correct opacityα. Note that this opacity is real-ized only for surface areas parallel to the image plane. For surface areas that are not parallel to the image plane, the opacities are au-tomatically increased according to formula (2), unless the point cross sectionsis modified to be view dependent. As explained in Section 3.1, this opacity gradation can help to achieve a natural shading effect, even for laser-scanned data without information regarding the surface normals.
3.2.2 Point-number Adjustment: Here, we explain how to properly increase or decrease the number of points in the origi-nal laser-scanned data such that the number of 3D points inSis adjusted fromnraw tonLwith the correctn. This increase or
decrease is applied to the data as a whole. Because of the dis-tributional uniformity, the same point-number adjustment ratio is achieved:
k= nL nraw
, (4)
for any local surface area.
The adjustment, which is executed differently for the cases of k >1andk <1, is performed as follows:
• CASE 1: Ifk <1, that is, if the number of 3D points inSis too large in the original laser-scanned data, we randomly se-lect the appropriate number of 3D points and remove them.
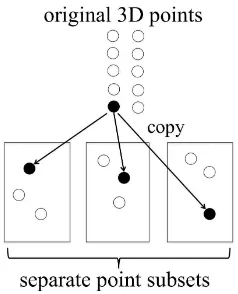
• CASE 2: Ifk >1, that is, if the number of 3D points in S is too small in the original laser-scanned data, we must increase the number of 3D points. For the accurate digital preservation of cultural heritage objects, we should avoid adding extra 3D points that are not included in the raw data. Therefore, we randomly select a suitable number of 3D points from the raw data and simply create the necessary number of copies. IfL is sufficiently large, it is quite likely that each copy will belong to a different point cloud (see Fig-ure 4). Therefore, the copies can persist as independent 3D points and will not be eliminated by the point occlusion pro-cess, which is executed for each point cloud independently. Typically, we setLequal to a few or several hundred.
Figure 4. Schematic illustration of the point proliferation by copying the original laser-scanned 3D points. Each copied 3D point belongs to a separate point subset with a high probability whenLis sufficiently large.
To verify the point-number adjustment described above, we con-ducted experiments to investigate its effects on the pixel inten-sities of the created images. We created 3D see-through images of a white plane with a black background for various user-defined values ofα. The visualized plane was placed parallel to the image plane. For input data, we generatednraw3D points via uniform
The experimental results are summarized in Figure 5. The aver-age pixel intensities of the created imaver-ages are shown for various values ofα. The top graph is fornraw = 1.0×10⁷, and the
bottom graph is fornraw= 4.0×10⁷. We observe that the pixel
intensities coincide well with the theoretical value of255α(solid lines). The agreement is maintained even for large values of the adjustment ratiok. The error bars show the standard deviations, and we can see that the errors are smaller when the value ofnraw
is larger.
nraw= 1.0×10⁷
nraw= 4.0×10⁷
Figure 5. Pixel intensities for various values ofαwhen visualiz-ing a white plane with a black background. Lis1000, and the image resolution is5122
. The solid lines show the theoretical values.
3.3 Fused Visualization of Multiple Point Clouds
Our method is also suitable for the transparent fused visualiza-tion of multiple point clouds. Such visualizavisualiza-tion becomes possi-ble only by merging the constituent point clouds after the point-number adjustment procedure (see Section 3.2.2) is applied to each constituent point cloud if necessary:
1. Choose a user-defined value of the opacityαfor each con-stituent point cloud.
2. Apply the point-number adjustment procedure to each con-stituent point cloud to realize the chosenαvalue.
3. Merge the adjusted point clouds to create a unified point cloud and perform the three steps described in Section 3.1.
By assigning higher opacity values to some constituent point clouds, we can display the corresponding laser-scanned objects in clearer focus than the others.
4. RESULTS
In this section, we demonstrate the effectiveness of our proposed method by reporting the results of case studies performed using real laser-scanned point clouds.
4.1 Visualized Cultural Heritage Objects
We apply our method to creation of 3D see-through images of two festival floats used in theGion Festival. The Gion Festival is one of the most famous festivals in Japan. Its origin dates to the year 869, when it was instituted as a religious ceremony to appease the gods during the outbreak of an epidemic. The festi-val occurs annually in Kyoto City and spans the entire month of July. The highlight of the festival is the Yama-Hoko Junko, which consists of parades of beautifully decorated festival floats in mid-July. The festival floats have complex 3D inner structures. Each year, they are reconstructed from hundreds of member compo-nents, which are preserved in storehouses during the off-season. The reconstruction processes also represent important intangible cultural heritage.
Among the 33 total festival floats that appear in the parades, we visualize two famous floats: theHachiman-Yama float(Figure 1) and theFune-Hoko float(Figure 2).
4.2 Realization of Correct Depth Feel
Figures 1 and 2, which are 3D see-through images created by our method, show that both the inner and outer 3D structures of the festival floats are clearly visualized with natural depth feel.
Figure 6 presents see-through images of the Hachiman-Yama float looking down from above. Figure 6 (top) was created by our method, whereas Figure 6 (bottom) was created by the commonly used quick transparent point-based rendering method, in which the colors of the projected 3D points are simply averaged at each pixel. From this viewing position, as Figure 1 suggests, we should be able to see the pine tree in front of the wooden structures behind it. This situation is correctly achieved in the top image, whereas the bottom image fails to show the correct positional in-formation.
4.3 Opacity Tuning
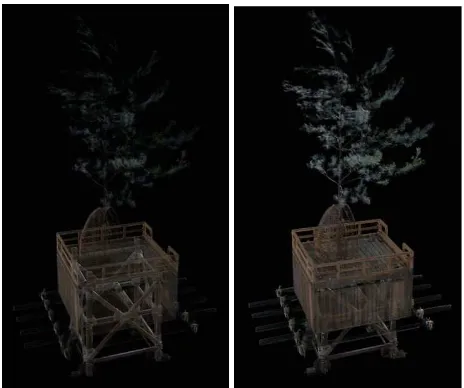
Figure 7 shows examples of tuning opacities in the transparent fused visualization, which we explained in Section 3.3, for the core part of the Hachiman-Yama float.
In Figure 7, the inner portion, which is constructed by combining the wooden pieces in a complex arrangement, was laser scanned on the first day of the construction. Then, the outer box-shaped portion was laser scanned on the next day. Both laser-scanned point clouds are transparently fused as described in Section 3.3. Figure 7 (left) was used to observe the inner portion by assigning small opacity to the outer portion. In contrast, Figure 7 (right), in which larger opacity is assigned to the outer portion, is focused on the outer shape.
(Image created by our method)
(Image created by simply averaging colors of projected 3D points at each pixel)
Figure 6. See-through images of the Hachiman-Yama float look-ing down from above. The top image was created by our method, and the bottom image was obtained by the commonly used quick transparent point-based rendering method, in which the colors of the projected 3D points are simply averaged at each pixel.
Figure 7. Assignment of different opacities to constituent point clouds in the transparent fused visualization. For the outer box-shaped portion,αis0.05(small) in the left image, andαis0.2 (larger) in the right image. For the inner portion, αis0.8in both images. The left image is suitable for observing the inner structure, whereas the right image is suitable for visualizing the outer shape.
4.4 Cumulative Fused Visualizations of Time-series Data
Figure 8 is an example of the cumulative fused visualizations of time-series data. As previously explained, the festival floats of the Gion Festival are reconstructed from their member components
each year. This reconstruction process also represents intangible cultural heritage. The reconstruction requires three days. We per-formed laser scanning each morning during and after the recon-struction period. As the reconrecon-struction progresses, each acquired point cloud is cumulatively fused and visualized as described in Section 3.3. Roughly speaking, the reconstruction proceeds from the inside to the outside and from the bottom to the top, implying that the earlier-assembled parts tend to be occluded by the later-assembled parts. Therefore, a transparent visualization method that enables us to see through all the assembled member compo-nents is needed. Visualization such as that shown in Figure 8 is suitable for this purpose.
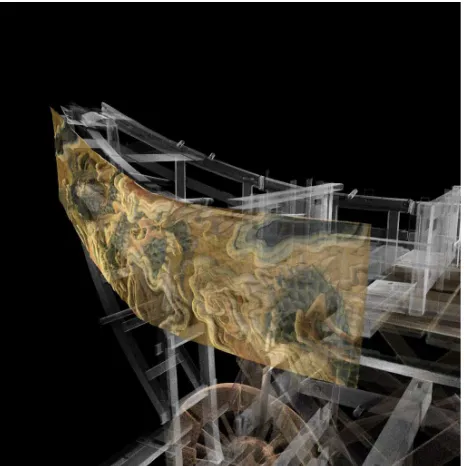
4.5 Transparent Fused Visualization of a High-resolution 2D Photo Image
As an advanced application of transparent fused visualization, we consider the fusion of a digitally archived high-resolution 2D photo image of a tapestry into the laser-scanned 3D festival float.
The Fune-Hoko float is known for its beautiful woolen tapestries. Recently, high-resolution photo images of these tapestries were archived (Wakita et al., 2012). To facilitate studying these tapestries in relation to the main body of the float, we created a transparent photo image of the famous tapestryShimo-Mizu-Hikiand placed it at the correct 3D position in front of the main body of the float. The result is shown in Figure 9, which allows us to see the frames of the float in the background of the tapestry. The resolution of the fused 2D photo image is39348×8857pixels. Information on the concavity and convexity of the tapestry is also incorporated based on laser scanning.
Let us explain the process of creating Figure 9 in greater de-tail. We consider the photo image to be a rectangular plane in 3D space. Because the image resolution is high, we can regard the pixels as dense 3D points. The photo image is converted to a point cloud as follows:
1. Regard the pixels of the photo image as colored 3D points.
2. At each pixel, create a height map of the tapestry, which comprises 2D regular-grid data of the local heights, based on the laser-scanned data of the tapestry.
3. Create a normal-vector map by numerically differentiating the height map.
4. According to the height map, move each 3D point prepared in step 1 above by its height in the direction normal to the photo image in 3D space.
5. Execute the point proliferation by copying (see Section 3.2.2) each shifted 3D point by1/cosφ. Here,φ is the angle between the surface normal vector of the flat photo image in 3D space and the local normal vector determined by the normal-vector map.
• This point proliferation complements the decrease in the point density that occurs when moving the 3D points.
• In general,1/cosφis a real number. For the decimal part, the copying is executed probabilistically. For ex-ample, if1/cosφ= 2.4, the 3D point is copied and increased by2and further increased with a probability 0.4.
Figure 8. Cumulative fused visualizations based on time-series data acquired during and after the reconstruction process. The acquired point clouds are fused cumulatively and accumulated.
4.6 Performance
In this work, the computations were executed on a Linux PC with an Intel Core i7-5960X (3.00 GHz, 64 GB of memory) CPU and
Figure 9. Transparent fused visualization of a high-resolution photo image of the famous woolen tapestry Shimo-Mizu-Hiki
with the frames of the Fune-Hoko float in the background. In-formation on the concavity and convexity of the tapestry is also incorporated based on laser scanning.
an NVIDIA GeForce GTX TITAN X (12 GB of memory) GPU. We confirmed that this PC could handle (several)×109
3D points. (We also confirmed that108
3D points could be rendered using a notebook PC with a 3.07 GHz Intel Core i7 processor, 8 GB of memory and an NVIDIA GeForce GT 480M GPU.)
The pre-processing stage (the 5 steps described in Section 3.2.1) and the rendering stage (the 3 steps described in Section 3.1) were executed via CPU- and GPU-based computations, respectively. The pre-processing stage required less than a few minutes, and the rendering stage could be executed at interactive frame rates. More detailed data for the creation of Figures 1 and 2 are sum-marized in Table 1.
image Figure 1 Figure 2
α 0.20 0.25
L 500 500
image resolution 10242 10242
original number 2.62×10⁸ 2.54×10⁷
of 3D points
adjusted number 4.29×10⁸ 5.28×10⁸
of 3D points
k 1.64 20.8
Time for point-number 58.4[sec] 80.7[sec] adjustment
FPS 3.55 1.62
Table 1. Detailed computational data for the creation of Figures 1 and 2.
5. CONCLUSIONS
In this paper, we proposed a method for the transparent visual-ization of large-scale laser-scanned point clouds acquired from 3D cultural heritage objects. This method enables quick and reli-able 3D see-through imaging and flexible transparent fused visu-alization. In our method, the laser-scanned 3D points are directly
used as the rendering primitives after the execution of a point-number adjustment procedure in which no additional 3D points are added to the raw data. The transparency originates from the stochastic determination of the pixel intensities. For a large-scale point cloud consisting of more than107 or108 3D points, the
pre-processing stage requires less than a few minutes, and the rendering stage can be executed at interactive frame rates.
We demonstrated the effectiveness of the proposed method via case studies of the visualization of festival floats with high cul-tural value. The complex inner 3D structures of the floats were clearly visualized in precise see-through images. We also pre-sented the see-through imaging to observe the construction pro-cess of these festival floats, thereby demonstrating the effective-ness of our method for time-series laser-scanned data. Addition-ally, we showed that transparent fused visualization is useful for the simultaneous visualization of laser-scanned data and high-resolution photo images.
The limitation of our method is that the memory consumption in-creases as the point-number adjustment ratiokand, consequently, the opacityαbecome large. For large values ofk, it may be nec-essary to reduce either the image resolution or the image-quality parameterL. Nevertheless, the simplest method of using a raw laser-scanned point cloud withk = 1is possible and useful for most modern laser-scanned point clouds. In fact, our method en-ables rapid on-site interactive visualization, in which the process-ing stage is skipped. Moreover, in many cases, modern laser-scanning measurements produce such dense 3D point data that a smallkis sufficient. For example, Figure 1 was created with k = 1.64. Currently, we are working to further generalize our method to enable local adaptive tuning of the opacity. This gen-eralization should also reduce the algorithm’s memory consump-tion.
Software, in which our method is implemented, will be available for download in https://github.com/stanakarits/SPBR soon.
ACKNOWLEDGEMENTS
In this paper, images of the Fune-hoko float are presented with the permission of the Fune-Hoko Preservation Society. Additionally, images of the Hachiman-Yama float are presented with the per-mission of the Hachiman-yama Preservation Society. We thank both societies for their generous cooperation. We would also like to thank Prof. R. Lindenbergh, Prof. K. Yano, Prof. H. T. Tanaka, Prof. R. Xu, and Dr. H. Sato for their valuable advice. This work was partially supported by JSPS KAKENHI Grant Num-ber 25280044.
REFERENCES
Dylla, K., Frischer, B., Mueller, P., Ulmer, A. and Haegler, S., 2009. Rome reborn 2.0: A case study of virtual city reconstruc-tion using procedural modeling techniques. In:Proc. CAA 2009, pp. 62–66.
El-Hakim, S. F., Beraldin, J.-A., Gonzo, L., Whiting, E., Jemtrud, M. and Valzano, V., 2005. A hierarchical 3d reconstruction ap-proach for documenting complex heritage sites. In: Proc. CIPA XX International Symposium, pp. 790–795.
Gross, M. H. and Pfister, H. (eds), 2007. Point-Based Graphics. Series in Computer Graphics. Morgan Kaufmann Publishers.
Guidi, G., Frischer, B., Simone, M. D., Cioci, A., Spinetti, A., Carosso, L., Micoli, L. L., Russo, M. and Grasso, T., 2005. Vir-tualizing ancient rome: 3d acquisition and modeling of a large plaster-of-paris model of imperial rome. In: Proc. SPIE 5665, Vol. Videometrics VIII, pp. 119–133.
G¨unther, C., Kanzok, T., Linsen, L. and Rosenthal, P., 2013. A GPGPU-based pipeline for accelerated rendering of point clouds.
Journal of WSCG21(2), pp. 153–161.
Heritage, G. and Large, A. (eds), 2009. Laser Scanning for the Environmental Sciences. Wiley-Blackwell.
Ikeuchi, K., Oishi, T. and Takamatsu, J., 2007a. Digital Bayon temple — e-monumentalization of large-scale cultural-heritage objects —. In:Proc. ASIAGRAPH 2007, Vol. 1(2), pp. 99–106.
Ikeuchi, K., Oishi, T., Takamatsu, J., Sagawa, R., Nakazawa, A., Kurazume, R., Nishino, K., Kamakura, M. and Okamoto, Y., 2007b. The great buddha project:digitally archiving, restoring, and analyzing cultureal heritage objects.International Journal of Computer Vision75(1), pp. 189–208.
Kersten, T. P., Keller, F., Saenger, J. and Schiewe, J., 2012. Auto-mated generation of an historic 4d city model of hamburg and its visualisation with the GE engine. In: Progress in Cultural Her-itage Preservation(Lecture Notes in Computer Science 7616), pp. 55–65.
Kobbelt, L. and Botsch, M., 2004. A survey of point-based techniques in computer graphics. Computers & Graphics28(6), pp. 801–814.
Koller, D., Frischer, B. and Humphreys, G., 2009. Research chal-lenges for digital archives of 3d cultural heritage models. ACM Journal on Computing and Cultural Heritage. Article No.7.
Laycock, R. G., Drinkwater, D. and Day, A. M., 2008. Exploring cultural heritage sites through space and time. ACM Journal on Computing and Cultural Heritage. Article No.11.
Remondino, F., Girardi, S., Rizzi, A. and Gonzo, L., 2009. 3d modeling of complex and detailed cultural heritage using multi-resolution data. ACM Journal on Computing and Cultural Her-itage. Article No.2.
Sainz, M. and Pajarola, R., 2004. Point-based rendering tech-niques. Computers & Graphics28(6), pp. 869–879.
Shan, J. and Toth, C. K. (eds), 2008.Topographic Laser Ranging and Scanning: Principles and Processing. CRC Press.
Tanaka, S., Hasegawa, K., Shimokubo, Y., Kaneko, T., Kawa-mura, T., Nakata, S., Ojima, S., Sakamoto, N., Tanaka, H. T. and Koyamada, K., 2012. Particle-based transparent rendering of im-plicit surfaces and its application to fused visualization. In:Proc. EuroVis 2012(short paper), pp. 25–29.
Wakita, W., Tsuchida, M., Tanaka, S., Kawanishi, T., Kashino, K., Yamato, J. and Tanaka, H. T., 2012. High-resolution and multi-spectral capturing for digital archiving of large 3d woven cultural artifacts. In:Proc. 11th Asian Conference on Computer Vision (ACCV 2012).
Zhang, Y. and Pajarola, R., 2006. Single-pass point rendering and transparent shading. In: Proc. Eurographics/IEEE VGTC Symposium on Point-Based Graphics, pp. 37–48.
Zhang, Y. and Pajarola, R., 2007. Image composition for single-pass point rendering.Computers & Graphics31(2), pp. 175–189.