THE EFFECT OF WIND ON TREE STEM PARAMETER ESTIMATION USING
TERRESTRIAL LASER SCANNING
M. T. Vaaja *,a, J.-P. Virtanen a, M. Kurkela a, V. Lehtola a, b, J. Hyyppä b, H. Hyyppä a, c
a School of Engineering, Aalto University, Centre of Excellence in Laser Scanning Research (CoE-LaSR), Finland – [email protected], [email protected], [email protected], [email protected], [email protected]
b Finnish Geospatial Research Institute (FGI), Centre of Excellence in Laser Scanning Research (CoE-LaSR), Finland – [email protected]
c Built Environment Hubic, Helsinki Metropolia University of Applied Sciences, Finland
Commission VIII, WG VIII/7
KEY WORDS: Terrestrial Laser Scanning, Wind, Tree Reconstruction, Stem Diameter, Stem Location, Pine
ABSTRACT:
The 3D measurement technique of terrestrial laser scanning (TLS) in forest inventories has shown great potential for improving the accuracy and efficiency of both individual tree and plot level data collection. However, the effect of wind has been poorly estimated in the error analysis of TLS tree measurements although it causes varying deformations to the trees. In this paper, we evaluated the effect of wind on tree stem parameter estimation at different heights using TLS. The data consists of one measured Scots pine captured from three different scanning directions with two different scanning resolutions, 6.3 mm and 3.1 mm at 10 m. The measurements were conducted under two different wind speeds, approximately 3 m/s and 9 m/s, as recorded by a nearby weather station of the Finnish Meteorological Institute. Our results show that the wind may cause both the underestimation and overestimation of tree diameter when using TLS. The duration of the scanning is found to have an impact for the measured shape of the tree stem under 9 m/s wind conditions. The results also indicate that a 9 m/s wind does not have a significant effect on the stem parameters of the lower part of a tree (<28% of the tree height). However, as the results imply, the wind conditions should be taken into account more comprehensively in analysis of TLS tree measurements, especially if multiple scans from different positions are registered together. In addition, TLS could potentially be applied to indirectly measure wind speed by observing the tree stem movement.
1. INTRODUCTION
Tree models and information on the various characteristics of trees and forests (Hyyppä et al., 2009; Hyyppä and Hyyppä, 2001) are required for city models (Virtanen et al., 2015) and the management of assets in urban and natural environments (see e.g. Vanier, 2001). Single tree shapes are deformed under wind loads, especially in urban areas where the trees are not protected by surrounding forest.The wind-induced stem deformation perturbs the shape and orientation of these trees, which is relevant in most analyses and, for example, outdoor simultaneous localization and mapping applications.
Terrestrial laser scanning (TLS) has proven to be a suitable method for obtaining very detailed data of tree geometry in a natural environment. From the dense point clouds obtained with laser scanning techniques, various analyses can be performed to extract tree parameters. Commonly these parameters include the diameter at breast height, location, tree height, biomass and stem curve (e.g. Hopkinson et al., 2004; Pfeifer and Winterhalder, 2004; Watt and Donoghue, 2005; Tansey et al., 2009; Holopainen et al., 2011; Liang et al., 2011 and 2012; Kankare et al., 2013). Laser scanning point clouds also provide information on canopy-related characteristics and more complicated analyses can also be performed, including detailed tree model reconstruction (e.g. Raumonen et al., 2013). Tree detection accuracies for TLS have been presented (e.g. by Maas et al., 2008; Liang et al., 2012). In a similar manner, mobile laser scanning (MLS) can be applied to cover larger areas more efficiently. The results of MLS’s application for the detection of trees or pole-like objects have been presented (e.g. by Jaakkola et al., 2010; Lehtomäki et al.,
2010; Rutzinger et al., 2010; Kaartinen et al., 2013; Liang et al., 2014). Holopainen et al. (2013) compare the accuracy and efficiency of airborne laser scanning (ALS), TLS and MLS measurements in tree mapping in heterogeneous park forests. They concluded that the accuracies of TLS and ALS were applicable for operational urban tree mapping.
The dynamic response of trees to wind load is an active topic of research, as it is related to predicting the impacts of storms and potentially estimating the amount of damage inflicted by winds on forest stands. Several parameters affect the wind-induced sway of a tree, related both to the properties of the individual tree and its interaction with other nearby trees (Schönborn et al., 2009). The extent of forest damage caused by strong winds is dependent on several parameters, such as the density and openness of the stand, the terrain and external factors, such as snow loading (Pellikka and Järvenpää, 2003). Several vibrational modes can be found from trees when subject to wind load (Schindler et al., 2010). For monopodial coniferous trees, the dominant dynamic response to wind load is the bending of the entire stem (Mayer, 1987), which is the first mode of the tree’s vibration. In other words, the largest displacements caused by the wind occur in the form of the entire stem bending in the wind. The frequencies of this first order vibration for three individual Scots pines (Pinus sylvestris) were found to be in the range of 0.29 Hz to 0.34 Hz (Schindler et al., 2010).
use of TLS but may cause temporary and varying deformations to the trees being scanned. In particular, slight winds may be difficult to notice in dense forest environments. Nevertheless, they may affect the tallest trees. The movement of the trees during the scanning has been mentioned in error analysis (e.g. Krooks et al., 2014) but the movement of the tree stem under different wind conditions during TLS measurements has not been estimated before.
In this article, we present the first results of studying the effect of varying wind conditions on tree stem estimation performed from TLS point clouds. Our analysis includes the estimation of the tree stem diameter, the distance distribution of points from the centre point of a fitted circle and the location distribution of the centre point of the fitted circle for a multi-scan based on three different scans. These three parameters were calculated along the tree stem in 0.5 m increments.
2. MATERIAL AND METHODS
2.1 The Laser Scanning of Trees Under Different Wind Conditions
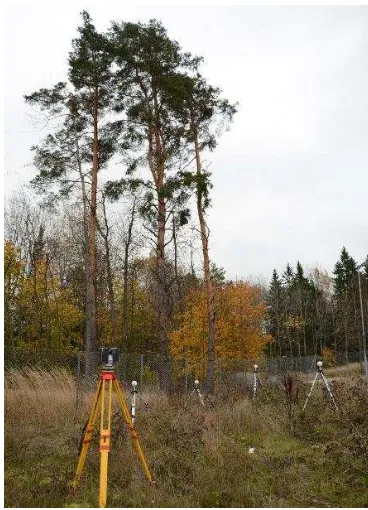
The selected test site was located in Otaniemi, Espoo, Finland, in a semi-urban setting next to a parking facility. The tree used for the experiments was a pine (Pinus sylvestris) set in a small group of pines with a height of approximately 18 m (see figure 1 and 2). The group of pines was scanned under two different wind conditions, with the wind speeds being approximately 3 m/s with 4 m/s gusts and 9 m/s, with 14 m/s gusts, as recorded by a nearby weather station of the Finnish Meteorological Institute. A Faro Focus 3D terrestrial laser scanner was used as the measuring instrument. It is a 905 nm phase-based continuous-wave laser scanner with a 360° × 305° field of view. The circular beam diameter at the exit is 3 mm. The distance measurement accuracy is ±2 mm at a distance of 25 m (Chow et al., 2012).
Figure 1. A photo from the site showing the pines and the measuring instrument used. The pine used in the analysis was the one on the right.
Three measurement approaches have been reported for TLS-based forest inventories: the single-scan approach, the multi-scan approach and the multi-single-scan approach (Liang et al., 2016). In the single-scan mode, the laser scanner is placed at the plot centre, creating one full field-of-view scan, and the trees are then mapped from this single-scan point cloud. In the multi-scan mode, several scans are made simultaneously inside and outside the plot covering the same trees, these scans are then accurately co-registered and the trees are mapped from this merged multi-scan point cloud.
Under both wind conditions, the pines were measured from three measuring positions using two different scan resolutions with point spacing at a range of 10 m being 6.3 mm and 3.1 mm. The distances between scanning stations and the measured tree varied between 12 and 18 m. The scanner measures the environment with vertical profiles when the scanning time affected the shape of the scanned stem, in particular, under 9 m/s wind conditions. For the lower resolution (6.3 mm at 10 m range) the scanning time of the measured pine stem at breast height was 0.3–0.5 s and for the higher resolution (3.1 mm at 10 m range) it was 0.8–1.2 s. Spherical reference targets were used to co-register the scans. Features identified from the environment, such as fence posts, were used to co-register the data sets from different wind speeds (obtained on separate occasions) in the multi-scan. Data from one of the trees was used in further analysis. In addition to the TLS, the trees were photographed with a Nikon D-SRL camera D7200 (figure 2).
2.2 Analysis of the Tree Stem at Different Height Segments
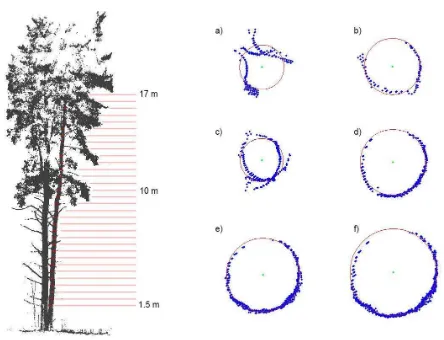
For the analysis, segments of point clouds from different heights along the stem were obtained from the tree stem. The segments were positioned at 1.5 to 17 m heights above the ground surface along the tree stem in 0.5 m increments (figure 3). A segment height of 5 cm was used. The segments were manually cleaned to only contain points belonging to the tree stem. If the stem could not be found (e.g. in top of the crown) the segment was omitted from analyses. After this, a two-dimensional circle fitting, using the Kasa method implemented by Bucher (Kåsa, 1976; Bucher, 2004) from orthographic top projection, was performed on the segments. The found centre point, radius and distance distribution of points from the centre point were recorded for each segment.
The described analysis was, for both wind speeds, separately performed to yield the following: a single-scan point cloud of low scan resolution, a single-scan point cloud of high resolution and a multi-scan point cloud produced by combining low resolution scans from three different scan locations.
Figure 3. Left: The measured pine stem was segmented into 0.5 m increments. The segments are shown in red. In a), c) and e) the two-dimensional circle is fitted to a segmented point cloud combined from three different low resolution scans (a multi-scan) under 9 m/s wind at 2, 8 and 14 m heights from orthographic top projection. Images b), d) and f) are the
corresponding results for circle fittings under 3 m/s wind conditions. Case a) shows a case where wind speed totally distort the multi-scan point cloud.
3. RESULTS
3.1 Estimation of the Stem Diameter
The estimation of the tree stem diameter was performed for both wind speeds (3 m/s and 9 m/s) separately to yield the following: a single-scan point cloud of a low resolution scan, a single-scan point cloud of a high resolution scan and a low resolution multi-scan where the diameter was estimated from the point cloud of three registered scans that were measured from different directions (figure 4).
Figure 4. The stem diameter found using circular fittings on different heights under 3 m/s and 9 m/s winds.
3.2 Estimation of the Stem Point Distribution
The estimation of the tree stem point distribution was performed for the same point clouds and wind speeds as for the stem diameter (figure 4). The stem point distribution was calculated for each segment height and the output was a standard deviation of the distances between stem points and the centre of the fitted circle. The results show that the standard deviations were uniform under 3 m/s wind speed. The results under 9 m/s wind speed show that the low and high resolution single scans were uniform but that the standard deviation of the multi-scans differs over 5 m segment heights.
Figure 5. The standard deviation of points from the centre point of the fitted circle at different heights under 3 m/s and 9 m/s wind conditions.
3.3 Estimation of the Stem Location Distribution
The estimation of the tree stem location distribution was performed for both wind speeds: 3 m/s and 9 m/s (figure 5). The location distribution was calculated as the average distance between the centre points of the fitted circles at different segment heights for three scans measured from different directions. Hence, the stem location distribution indicates the movement of the tree stem at different heights. The results show that the stem location distribution increases from 5 m above the ground under 9 m/s wind conditions. At under 3.5 m above the ground the stem location was similar for both wind speeds. At 15 m tree height the stem movement was over 0.2 m under 9 m/s wind load.
Figure 6. The average distance between the centre points of the fitted circles for three scans at different segment heights under 3 and 9 m/s wind conditions.
4. DISCUSSION
half 1/f (1.5 to 1.7 s). As the measuring times of the tree stem in our study were 0.3–0.5 s for the low resolution scan and 0.8–1.2 s for the high resolution scan, we can see that in the worst case scenario the tree stem could experience near maximal deformation from one extreme to another during a single high resolution scan if the scan occurs precisely during the travel of the tree stem from one extreme to another. For the low resolution scan, the vibrating tree stem would only have time to travel a shorter distance. Our observations correlate with this. However, as the temporal location of the measuring event during the vibration is unknown, the amount of deformation experienced by the tree during the scanning cannot be accurately determined. In addition, the trees exhibit a number of other vibrational nodes; both how wind gusts and surrounding trees can affect movement and the impact of root and soil conditions are unknown (Schindler et al. 2010). Secondly, we cannot verify that the Scots pine used in the measurements has similar vibration characteristics as those observed by Schindler et al. (2010).
Looking at the results, we can observe that the estimations under 3 m/s wind speed showed that there was no significant difference between low and high resolution single scans when estimating the stem diameter and stem points distribution. The results under 3 m/s wind speed only indicated that the multi-scans (combined) had systematically 2–3 cm higher diameter estimation than individual scans. The results of 9 m/s wind speed conditions clearly showed that the movement of the tree affected all estimated parameters. In particular, the standard deviation of the stem points of multi-scans increases in higher wind conditions and towards the upper parts of the stem. This is due to stem movement during the measuring and in between consecutive scans. The same effect can be seen in the erroneous increase of diameter towards the crown in strong wind conditions (figure 3) and in the higher stem locations’ distribution. The slight increase of standard deviation in the lowest sample position is apparently due to the tree stem not being entirely circular at that height. However, the estimations of stem diameter, stem point distribution and stem location under 9 m/s wind were nearly the same for segments under 5 m from the ground (<28% of the tree height). The estimation of the tree’s top segments (15 m and above) was not possible due to poor detection of any circular stem in the upper parts of the tree crown.
Stem vibrations and large variances in stem parameters are prone to causing difficulties when multiple scans of the same tree are registered together. The paradigm of using multiple scans to increase the quality of the data is challenged by the dynamic properties of the trees. Due to this, single scans may in fact provide the best quality data. To overcome this multi-scan / single scan dilemma, effort should be put into parametrising the trees so that a windless representation could be computed from any single scan measurement irrespective of the wind speed.
Various aspects affect the behaviour of a tree in different wind conditions. These include the tree species, the location, the soil consistency, the surrounding vegetation, to name a few. As the data only included a single tree in a single location, it is apparent that it cannot be directly generalized. However, as the results indicate, the wind conditions have an effect on the stem parameters identified from TLS data. It is clear that this can become an additional error source in single-tree analysis. In addition, the results reveal that there is a potential application for TLS if it could be used for the indirect measurement of wind speed by observing tree stem movement.
5. CONCLUSION
In order to study the effect of wind conditions on a single-tree analysis performed from TLS data, a test site was scanned under different wind conditions. The same measuring instrument and identical scan settings were used. An analysis method was applied to extract tree stem diameters from different heights of the stem. In addition to the stem diameters, the distribution of the points from the identified stem centre point were recorded and the third calculated parameter was the stem location distribution.
As single-tree analyses are increasingly performed from laser scanned data sets and are also applied in industry, the significance of potential errors in analyses also increases. If the methods are applied to the lumber trade, these errors may also have economic significance.
Our results show that the wind may cause both the underestimation and overestimation of tree diameter when using TLS. The duration of the scanning was found to have an impact on the measured shape of the tree stem under 9 m/s wind conditions. The results also indicated that a 9 m/s wind did not have a significant effect on the stem parameters of the lower part of the tree (<28% of the tree height). For a more accurate quantification of the errors caused by varying wind conditions, more extensive tests should be carried out. However, the results prove that the wind conditions should be taken into account more comprehensively in analysis of TLS tree measurements. In addition, TLS could potentially be applied to indirectly measure wind speed by observing tree stem movement or for studying the wind behaviour of different forests areas.
ACKNOWLEDGEMENTS
This research was supported by the following institutions: the Academy of Finland, the Centre of Excellence in Laser Scanning Research (CoE-LaSR, project number 272195), “Interaction of Lidar/Radar Beams with Forests Using Mini-UAV and Mobile Forest Tomography” (259348), the Strategic Research Council project COMBAT (No. 293389); the Aalto Energy Efficiency Research Programme (the “Light Energy—Efficient and Safe Traffic Environments” project); the Aalto University doctoral programme; and the European Union, the European Regional
Chow, J., Lichti, D. and Teskey, W., 2012. “Accuracy assessment of the FARO Focus3D and Leica HDS6100 panoramic-type terrestrial laser scanners through point-based and plane-based user self-calibration.” In FIG Working Week 2012: Knowing to manage the territory, protect the environment, evaluate the cultural heritage, Rome, Italy, May 6–10, 2012.
Holopainen, M., Kankare, V., Vastaranta, M., Liang, X., Lin, Y., Vaaja, M., … & Alho, P., 2013. Tree mapping using airborne, terrestrial and mobile laser scanning: A case study in a heterogeneous urban forest. Urban Forestry & Urban Greening, 12(4), pp. 546–553.
Hopkinson, C., Chasmer, L., Young-Pow, C. and Treitz, P., 2004. Assessing forest metrics with a ground-based scanning lidar. Canadian Journal of Forest Research, 34(3), pp. 573–583.
Hyyppä, H. and Hyyppä, J., 2001. Effects of stand size on the accuracy of remote sensing-based forest inventory. IEEE Transactions on Geoscience and Remote Sensing, 39(12), pp. 2613–2621.
Hyyppä, J., Hyyppä, H., Yu, X., Kaartinen, H., Kukko, A. and Holopainen, M., 2009. Forest inventory using small-footprint airborne LiDAR. Topographic laser ranging and scanning: Principles and processing, pp. 335–370.
Jaakkola, A., Hyyppä, J., Kukko, A., Yu, X., Kaartinen, H., Lehtomäki, M. and Lin, Y., 2010. A low-cost multi-sensoral mobile mapping system and its feasibility for tree measurements. ISPRS journal of Photogrammetry and Remote Sensing, 65(6), pp. 514–522.
Kaartinen, H., Hyyppä, J., Kukko, A., Lehtomaki, M., Jaakkola, J., Vosselman, G., Elberink, S.O., Rutzinger, M., Pu, S. and Vaaja, M., 2013. Mobile mapping—Road environment mapping using mobile laser scanning. EuroSDR Official Publication, 62, pp. 49–95.
Kankare, V., Holopainen, M., Vastaranta, M., Puttonen, E., Yu, X., Hyyppä, J., Vaaja, M., Hyyppä, H. and Alho, P., 2013. Individual tree biomass estimation using terrestrial laser scanning. ISPRS Journal of Photogrammetry and Remote Sensing, 75, pp.64–75.
Kasa, I., 1976. A circle fitting procedure and its error analysis. IEEE Trans. Instrum. Meas, 25(1), pp. 8–14.
Krooks, A., Kaasalainen, S., Kankare, V., Joensuu, M., Raumonen, P. and Kaasalainen, M., 2014. Predicting tree structure from tree height using terrestrial laser scanning and quantitative structure models. Silva Fennica, 48(2).
Lehtomäki, M., Jaakkola, A., Hyyppä, J., Kukko, A. and Kaartinen, H., 2010. Detection of vertical pole-like objects in a road environment using vehicle-based laser scanning data. Remote Sensing, 2(3), pp. 641–664.
Liang, X., Hyyppä, J., Kankare, V. and Holopainen, M., 2011. Stem curve measurement using terrestrial laser scanning. In: Proceedings of 11th International Conference on LiDAR Applications for Assessing Forest Ecosystems, pp. 1–6.
Liang, X., Litkey, P., Hyyppä, J., Kaartinen, H., Vastaranta, M. and Holopainen, M., 2012. Automatic stem mapping using single-scan terrestrial laser scanning. Geoscience and Remote Sensing, IEEE Transactions on, 50(2), pp. 661–670.
Liang, X., Kukko, A., Kaartinen, H., Hyyppä, J., Yu, X., Jaakkola, A. and Wang, Y., 2014. Possibilities of a personal laser scanning system for forest mapping and ecosystem services. Sensors, 14(1), pp. 1228–1248.
Liang, X., Kankare, V., Hyyppä, J., Wang, Y., Kukko, A., Haggrén, H., Yu, X., Kaartinen, H., Jaakkola, A., Guan, F. and Holopainen, M., 2016. Terrestrial laser scanning in forest
inventories. ISPRS Journal of Photogrammetry and Remote Sensing, 115, pp. 63–77.
Maas, H. G., Bienert, A., Scheller, S. and Keane, E., 2008. Automatic forest inventory parameter determination from terrestrial laser scanner data. International journal of remote sensing, 29(5), pp. 1579–1593.
Mayer, H., 1987. Wind-induced tree sways. Trees, 1(4), pp. 195– 206.
Pellikka, P. and Järvenpää, E., 2003. Forest stand characteristics and wind and snow induced forest damage in boreal forest. In Proceedings of the International Conference on Wind Effects on Trees, September, pp. 16–18.
Pfeifer, N. and Winterhalder, D., 2004. Modelling of tree cross sections from terrestrial laser scanning data with free-form curves. International Archives of Photogrammetry, remote sensing and spatial information sciences, 36(Part 8), W2.
Raumonen, P., Kaasalainen, M., Åkerblom, M., Kaasalainen, S., Kaartinen, H., Vastaranta, M., ... and Lewis, P., 2013. Fast automatic precision tree models from terrestrial laser scanner data. Remote Sensing, 5(2), pp. 491–520.
Rutzinger, M., Pratihast, A. K., Oude Elberink, S., and Vosselman, G., 2010. Detection and modelling of 3D trees from mobile laser scanning data. Int. Arch. Photogramm. Remote Sens. Spat. Inf. Sci, 38, pp. 520–525.
Schindler, D., Vogt, R., Fugmann, H., Rodriguez, M., Schönborn, J. and Mayer, H., 2010. Vibration behavior of plantation-grown Scots pine trees in response to wind excitation. Agricultural and forest meteorology, 150(7), pp. 984–993.
Schonborn, J., Schindler, D. and Mayer, H. 2009. Measuring vibrations of a single, solitary broadleaf tree. In Proceedings of the 2nd International Conference. Wind Effects on Trees, Mayer, H. and Schindler, D. (eds.), Albert-Ludwigs-University of Freiburg, Germany, pp. 135–139.
Tansey, K., Selmes, N., Anstee, A., Tate, N. J. and Denniss, A. 2009. Estimating tree and stand variables in a Corsican pine woodland from terrestrial laser scanner data. International Journal of Remote Sensing, 30(19), pp. 5195–5209.
Vanier, D. D., 2001. Why industry needs asset management tools. Journal of computing in civil engineering, 15(1), pp. 35– 43.
Virtanen, J. P., Puustinen, T., Pennanen, K., Vaaja, M. T., Kurkela, M., Viitanen, K., Hyyppä, H. and Rönnholm, P., 2015. Customized visualizations of urban infill development scenarios for local stakeholders. Journal of Building Construction and Planning Research, 3(02), p. 68.