SPATIAL CORRELATIONS OF MALARIA INCIDENCE HOTSPOTS WITH
ENVIRONMENTAL FACTORS IN ASSAM, NORTH EAST INDIA
Bijoy K. Handiquea*, Siraj A. Khanb, P. Duttab, Manash J. Nathb, Abdul Qadiraand P.L.N. Rajua
a
North Eastern Space Applications Centre, Dept. of Space, Umiam 793103 Meghalaya, India–[email protected] b
Regional Medical Research Centre, NER (ICMR), P.O Box 105, Dibrugarh 786001 Assam, India–[email protected]
Commission VIII, WG VIII/2
KEY WORDS:Malaria, GIS, Spatial autocorrelation, Moran’s I index, Gstatistics, vector habitat, Hotspot
ABSTRACT:
Malaria is endemic and a major public health problem in north east (NE) region of India and contributes about 8-12% of India's malaria positives cases. Historical morbidity pattern of malaria in terms of API (Annual Parasite Incidence) in the state of Assam has been used for delineating the malaria incidence hotspots at health sub centre (HSC) level. Strong spatial autocorrelation (p<0.01) among the HSCs have been observed in terms of API (Annual Parasite Incidence). Malaria incidence hot spots in the state could be identified based on General G statistics and tested for statistical significance. Spatial correlation of malaria incidence hotspots with physiographic and climatic parameters across 6 agro-climatic zones of the state reveals the types of land cover pattern and the range of elevation contributing to the malaria outbreaks. Analysis shows that villages under malaria hotspots are having more agricultural land, evergreen/semi-evergreen forests with abundant waterbodies. Statistical and spatial analyses of malaria incidence showed a significant positive correlation with malaria incidence hotspots and the elevation (p<0.05) with villages under malaria hotspots are having average elevation ranging between 17 to 240 MSL. This conforms to the characteristics of two dominant mosquito species in the stateAnopheles minimusandAn. baimaithat prefers the habitat of slow flowing streams in the foot hills and in forest ecosystems respectively.
1. INTRODUCTION
Globally malaria clinical cases are reported as 300–500 million and 1.5–2.7 million deaths annually (Srivastava et al., 2001). Malaria is endemic and a major public health problem in north eastern region (NER) of India. It is stable with preponderance (60-80%) ofPlasmodium falciparum(Pf) species in the entire region. NE region makes up to only 3.7% population of India but contributes 8-12% of malaria positives, 10-20% of Pf cases and 13-41% deaths due to malaria as compared to the whole nation during the last decade (Dev, 2009). Among NE states, Assam is highly receptive to malaria transmission and accounts for more than 50% of reported cases of malaria in NER. Here malaria transmission is perennial and persistent with seasonal peak during April-September corresponding to months of rainfall. P. falciparum and P. vivax both occur in abundance but P. falciparum is the predominant parasite (>60%). Focal disease outbreaks were recurring characterized by high rise in cases and deaths attributed toP. falciparummalaria. (Dutta, 1997).
Human malaria is a complex disease and its incidence is a function of the interaction between the Anopheles mosquito vector, the parasite, humans and the environment. Different mosquito species have different habitat preferences like steams, rice fields, plantations, forests, forest fringes, foothills, etc. The physical environment also plays a significant role in the distribution of species in particular geographical areas. For optimizing vector control operations, spatial distribution of malaria is an important consideration for designing
situation-specific intervention strategies that are aimed at reducing transmission.
Geospatial techniques comprises of remote sensing, geographic information system (GIS) and global positioning system (GPS) have added new dimensions to spatial statistics analysis in epidemiological studies (Back et al., 1994, Hay et al., 1997). Many studies have applied these advanced tools in understanding the host-vector relationship and their spatial distribution (Barnes & Cibula, 1979, Glass et al., 1995, Hendrickxyet al., 1999, Dhiman, 2000, Abelardoet al., 2000, Jeganathanet al., 2001, Handiqueet al., 2011). Spatial statistics analytical techniques help in analyzing the spatial order and association of a variable under study. In areas like ecology, epidemiology, geology and image processing, it is often not appropriate to randomize, block and replicate the data because of the spatial associations of attribute features associated with study variable (Lawson, 2001). On the other hand, it is required to stratify and prioritise areas under a particular administrative unit for better planning and managing resources. Hence a sound technique has to be followed to prioritise these areas of importance or hot spots with sound statistical base. Use of predictive approaches have been demonstrated by different workers for study the of mosquito vector borne diseases like malaria (Srivastavaet al., 2001, Abekuet al.,2002).
In this study, we have employed spatial statistics analytical tools in GIS domain to study the spatial distribution of malaria incidence and identify the disease hotspots at Health Sub Centre (HSC) level. Malaria incidence rates were integrated with
vegetation cover derived from Indian remote sensing data and elevation from digital elevation model of ASTER data.
The outcome of the study is expected to help the district health authorities to mobilise man and materials for timely interventions.
2. METERIALS AND METHODS
2.1 Study Area
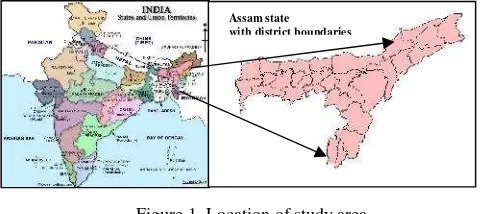
The study was carried out in Assam state located in the north eastern part of India considering the severity of impact of Malaria and its perennial occurrence. The state of Assam (24044' - 27045' N latitude; 89041' - 96002' longitude) is the most populous (30.94 million population as per census 2012) and is the gateway to the northeast for economic activities. The problem of chloroquine resistance first detected in Assam and is spreading and intensifying thereby creating greater concern for the disease.
Figure 1. Location of study area
2.2 Collection of Malaria case data
Data pertaining to the Malaria cases during the period 2008-2013 were collected from the office of the Joint Director of Health Services located at different district head quarters and from the office of the Directorate of Health Services, Guwahati, Annual Parasite Incidence (API) which is the number of confirmed cases during one year per 1000 population was calculated based on the PHC wise census records collected from the respective PHCs compiled under National Vector Borne Disease Control Programme (NVBDCP). We considered the HSCs having more than 2 API.
2.3 Spatial Statistics Analysis
2.3.1 Measure of spatial autocorrelation
It is of interest to see the spatial distribution pattern of malaria reporting villages in the district. If we observe the malaria reporting villages to follow any kind of clustering pattern, we may like to relate the occurrence of the disease with underlying landscape and socio-economic features. In classifying spatial patterns as clustered, dispersed or random, we focussed on how various HSCs are arranged and observed the extent of spatial autocorrelation (Lee and Wong, 2001). Here, high autocorrelation would imply the occurrence of HSCs with higher value of API and the correlation is attributable to the geographic ordering HSCs. The most commonly used spatial auto-correlation statistic, Moran’s I coefficient (Chou, 1997)was employed to measure the autocorrelation (Eq. 1-4). Moran’s I can be defined
as-
relationship diminishes when the distance increases. Hence wij= 1 / dij.When no spatial autocorrelation exists, the expected value of Moran’s I is denotes API corresponding to ith HSC.
The value of the Moran’s I coefficient ranges between-1 and 1. A larger positive value implies a clustered pattern, while a negative value significantly different from 0 is associated with scattered pattern. When the Moran’s I coefficient is not significantly different from 0, there is no spatial autocorrelation and the spatial pattern is considered to be random.
Spatial statistics tool in ArcGIS software used to measure spatial autocorrelation is based not only on locations of the HSC or on number of malaria cases (API) alone, but on both HSC locations and corresponding API simultaneously. Given a set of HSC and associated malaria cases, it evaluates whether the pattern expressed is clustered, dispersed or random. A ‘Z’ score is calculated to assess whether the observed clustering / dispersion is statistically significant or not. The Z score is calculated
as-(4)
2.3.4 Delineation of Malaria hotspots
Moran’s I has well-established statistical properties to describe spatial autocorrelation globally. However, it is not effective in identifying different type of clustering spatial patterns. These patterns are sometimes described as ‘hot spots’ and ‘cold spots’. If high values are close to each other, Moran’s I will indicate relatively high positive spatial autocorrelation. The clusters of high values may be labelled as a hot spot. But high positive spatial autocorrelation indicated by Moran’s I could be created by low values close to each other. This type of clusters can be described as cold spot. Delineation of these hot spots and cold spots will help in optimising the use of resources for timely interventions. The G statistics (Getis and Ord, 1992) has the advantage of detecting the presence of hot spots or cold spots over the entire study area (Eq. 5-8). A local measure of spatial autocorrelation is the local version of the General G statistics. The local G statistics is derived for each aerial unit to indicate how the values of aerial units of concern is associated with the values of surrounding aerial units defined by a distance threshold d. The Local G statistics is defined as:
This G statistics is defined by a distance d, within which the aerial units can be regarded as neighbours of i. The weight wij(d) is 1 if aerial unit j is within d, or 0 otherwise. Thus the weight matrix is essentially a binary symmetrical matrix, but the neighbouring relationship is defined by distance, d. The sum of the weights is:
d
association of high and moderate values, and a low level of Gi(d) indicates spatial association of low and below average values. Before calculating the G statistics we need to define a distance d, within which aerial units will be regarded as neighbours. In this exercise we have defined d as a distance of 10 kilometers based on the extent of the study area and spatial distribution of Health Sub Centres. So the HSCs will be regarded as neighbours if they are within an aerial distance of 10 km. For detail interpretation of the general G statistics we rely on its expected value and standardised score (Z score).To derive Z score and to test for the significance of the general G statistics, we have to know the expected value of Gi(d) and its variance. The expected value of Gi(d)
is-
The expected value of Gi(d) indicates the value of Gi(d) if there is no significant spatial association or if the level of Gi(d) is average. Then we need to derive the Z score of the observed statistics based on the variance. Variance of Gi(d) is calculated as follows and tested for statistical significance. (Getis and Ord, 1992):
2
2Where, n denotes the number of aerial units (villages) in the entire study area.
2.3 Geospatial data
Land use/ land cover maps prepared as a part of National Natural Resources Census (NR Census) using IRS LISS III satellite data with spatial resolution of 23.5 meters were used in the study (NRSC 2011). Land cover types within a buffer of 3 kilometres (maximum flying range of mosquitoes) from the centres of the villages under malaria incidence hotspots were delineated and a comparison has been made across 6 agro-climatic zones of the state to correlate with the disease incidence. Climatic condition of different agro-climatic zones and the districts covered under each zone are given in Table-1. With the assumptions that the most
dominant mosquito species in the stateAnopheles minimusand
An. baimai prefers the habitat of slow flowing streams in the foot hills and in forest ecosystems respectively, variation in the elevation of areas under JE incidence hotspots were analysed with elevation data retrieved from ASTER DEM with 30 m resolution.
Table 1. Climatic conditions of Agro-climatic zones and districts covered temperature rises up to 370C in July-August and the minimum falls to 50C in January. humidity (more than 80%). The maximum temperature rises up to 370C in July-August and minimum falls to 50C in zone comes under rain shadow belt where the rainfall is much lower (600 mm) The maximum temperature rises up to 380C in July-August and minimum falls maximum temperature rises upto 310C in July-August and
The climate is characterized by high rainfall (more than 2000 mm), high temperature and high humidity. Maximum temperature rises up to 370C in July-August and minimum falls
3. RESULTS AND DISCUSSION
3.1 Spatial pattern of malaria distribution
Spatial autocorrelation among HSCs have been measured with Global Moran’s I index. Global Moran’s I, O(I) calculated with all the HSCs having API >2 for the study period is found to be 0.00744 with Expected value E(I) 0.00143. Z score is found to be 3.24, which is significant at 99% confidence level (p< 0.01). These results confirm that spatial distribution of Malaria occurrence is non-random) and hence calls for special attention in the areas of Malaria occurrence.
3.2 Malaria incidence hotspots and high risk areas
Malaria incidence hotspots have been identified with G statistics based on whether large number of cases measured in terms of API tends to cluster in the area. Highest value of Gi is calculated to be 5.211 and the lowest is -1.430. Z Scores have been calculated for testing the statistical significance. SHCs with Z score more than 2.56 has been considered to significant at 99% confidence level (p<0.01) and put in the hotspot category. Udalguri district located in the foothills of Bhutan has identified as the district having maximum SHCs under hotspot category followed by Baska district having 70 HSCs in hotspot category. On the other hand the districts of Dibrugarh and Kamrup (Metro) are the districts having two number of HSCs as hotspots (Figure 2). It has been observed that the SHCs located in the foot hills are having relatively high Malaria incidence in terms of API and the same has been reflected in having higher malaria incidence hotspots.
Figure 2. Number of SHCs identified as hotspots in different districts of Assam
3.3 Relation of Malaria incidence hotspots with vector habitats
It is interesting to note that majority of the Malaria incidence hotspots are from foothills areas of the state. Foothills areas from Kokrajhar to Dhemaji reported maximum number of hotspots. This observation reveals that the most dominant mosquito species in the stateAnopheles minimusandAn. baimaiprefers the habitat of slow flowing streams in the foot hills and in forest ecosystems respectively. Vegetation covers within the 3 km buffer of villages under Malaria incidence hotspots shows that kharif crop areas (grown during June/July to Nov/Dec) occupies the major areas in all the agro-climatic zones with a percent of coverages from 16-50% (Table 2 & Figure 3). In LBVZ and CBVZ, deciduous forest covers about 12 % of the total land cover areas. In HZ, forest covers about 63% of the total land cover areas, out of which about 43% is the dense forest (evergreen and semi-evergreen). Significant areas of evergreen and semi-evergreen are observed in the malaria incidence hotspots of UBVZ (11%). This corroborate the results of Srivastavaet al.(2004) who reported that two types of forests, namely evergreen tropical wet and moist deciduous
forests available along the Himalaya foothills are favourable for the distribution ofAn. baimai.
Figure 3. Malaria incidence hotspots with different land use/land covers
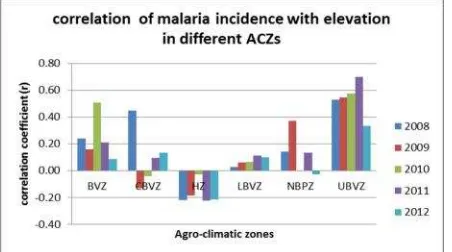
3.4 Relation of Malaria incidence hotspots with elevation
In view of the observation that the majority of the malaria incidence hotpots are located along the foothill area of the state, a detailed analysis was made by correlating average elevation of the villages under malaria hotspots to that of the year wise malaria incidence. Positive correlation observed in all the agro-climatic zones except the hill zone, which is obvious. Among agro-climatic zones, UBVZ showed highly significant positive correlation during the years 2008-2012 (p<0.005). This may be due to the fact that An. minimus prefers to breed in clear, unpolluted slow moving water with grassy and partially shaded edges (Nagpal and Sharma, 1987).
Table 3. Correlation of Malaria incidence hotspots with elevation
Agro-climatic
Zones
API during 2008-2012 Average elevation of areas (MSL) under HSCs
(r) No of
HSC Max Min Average SE Max Min Average SE
UBVZ 60 42.25 2.08 8.21 9.26 155.00 57.74 110.43 22.04 0.52
NBPZ 187 308.46 2.02 16.95 26.74 204.53 50.14 93.38 28.49 0.12
LBVZ 272 146.62 2.00 9.88 15.11 237.50 11.13 16.69 25.77 0.08
HZ 84 232.38 2.17 16.36 21.85 1446.65 7.75 240.32
272.3 5
-0.16
CBVZ 59 24.91 2.11 6.61 5.72 175.33 6.00 65.22 23.18 0.24
BVZ 61 124.58 2.13 9.53 13.32 274.80 3.71 34.88 45.07 0.17
4. CONCLUSION
The study shows the potential application of spatial statistics analysis to delineate the disease incidence hot spots at health sub centre level. Maximum attention should be given to these Malaria incidence hotspots by the health department authorities to minimise fatalities. Information generated in this exercise will serve as baseline information and will help in future monitoring of the disease in the state. The study in the hot spots in terms of physiographic and climatic factors has helped in understanding the threshold of different parameters responsible for disease transmission and outbreak.
ACKNOWLEDGEMENTS
The authors are thankful to Joint Directors of Health Services, Govt. of Assam for providing historical data on Malaria cases at health sub centre level for the state of Assam. Funding support received from Dept. of Space, Govt. of India for carrying out the study in the form of an EOAM project is duly acknowledged.
Table 2. Land use/land cover classes within three kilometers buffer of villages under malaria hotspots
Land use/land cover classes LBVZ CBVZ BVZ NBPZ HZ UBVZ
Agricultural Land-Crop Land-Kharif Crop 197248
(39) 32490 (28) 31781 (25)
182107
(50) 32646 (16)
43546 (34) Agricultural Land-Crop Land-More than two crop 298 (<0.5) 0 0 473 (<0.5) 0 43 (<0.5) Agricultural Land-Crop Land-Rabi Crop 1295 (<0.5) 968 (1) 694 (1) 1993 (1) 1481 (1) 789 (1) Agricultural Land-Crop Land-Two Crop area 44182 (9) 2184 (2) 354 (<0.5) 13496 (4) 302 (<0.5) 3204 (3) Agricultural Land-Crop Land-Zaid Crop 1307 (<0.5) 6692 (6) 0 14 (<0.5) 658 (<0.5) 0
Agricultural Land-Fallow-Current Fallow 346 (<0.5) 0 0 0 0 0
Agricultural Land-Plantation 1663 (<0.5) 11124 (9) 10486 (8) 28410 (8) 2294 (1) 21969
(17) Built Up-Built Up (Rural)-Built Up area (Rural) 2677 (1) 377 (<0.5) 71 (<0.5) 2264 (1) 2774 (1) 518 (<0.5) Built Up-Mining / Industrial area-Industrial 212 (<0.5) 135 (<0.5) 0 0 161 (<0.5) 0)
Forest- Moist Deciduous 59380 (12) 14585 (12) 0 2417 (1) 1458 (1) 1131 (1)
Forest-Deciduous (Dry/Moist/Thorn)-Open 714 (<0.5) 0 0 0 0 0
Forest-Evergreen / Semi Evergreen-Dense/Closed 1913 (<0.5) 2091 (2) 54478 (43) 5915 (2) 6330 (3) 14386 (11) Forest-Forest Blank 24 (<0.5) 117 (<0.5) 3325 (3) 25 (<0.5) 7326 (4) 96 (<0.5)
Forest-Forest Plantation 0 1662 (1) 0 0 756 (<0.5) 0
Forest-Scrub Forest 11888 (2) 16 (<0.5) 2288 (2) 444 (<0.5) 7197 (4) 3211 (3)
Natural Grassland & Grazing land-Sub tropical 13106 (>3) 4865 (4) 56 (<0.5) 8651 (2) 318 (<0.5) 1303 (1)
Others-Shifting cultivation 103 (<0.5) 5 (<0.5) 1820 (1) 0 1702 (1) 13 (<0.5)
Tree Clad Area-Open 124554
(25) 29812 (25) 17175 (14) 94257 (26) 79137 (40)
31179 (24)
Wastelands 2462 (<0.5) 4234 (4) 0 934 (<0.5) 50368 (25) 840 (1)
Waterbodies-River/Stream 29222 (6) 1946 (2) 1966 (2) 19892 (5) 4038 (2) 3296 (3)
REFERENCES
Abeku, T.A., de Tarekegn A. Vlas, S.J., Borsboom, G., Teklehaimanot, A., Kebede, A., Olana, D., van Oortmarsen,
G.J. and Habbema, J.D.F., 2002. Forecasting malaria incidence from historical morbidity patterns in epidemic-prone areas of Ethiopia: a simple seasonal adjustment method performs best.
Tropical Medicine and International Health, 7(10), pp. 851-857.
Abelardo, C., Moncayo, John, Edman, D. and John, T. Finn., 2000. Application of geographic information technology in determining risk at Eastern Equine Encephalomyelitis virus transmission. Journal of American Mosquito Control Association, 16(1), pp. 28-25.
Barnes, C.M. and Cibula, W.G., 1979. Some implications of remote sensing technology in insect control programmes including mosquitoes.Mosquito News,39, pp..271-282.
Beck, E.L., Rodriguez, M.H., Dister, S.W., Rodriguez, A.D., Rejmankova, E., Ulloa, A., Meza, R.A., Robert, D.R., Paris, J.F., Spanner, M.A., Washino, R.K., Hacker, C. and Legters, L., 1994. Remote sensing as a landscape epidemiological tool to identify village at high risk for malaria transmission. The American Journal of Tropical Medicine and Hygiene. 51(3), 271-280.
Chou, Y.H., 1997. Exploring Spatial Analysis in Geographic Information Systems. (Onwards Press).
Dhiman, R. C., 2000, Remote sensing: a visionary tool in malaria epidemiology.ICMR bulletin.30(11), pp.1-2.
Dutta P, Khan, S.A. Sharma, C.K. and Mahanta, J. 1997. A report of mosquito fauna survey and vector incrimination in Goalpara district of Assam. Indian Journal of Malariology. 34: pp.204–207.
Getis, A and Ord, J.K., 1992. The Analysis of spatial association by use of distance statistics. Geographical Analysis, 24 (3), pp. 189-207.
Glass, G.E., Schwartz, B.S., Morgan, J.M. III, Johnson, D.T., Noy, P. M. and Israel, E.,1995. Environmental risk factor for
lyme disease identified with Geographic Information System.
American Journal of Public Health. 85, pp. 944-948.
Handique, B. K., Khan, S. A., Chakraborty K.. Goswami J. and Sarma, K. K., 2011. Spatial statistics analysis of Japanese Encephalitis occurrence and identification of disease hot spots -case studies in a JE endemic district of north east India,
International Journal of Geoinformatics,7(1) pp.7-14.
Hay, S.I., Packer, M.J. and Rogers, D.J., 1997. The impact of remote sensing on the study and control of invertebrate intermediate hosts and vectors for disease. International Journal of Remote Sensing,18(14), pp. 2899-2930.
Hendrickxy, G., Napala, A., Dao, B., Batawuli, D., DeDeken, R., Vermilien, A. and Stingenberg, J.H.W., 1999. A systematic approach to area wide tsetse distribution and abundance maps.
Bulletin of Entomological Research. 89, 231-244.
Jeganathan, C., Khan, S.A., Ramesh Chandra, Singh, H., Srivastava, V. and Raju, P.L.N., 2001, Characterisation of malaria vector habitats using remote sensing and GIS. Journal of the Indian Society of Remote Sensing. 29(2), 31-36.
Lawson, A. B. 2001. Statistical methods in spatial epidemiology(Singapore: John Wiley and Sons Ltd.)
Lee, J. and Wong, D.W.S., 2001. Statistical Analysis with ARCVIEW GIS. (Singapore: John Wiley & Sons Ltd.)
Nagpal, B.N. and Sharma, V.P., 1987. Survey of mosquito fauna of north-eastern region of India. Indian Journal of Malariology, 24, pp. 143–149.
Srivastava, A., Nagpal, B.N., Saxena, R. and Subbarao, S.K., 2001, Predictive habitat modelling for forest malaria vector species An. dirus in India – a GIS based approach. Current Science.80(9), 1129-1134.