ASSESSING SPATIAL DATA QUALITY OF PARTICIPATORY GIS STUDIES: A CASE
STUDY IN CAPE TOWN
K. Musungu a *
a Department of Civil Engineering and Surveying, Cape Peninsula University of Technology, Cape Town, South Africa [email protected]
KEY WORDS: Spatial Quality, Participatory GIS, Informal Settlements, Community-Integrated GIS, Quality criteria
ABSTRACT:
Participatory GIS (PGIS) has been prescribed by scholars who sought to find a means to enable more equitable access to GIS data, diversifying the types of knowledge captured by a GIS and re-engineering GIS software. The popularity of PGIS is evident in the various studies and contexts in which it has been utilised. These include studies in risk assessment, land administration, resource management, crime mapping and urban design to mention but a few. Despite the popularity of PGIS as a body of research, little has been done in the analysis of the quality of PGIS information. The study investigated the use of data quality criteria commonly used in traditional GIS systems and shows that it is possible to apply the criteria used in traditional GIS to PGIS. It provides a starting point for PGIS studies to assess the quality of the product. Notably, this a reflective exercise on one case study, but the methodologies used in this study have been replicated in many others undertaken by Community Based Organisations as well as Non-Governmental Organisations. Therefore the findings are relevant to such projects.
* Corresponding author
1. INTRODUCTION
Geographical Information Systems (GIS) are now commonly used in various applications worldwide. GIS is essentially a computerized system that allows one to map, model, query, and analyse spatial data (Quan et al, 2001). A GIS consists of several components but in summary, GIS incorporates geographical data into a database that can then be subjected to a number of spatial analytical algorithms (Abbott et al, 1998; Pickles, 1995). Considering the diversity of spatial data as well as the analytical components of GIS, early studies on the subject noted concerns that it could be exclusionary rather than inclusive. Reason being that the data was often expensive to source, software was expensive, significant expertise was required for data manipulation and processing, and significant commitment of resources was required to maintain the developed GIS (Elwood, 2008; Abbott et al, 1998). Conversely, the consequent absence of community knowledge meant that the traditional GIS did not have the full scope of information required by decision makers to come to the best conclusions.
Participatory GIS (PGIS) was forged out of these discussions as scholars sought to find a means to enable more equitable access to GIS data, diversifying the types of knowledge captured by a GIS and re-engineering GIS software. Some broad definitions have been postulated in the body of research on participatory GIS. Quan et al (2001: 2) describe PGIS as ‘the integration of local knowledge as well as stakeholders’ perspectives in a GIS’. Laituri (2003: 25) on the other hand, describes PGIS as ‘a confluence of social activity such as grassroots organizations and government decision making with technology in specific places or grounded geographies’. Tulloch (2003) states that no single definition of PGIS is feasible, but looking at the various studies on the subject it could be described as ‘a study of the uses and applications of GIS technology used by members of
the public, both as individuals and grass-root groups, for the participation in public processes from data collection to decision-making’. These three definitions broadly describe the main attributes of PGIS i.e. relationships between primary stakeholders (e.g. end-beneficiary communities) and secondary stakeholders (such as government) as well as processes involving GIS (Elwood, 2008).
Weiner and Harris (2003) similarly fashioned the term Community-Integrated GIS (CiGIS) describing a GIS that facilitates participation of people and communities that would otherwise be peripheral in the decision making process. Rambaldi et al (2006) and Abbott et al (1998) posit that PGIS has its roots in Participatory Learning and Action (PLA) as well as Participatory Rural Appraisal (PRA) because it combines aspects such as Spatial Information Technologies (SITs), spatial learning, participatory mapping as communication and advocacy. This paradigm shift from GIS to PGIS has transformed the technology into a means of communication between previously disconnected groups (Elwood, 2008; Weiner and Harris 2003).
The popularity of PGIS is evident in the various studies and contexts in which it has been utilised. These include studies in risk assessment (Cadag and Gaillard, 2012; Mccall, 2008; Musungu, 2012; Musungu et al, 2012a) land administration (Lefulebe et al, 2015; Brown et al, 2014; Karanja, 2010), resource management (Brown, 2012; Kyem, 2002; Musungu and Jacobs, 2015), crime mapping (Mans, 2006; Pain, 2006) and urban design (Talen, 2000; Musungu et al, 2012b) to mention but a few.
Despite the popularity of PGIS as a body of research, little has been done in the analysis of the quality of PGIS information. Scholars contend that are limitations intrinsic to spatial data that
can influence the dependability of an output or product derived from spatial analysis (Devillers et al, 2010b). Consequently, research has sought to inform methods for gauging errors in vector data (Harding, 2010) as well as modelling (Stein and Van Oort, 2010) and managing uncertainty (Fisher et al, 2010). In addition, some studies have sought to investigate quality of raster datasets such as remote sensing imagery, by analysing aspects of the workflow from the data collection to the processing and analysis of the images (Riazanoff and Santer, 2010). These aspects include for instance, radiometric, spectral, atmospheric and geometric corrections. It is incumbent on data providers to assess the quality of the spatial products (Harding, 2010)
The aim of this paper is therefore to conduct a quality analysis of a participatory GIS developed for a case study site in Cape Town. In order to do so, the paper will first present the current
‘state-of-the-art’ in spatial data quality assessment. The representation of a real spatial environment and therefore spatial quality is a measure of the difference between the model and the reality it represents (Docan, 2013). Thus, Chrisman (2010) noted that discussion on spatial quality had evolved from analysis of positional error to include factors such as attribute accuracy, topology and fitness for purpose. Devillers and Jeansoulin (2010a) further distinguished two main components of spatial quality namely internal and external quality. Internal quality corresponds to the extent of similarity between the data produced and the ideal data that should have been produced. External quality corresponds to the level of conformance that exists between a spatial data product and the end users’ needs in a given context (Devillers and Jeansoulin, 2010). The concept of external quality implies that the same dataset can be perceived to have different quality to different users and thus external quality is not absolute. Most definitions on quality are often associated with external quality. For instance, Docan (2013) describes quality as ‘the totality of characteristics of a product that bear on its ability to satisfy stated and implied needs’.
2.2 Data Quality Parameters
Geospatial observations describe phenomena with three key components i.e. spatial, temporal and thematic components. Veregin (1999) posits that space, which is primarily concerned with geographical location, has long been the most highlighted component when assessing quality of geospatial observations. Further, Veregin (1999) highlights the fact that time should be an important component of spatial quality assessment especially because events manifest in both space and time. Additionally, the study argues that whilst it is true that without space there is nothing geographical about the data, the theme is also very relevant, because without it, there is only geometry. In other words, describing the ‘what’ is just as relevant as describing the ‘where’.
2.3 Data Quality Components
The Spatial Data Transfer Standard (SDTS) is a data transfer standard designed to facilitate dissemination and sharing of data. It provides standard definitions of data elements, a standardised format for data transfer, and descriptive metadata about database contents. A number of standards including lineage, positional accuracy, attribute accuracy, logical consistency, and completeness were prescribed by the SDTS (Veregin, 1999) and Servigne, Lesage and Libourel (2010).
2.3.1 Geometric accuracy (or positional accuracy, spatial accuracy): It defines the deviation in the values of the
respective positions between the data (in the GIS for instance) and the nominal ground (Servigne, Lesage and Libourel, 2010). The nominal ground is essentially an abstraction of the real world. Positional accuracy is could either be divided into absolute or relative accuracy. It may also be subdivided into horizontal and vertical accuracy components. Assessment methods are generally based on evaluation against the sources, comparison to a standard of higher accuracy or empirical estimates. Variations in accuracy may be reported as quality overlays or additional attributes (Veregin, 1999).
2.3.2 Semantic accuracy (or accuracy of non-spatial attributes): Attribute information is the non-spatial descriptive
information about a geographic feature in a GIS. It is usually stored in a table and linked to the feature by a unique identifier. This criterion provides information on the difference between the values of non-spatial attributes and their true value (Harding 2010; Servigne, Lesage and Libourel, 2010). Assessment methods are based on empirical estimates, sampling or map overlay (Veregin, 1999).
2.3.3 Completeness: Completeness describes the relationship between objects in a dataset and the same set of objects in the real world. Data completeness is useful for the detection of both errors of commission (extra incorrect features) and omission (missing features) of certain objects. When looking at a spatial model, model completeness, expresses suitability of the provided representation for user requirements (Harding, 2010; Servigne, Lesage and Libourel, 2010). It could also include information such as selection criteria, definitions and other mapping rules used to create the database (Veregin, 1999).
2.3.4 Lineage: Lineage describes the life history of a dataset
(Harding, 2010: 145). It provides the necessary information for one to reconstruct the history of a dataset and therefore analyse its potential use. Lineage provides information such as: the data source including information on the organisation providing it, coordinate systems, projection systems, associated corrections etc.; Methods of acquisition, derivation or compilation of the data; methods of data conversion such as stages in digitization/vectorization of raster data; transformations e.g. Coordinate transformations, reclassification etc. (Servigne, Lesage and Libourel, 2010). Though these criteria are well described in seminal texts on spatial quality, there are often overlaps in their utility when assessing the quality of spatial datasets. For instance, the geometric accuracy could actually become a measure of semantic accuracy if one were to treat the location of objects as a specific attribute of entities (Servigne, Lesage and Libourel, 2010).
2.3.5 Logical consistency: It has the goal of describing the
correctness or fidelity of relationships encoded in the database structure in regard to all the constraints caused by data-input specifications (Harding, 2010; Servigne, Lesage and Libourel, 2010). A dataset is called consistent if it respects the structural characteristics of the object it represents. For instance, a contour should be closed, buildings should be closed polygons, nodes of a road network should connect etc. This encompasses tests that check the validity of values for attributes, and description of topological inconsistencies based on graphical or specific topological tests (Veregin, 1999).
2.3.6 Temporal accuracy: The date of data input or data
revision is extremely important for a data user to decide whether
the data is ‘fit for use’. It is concerned with the temporal aspect
of data such as the dates of data observation or capture, types and frequency of data updates, and the data’s validity period (Servigne, Lesage and Libourel, 2010). One can distinguish three time concepts: factual time i.e. the dates when the actual event took place e.g. date of capture of aerial photography, time of observation and transactional time, corresponding to time the data was actually entered into the database.
2.3.7 Semantic consistency: It describes the relevance of the
significance of objects with respect to the selected model; it describes the number of objects, of relationships, and attributes correctly encoded with respect to the set of rules and specifications (Servigne, Lesage and Libourel, 2010). Simply, semantic consistency is concerned with the quality with which geographic objects are specified. For instance, if one was creating a database of hospitals, would it include clinics? Quite often one comes across datasets that could occupy a number of possible classes and it is important to be consistent in the way they are captured.
2.3.8 Timeliness: Timeliness provides information about the
‘freshness’ of the data. It can be represented by a period defining start and end dates (Servigne, Lesage and Libourel, 2010). Though some studies regard this as a separate parameter, Harding (2010) suggests that currency could also be viewed as a form of semantic accuracy and that even completeness and semantic consistency could be bundled under semantic accuracy. Docan (2013) prefers to classify elements of timeliness under temporal accuracy.
2.4 Case study examples
Siebritz (2014) compared data from OpenStreetMap (OSM), to a reference data set provided by the national mapping Agency (NMA) of South Africa i.e. the Chief Directorate: National Geo-Spatial Information (CD: NGI). The CD: NGI standard on topographic data capture states that features captured by photogrammetric methods must have a positional accuracy not exceeding 10 metres at the 95% confidence level and that also that features shall be correctly classified at the 90% confidence interval. The OSM data was assessed with respect to the positional accuracy and semantic accuracy. In addition, the study further assessed the completeness of roads. The results showed that the OSM quality is heterogeneous across South Africa (Siebritz, 2014).
de Leeuw (2011) investigated the classification accuracy of road infrastructure using high resolution satellite imagery of an urban area in western Kenya. The classification was done by both surveyors and non-surveyors as well as with and without local
knowledge. The study found that those with local knowledge classified roads with over 92% accuracy on average, irrespective of surveying background. Also, professional surveyors and laymen without local knowledge achieved lower accuracies of 67.7% and 42.9% respectively. The study argued that local knowledge is likely to improve the classification accuracy of attributes featured in topographic maps. It also concluded that classification studies and the workflows for the production and updating of topographical maps should consider engaging local expertise (de Leeuw, 2011).
3. CASE STUDY
3.1 Case study site
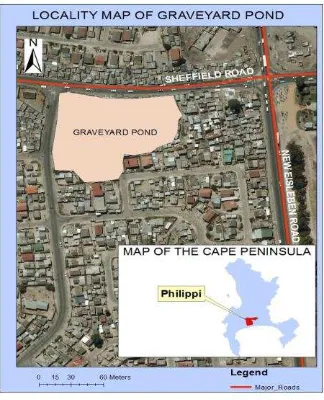
Graveyard Pond is an informal settlement (a slum) located in Philippi, a suburb in Cape Town. It lies southwest of the intersection of Sheffield Road and New Eisleben road (Figure 1). The settlement particularly prone to flooding because it is located in an area designated as a catchment pond by the local municipality.
This study is a reflective exercise on a participatory study that assessed the impacts of flooding and fires as well as coping mechanisms on the vulnerability of local communities living in informal settlements. The participatory approach to flood risk management required the collection of information from the communities actually affected by the flooding. Firstly, meetings were held with the local community leaders, during which the various types of flooding experienced in the community were discussed. It was noted that flooding occurred from rising underground water, from the combination of leaking roofs and depressed floors, and from poor drainage during rainfall, which the leaders described as ‘real flooding’. The types of waterborne diseases, employment and welfare grants were also noted.
Figure 1. Locality Map of Graveyard Pond
Secondly, a questionnaire was designed with the help of a local NGO that included all the factors discussed. It included questions on income, employment, length of stay in the settlement, gender, health, methods of adaptation, types of flooding, and proposed mitigation measures. In order to link the questionnaire to a household, each questionnaire was also designed to include a section to mark the respective shack number of the interviewee.
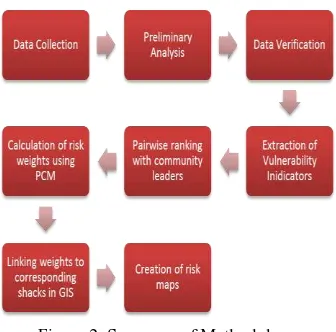
Figure 2. Summary of Methodology
Maps of the responses were subsequently created presented to the local community for feedback on the accuracy of the mapping exercise. Subsequently, a pairwise multi-criteria analysis of the data was carried out in order to assess the levels of vulnerability to flooding in the settlement. Figure 2 shows a summary of the methodology from the data collection phase to the creation of risk maps. A more detailed description of the study can be found in Musungu (2012) and Musungu et al (2012a).
This study will now seek to retrospectively assess the spatial quality of the data captured during those studies. The assessment will rely on the data quality parameters described in the preceding text by Chrisman (2010), Harding (2010), Servigne, Lesage and Libourel (2010) and Veregin (1999).
4. ASSESSING SPATIAL QUALITY
The following sections will assess the spatial quality of the participatory GIS using the eight spatial quality components prescribed in the preceding section.
4.1 Geometric Accuracy
The study into Graveyard Pond utilised aerial photography that had been captured by the local municipality. Georeferenced aerial photography was used as a abase dataset to digitise the shacks. The background of Figure 1 shows some of the data being use the base data.
There were both advantages and disadvantages for using the aerial photography. Previous research in similar areas had relied on field tape measurements taken around and between the shacks in order to draft the relative shack locations. The result was that the maps were at the wrong scale and the relative positions of the shacks were wrong. The main benefit of using the aerial photography was that when the questionnaire was concluded, the individual shacks could be digitised from the aerial photography. This meant that the shacks were well positioned relative to each other and that the scale was correct. Notably, it also meant that the accuracy of the positions of the shacks was based on the accuracy of the aerial photography which at that stage was approximately 5 meters. Considering that the study was meant to assess flooding, a phenomenon that covers large areas, the 5 meter accuracy was fit for purpose.
Nonetheless there were difficulties with utilising the aerial photos. Many of the shacks could not be distinguished from
each other in the aerial photography because the roofs were similar. What appeared to be a single shack could turn out to be three neighbouring shacks when conducting the questionnaire interviews during the fieldwork exercise. In some cases, the roofs of the shacks also appeared too similar to the adjacent ground.
The potential use of handheld Global Navigation Satellite Systems (GNSS) was hampered by multipath because of the density of the shacks in the informal settlement. Also, the vertical component of the area of interest was important for the prediction of water flow paths and areas where water could gather over time. Since aerial photography was used instead of traditional survey methods, such information was missing. These two factors hampered the geometric accuracy of the mapping exercise.
However, an alternative approach in the study was to look at vulnerability from a social standpoint rather than a biophysical standpoint. The social vulnerability approach assesses coping mechanisms against exposure to hazards whilst the biophysical approach uses spatial analysis primarily to estimate areas that could be flooded. Since the aim of the vulnerability study was to assess social vulnerability, the positional accuracy of the aerial photography was sufficient regardless of the poor or absent height information.
4.2 Semantic Accuracy
There were many challenges with the attribute accuracy of the dataset. Firstly, because the data was captured by the local residents there was bias in some of the responses captured in the questionnaire. One way of ascertaining the bias was to structure the questionnaire such that follow up questions could assess the validity of the preceding responses. For instance, there is a correlation between the number of young people or school-going children in the demographic section of the questionnaire and the question regarding access to child welfare grants in the next section. It would be inconsistent for a respondent to say that they have children and no form of employment, but do not collect a child welfare grant. There was also a correlation between the employment, income and expenses section and the migration history section. If a respondent said that they moved to that area because of its proximity to their work place, then it is very likely that they had some form of employment and the responses in the employment section could confirm this. This is explained in more detail in section 4.7.
Figure 3. Validating the data with the community members
The second check on the data was carried out during the community feedback meeting (Figure 3). After the enumeration, the statistical data and the questionnaire response maps were presented to the communities for verification. Figure 3 shows one such meeting. At these meetings, the community members corrected any wrongly captured data as well as the initial perceptions of the author. This check was put in place to identify bias on the part of the surveyors and the author.
4.3 Timeliness
Timeliness is one of the major shortfalls of most PGIS studies. For instance, no further studies have been carried out in this area to maintain this dataset since 2010. A lack of facilities, capacity and community apathy towards repeated questionnaires are just some of the negative factors. Scholars such as Burke et al (2006) have postulated that mobile phones can be used as a medium for effective interaction between and within communities. The study proposed an architecture that could emulate existing participatory methods e.g. questionnaires and increase the quantity of community-gathered data. In addition, the growing use of mobile phones as sensors (Lane et al, 2010; Kanhere, 2011; Priyantha et al, 2011) present new opportunities for constant updating of data by local communities.
More recently, in June 2015, a practitioners workshop in Cape Town on land tenure systems titled ‘VPUU Practitioners Workshop: Urban Informal Settlement Tenure Systems in Cape
Town’ has shown that it is possible to train the local residents to
maintain the Community-Integrated GIS (CiGIS).
Figure 4. Community member updating the CiGIS
This has been facilitated by a local Community Based Organisation (CBO) called Violence Prevention through Urban Upgrading (VPUU). Open source free GIS software is being utilised to maintain the timeliness of the dataset (Figure 4). A computer was placed in the local community meet mg hall so that residents of the informal settlement could check on ownership details of shacks before purchasing them. Figure 4 shows a local resident updating information in the CiGIS in June 2015. The consistent updating of information by community members promotes the timelines as well as the temporal accuracy of the information.
4.4 Temporal Accuracy
The questionnaires included sections that recorded the dates of interviews. Further the dates of digitisation (transactional time), community meetings and subsequent changes to the datasets, printing versions etc. were all noted. In addition, the dates of
the actual photography as well as changes that were found in site that did not appear in the photography were also recorded.
4.5 Completeness
Two hundred and seventy seven shacks where included in the enumeration, which was approximately 90 % of the shacks in this settlement. Six of the inhabitants in the informal settlement were carrying out actual fieldwork, walking from door to door and filling out the survey. Consequently, they were well received since they were themselves part of the community. They were also able to collect data after hours and over weekends in order to reach community members who worked long hours and spent the day away from their homes.
In addition, although the study initially intended to assess flooding, it was noted that the existence of another hazard could influence the vulnerability of the community members. For that reason, fire too, was assessed in order to determine its contribution to the vulnerability of the community members.
4.6 Lineage
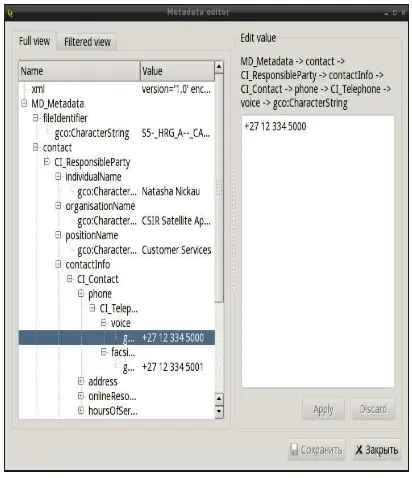
The dataset was manipulated through various stages before the mapping phase. The community captured the dataset, before it was digitised, then validated, enriched with Multi-criteria Evaluation (MCE) and finally mapped (Figure 2). Though a report was written on these steps, it would be prudent to record this information in the metadata of the GIS. Recently, the development of the Meta Tools open source GIS plugin provides a simplistic example of how the forms collecting all the lineage information, and indeed, all the data quality components (Figure 5).
Figure 5. MetaTools user interface (Source:
http://nextgis.ru/wp-content/uploads/2011/08/metatools-editor.png. Accessed on 30th June 2015)
Figure 5 illustrates a simplified user interface that allows one to capture metadata based on prescribed metadata standards such as the Federal Geographic Data Committee (FGDC) and ISO/TC 211 on Geographic information standards. This
important because as mapping technologies become more common there is an increasing need for metadata to record information on lineage, purpose and prescribed usage of spatial products (Droj, 2009). Subsequent changes in the dataset should also be versioned and recorded in the metadata. In some cases, new data was created e.g. in MCE. It is important to reflect on how all these changes influenced the final output.
4.7 Semantic Consistency
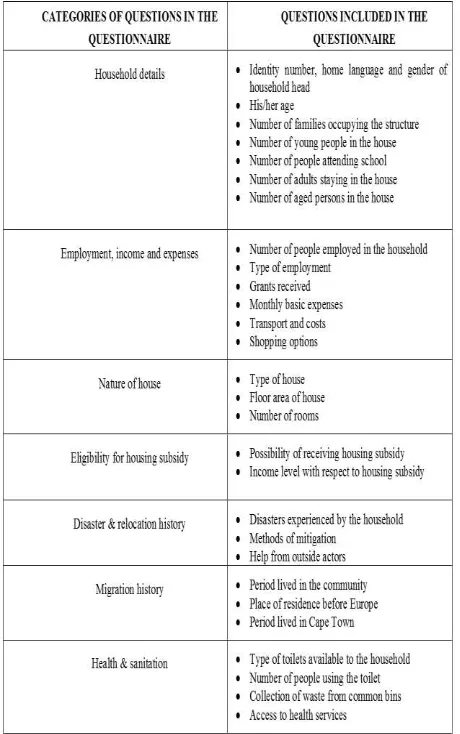
The questionnaire was designed based on the experiences within the community. Also, as earlier pointed out, there were subtle links between the categories of the questionnaire that were meant to identify as much bias as possible in the responses (Table 1). Since the questionnaire had been developed with the community, cultural and communal code of conduct was embedded in the questionnaire. For instance issues around gender and ownership were adequately recorded in the questionnaire. Responses to the various sections could be compared to assess whether they were consistent. The questionnaire was fit for purpose.
Table 1. Sections of the questionnaire (Musungu 2012: 41).
The choice of questions included a number of issues ranging from household details to health and sanitation (Table 1). Each of these sections had a bearing on the vulnerability of the household. The gender, number of people and their ages for instance when compared to the available income, could provide information on the coping capacity of the household. In
addition, the health and sanitation issues when compared to the age profile of the household could further discriminate levels of vulnerability. For instance, children and the elderly may be more vulnerable to flooding and the associated respiratory and skin diseases that are commonly found in damp or wet areas.
Figure 6. Vulnerability map showing the type of toilets used in Graveyard Pond relative to the prevalence of diseases
(Musungu 2012: 67)
Figure 6 shows an example of a map created from the health and sanitation category and Figure 7 is created from the disaster and relocation history section.
Figure 7. Raster map showing vulnerability based on efficiency of mitigation methods (Musungu 2012: 62)
It is evident from these two maps that having more questionnaire categorises provided more options for analysis and combinations of datasets but it has to be done to an extent that is fit for purpose. In fact, by assessing both maps simultaneously the analyst is able to distinguish the most vulnerable areas of the informal settlement based on the commonality of the areas showing high levels of vulnerability in the two maps.
Thus, the extent of the questions and categories covered in the study was sufficient for the purpose of assessing vulnerability in
the settlement. Though, the usage of the data in the nature of house category was hampered by the absence of biophysical flooding data.
4.8 Logical consistency
When the data was digitized, it was found that information had been erroneously captured in wrong fields and the dataset needed to be ‘cleaned’ before it could be used for statistical and mapping analysis. This could have been avoided by using drop down menus or controlling the types of datasets e.g. text, numbers etc. that could be captured in each column of the dataset.
Further, it was found that because of the spatial resolution of the aerial photography, sometimes what looked like one shack were actually two or three shacks with rooftops that had a similar spectral signature. These instances were corrected during the fieldwork by annotating the printed aerial photography and subsequently re-digitised upon returning from site. Even then, it would be an approximation of the boundaries of the three shacks since it was not possible to distinguish them from the roof tops. This had an impact on the geometric accuracy as well.
5. CONCLUSIONS
The geometric accuracy of PGIS studies could be improved with the use of GNSS products or high accuracy aerial or satellite imagery. However the data producers must be cognisant of the fact that the base data or technology only needs to be accurate enough for the purpose. For instance a study on flooding may not require sub-meter or sub-centimetre accuracy base datasets.
The semantic accuracy of PGIS studies attracts as much interest from researchers as the geometric (positional) accuracy. The information in PGIS studies must be checked for bias. This could be done by structuring the data collection methods carefully. For instance, the use of drop down menus in spreadsheets and a setting a minimum number of contributors to verify data in crowdsourcing could help reduce the bias.
The completeness of the data collected in this study was improved by letting community members collect the data. The currency of the data (timeliness) can only be maintained by finding method to collect the data continuously (temporal accuracy). Such methods may include the use of mobile technologies and community based hardware and software as in figure 4 where affordable.
The logical consistency of the data was reduced by poor data capture. Consequently the data in the columns of the spreadsheets was not consistent. This could be improved by using drop down menus and formatting spreadsheet cells.
Lineage is generally well described in PGIS studies. Most PGIS studies describe the case study communities, data collection methods, data manipulation methods and the final spatial product. However, this information should also be incorporated into the metadata for posterity.
The study shows that it is possible to apply the criteria used in traditional GIS to PGIS. It provides a starting point for PGIS studies to assess the quality of the product. Notably, this a reflective exercise on one case study, but the methodologies
used in this study have been replicated in many others undertaken by CBOs, academics and NGOs. Therefore the findings are relevant to such projects.
REFERENCES
Abbot, J., Chambers, R., Dunn, C., Harris, .T, E. de Merode, Porter, G., Townsend., J and Weiner, D. 1998. Participatory GIS: opportunity or oxymoron. PLA notes, (33), pp.27-33.
Brown, G., 2012. Public Participation GIS (PPGIS) for regional and environmental planning: Reflections on a decade of empirical research, URISA journal 24 (2), pp.7-18.
Brown, G., and Weber., G. 2012. Measuring change in place values using public participation GIS (PPGIS), Applied Geography 34, pp.316-324.
Burke, J.A., Estrin, D., Hansen, M., Parker, A., Ramanathan., N, Reddy., S, and Srivastava, MB. 2006. Participatory sensing. Center for Embedded Network Sensing
Cadag, JRD., and Gaillard, JC. 2012. Integrating knowledge and actions in disaster risk reduction: the contribution of participatory mapping, Area 44 (1), pp. 100-109.
Chrisman, N. 2010. Development in the Treatment of Spatial Data Quality in Fundamentals of spatial data quality edited by Devillers R. and Jeansoulin R. London, UK: Wiley.
Devillers R. and Jeansoulin R. 2010a. Spatial Data Quality: Concepts in Fundamentals of spatial data quality edited by Devillers R. and Jeansoulin R. London, UK: Wiley.
Devillers R., Stein, A., Bédard, Y., Chrisman, N., Fisher, P., and Shi W. 2010b. Thirty Years of Research on Spatial Data Quality: Achievements, Failures and Opportunities, Transactions in GIS 14(4), pp. 387-400
de Leeuw, J., Said, M., Ortegah, L., Nagda, S., Georgiadou, Y., DeBlois, M. 2011. An assessment of the accuracy of volunteered road map production in Western Kenya. RevCAD Journal of Geodesy and Cadastre 9, pp. 247–256.
Docan, D. C. 2013. Spatial data quality assessment in GIS. In Proceedings of the 1st European Conference of Geodesy and Geomatics Engineering; WSEAS Press: Antalya, Turkey, pp. 105–112.
Droj, G., Suba, S., Buda, A. 2009. Modern techniques for evaluation of spatial data quality. Remote Sensing 3, pp. 265– 272.
Elwood, S. 2008. Volunteered geographic information: future research directions motivated by critical, participatory, and feminist GIS, GeoJournal 72 (3-4), pp.173-183.
Fisher, P., Comber, A., and Wadsworth, R. 2010. Approaches to Uncertainty in Spatial in Fundamentals of spatial data quality edited by Devillers R. and Jeansoulin R. London, UK: Wiley.
Harding, J. 2010. Vector Data Quality: A Data Provider’s Perspective in Fundamentals of spatial data quality edited by Devillers R. and Jeansoulin R. London, UK: Wiley.
Kanhere, S.S.2011. Participatory sensing: Crowdsourcing data from mobile smartphones in urban spaces in 2011 12th IEEE International Conference on Mobile Data Management, Lulea, 6-9 June.
Karanja, I. 2010. “An enumeration and mapping of informal settlements in Kisumu, Kenya, implemented by their
inhabitants.” Environment and Urbanization 22 (1),
pp.217-239.
Kyem, PAK., 2002. Promoting local community participation in forest management through a PPGIS application in Southern Ghana, In Community participation and geographic information systems edited by William JC, Harris,T., Weiner, D., pp. 218-231. London: Taylor and Francis
Laituri, M 2003. The issue of access: An assessment guide for evaluating public participation geographic information science case studies, Urisa Journal 15(2), pp. 25-32.
Lane, N. D., Miluzzo, E., Lu, H., Peebles, D., Choudhury, T., and Campbell, A.T. 2010. A survey of mobile phone sensing. Communications Magazine, IEEE, 48(9), pp. 140-150.
Lefulebe, B., Musungu, K., Motala, S. 2015. Exploring the Potential for Geographical Knowledge Systems in upgrading Informal Settlements in Cape Town, South African Journal of Geomatics 4(3), pp. 285-298
Mans, GG., 2006. Using PGIS to conduct community safety audits, The Electronic Journal of Information Systems in Developing Countries 25.
McCall MK., 2008. Participatory Mapping and Participatory GIS (PGIS) for CRA, Community DRR and Hazard Assessment. ProVention Consortium, CRA Toolkit, Participation Resources, Geneva, Switzerland.
Musungu, K., 2012. A participatory approach to flood risk assessment in informal settlements: the case of Cape Town. MSc dissertation, University of Cape Town. Available at: https://open.uct.ac.za/handle/11427/12155 [Accessed on 30 June 2015]
Musungu, K., Motala, S., and Julian Smit., J. 2012a. Using multi-criteria evaluation and GIS for flood risk analysis in informal settlements of Cape Town: the case of Graveyard Pond, South African Journal of Geomatics 1(1), pp. 92-108.
Musungu, K., Motala S., and Mancitshana, B. 2012b. Maps and blocks: Using GIS to enhance community participation in planning informal settlements. In GISSA Ukubuzana 2012 Conference, Kempton Park, 2-4 October
Musungu, K., Jacobs, D. 2015. Participatory Web GIS: The Case of Theewaterskloof Dam, South African Journal of Geomatics, 4(3), pp. 198-212.
Pain, R., MacFarlane,R., Turner, K., and Gill, S. 2006.When, where, if, and but: qualifying GIS and the effect of street lighting on crime and fear, Environment and Planning A 38(11), pp. 2055-2074.
Pickles, J. 1995. Representations in an electronic age: Geography, GIS, and democracy. In Ground truth: The social implications of geographic information systems pp. 1-30. New York: The Guilford Press
Servigne S., Lesage, N., Libourel, T. 2010. Quality components, standards, and metadata in Fundamentals of spatial data quality edited by Devillers R. and Jeansoulin R. London, UK: Wiley.
Siebritz, LA., 2014. Assessing the accuracy of openstreetmap data in South Africa for the purpose of integrating it with authoritative data. MSc dissertation, University of Cape Town. Available at: https://open.uct.ac.za/handle/11427/9148 [Accessed on 14 August 2015]
Stein, A., and Van Oort, P. 2010. The Impact of Positional Accuracy on the Computation of Cost Functions in Fundamentals of spatial data quality edited by Devillers R. and Jeansoulin R. London, UK: Wiley.
Talen, E. 2000. Bottom-up GIS: A new tool for individual and group expression in participatory planning, Journal of the American Planning Association 66(3), pp.279-294.
Priyantha, B., Lymberopoulos, D., and Liu, J. 2011. Littlerock: Enabling energy-efficient continuous sensing on mobile phones, Pervasive Computing, IEEE, 10(2), pp. 12-15.
Quan, J., Oudwater, N., Pender,J., and Martin, A. 2001. GIS and participatory approaches in natural resources research. Socio-economic methodologies for natural resources research best practice guidelines. Chatham, UK: Natural Resources Institute.
Riazanoff, S, and Santer, R. 2010. Quality of Raster Data in Fundamentals of spatial data quality edited by Devillers R. and Jeansoulin R. London, UK: Wiley.
Rambaldi, G., Chambers, R., McCall., M, and Fox, J. 2006. Practical ethics for PGIS practitioners, facilitators, technology intermediaries and researchers, Participatory Learning and Action 54(1), pp.106-113.
Tulloch, D. 2003. What PPGIS really needs is. In Proceedings of the Second Annual Public Participation GIS Conference, 20– 22 July, Portland, OR, pp. 208-214.
Smith, J., 2000. Remote sensing to predict volcano outbursts. In: The International Archives of the Photogrammetry, Remote Sensing and Spatial Information Sciences, Kyoto, Japan, Vol. XXVII, Part B1, pp. 456-469.
Veregin, H. 1999. Data quality parameters. In Geographical information systems, 2nd Ed edited by Longley P.A.,. Goodchild M. F, Maguire D.J., and Rhind D.W., eds., Vol. 1, Chapter 12. New York, NY: Wiley, pp.177-89.
Weiner, D., and Harris, T. 2003. Community-integrated GIS for land reform in South Africa, URISA journal 15(2), pp. 61-73.